Summary:
- Despite competition, rising demand for large language models positions Google well for growth, with Q3 earnings likely to surprise positively.
- Google’s valuation is attractive, trading at a P/E ratio of 23.58x, significantly below its historical average and the broader market.
- Given its sizable net cash position, its P/E is even lower than on the surface.
- The combination of its compressed valuation and the potential for a Q3 surprise could trigger a large price surge.

FreshSplash
GOOG stock: Previous thesis and Q3 preview
My last coverage on Google (NASDAQ:GOOG, NASDAQ:GOOGL, i.e., Alphabet Inc) was published a bit more than one month ago. Under a title of “Google’s AI Expenditures Examined By $1 Test”, that article addressed the market’s concern regarding the company’s recent AI-related CAPEX investments. My key conclusion is that the market’s concern is overblown as “applying Warren Buffett’s $1 test, Google is still turning $1 of retained earnings into over $3 in market cap gain”.
Since that writing, there have been several key developments surrounding the stock. In terms of positive catalysts, the demand for large language models (LLM) kept rising and hyperscalers like GOOG should be well-positioned to capitalize on such demand. As an example, a recent Oppenheimer report found that:
Positively, enterprises realize data is the new oil, and will require/accelerate migration to the cloud to enable AI. Everyone is trying to balance latency, cost and accuracy, which often require smaller models. In addition to obvious winners of the data center race such as Microsoft, Amazon Web Services, and Google, Oppenheimer also likes second derivative plays.
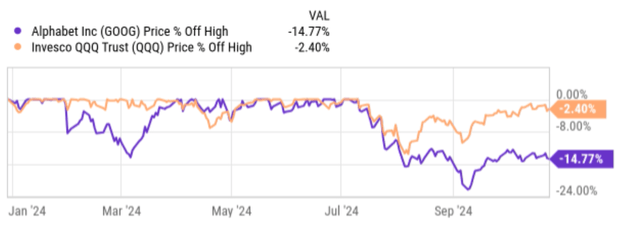
On the negative side, the competition on the AI front is intensifying and GOOG is facing some uncertainties both in the immediate term and also longer term. In the immediate term, its partnership with Anthropic is facing some antitrust concerns in the U.K. In the longer term, it is uncertain how GOOG’s AI-related technologies and products (either its own or its partners, such as Anthropic’s TPU v5e technology) can compete against rival technologies. Judging by the recent selloffs, the negatives are the prevailing forces currently. As you can see from the following chart, the overall technology sector, approximated by the Invesco QQQ Trust (QQQ) ETF, has largely moved sideways thus far this year. In contrast, GOOG has suffered a correction off its peak price levels of almost 15%.
Seeking Alpha
Another key development is the upcoming Q3 earnings report scheduled next week on October 29. The remainder of this article is largely dedicated to a preview of this Q3 earnings. Given the above negative sentiment surrounding the stock, my thesis is that the market has already priced in the negatives. In particular, Q3 is likely to be an upward surprise and trigger a large stock price rebound. As such, I consider the current price (of around $165 as of this writing) as an enticing entry point for long-term holding.
GOOG stock: Q3 could trigger large price rebound
To better contextualize things, let me quickly recap Alphabet’s Q2 earnings report on July 23, 2024. As you can see from the chart below, the results were very positive, exceeding analysts’ expectations on both lines. Normalized earnings per share (EPS) came in at $1.89, surpassing the consensus estimate by $0.05. Additionally, the company’s revenue reached $84.74 billion, exceeding projections by more than $445 million.
Looking ahead to the upcoming quarter, analysts’ projections point to a mixed picture. The consensus estimate for normalized EPS stands at $1.85, suggesting a slight decrease from the previous quarter. However, revenue is expected to increase to $86.2 billion, representing a growth of 1.8% QoQ. As a further reflection of the market’s uncertainty, over the past 90 days, 17 analysts submitted upward revisions and 17 of them submitted downward revisions.

Seeking Alpha
Such uncertainty sets the stage for a large price movement during/after the Q3 ER. I see larger odds for the price to move up considering the ongoing catalysts and the stock’s attractive valuation, as discussed immediately below in the next section.
GOOG stock: attractive valuation
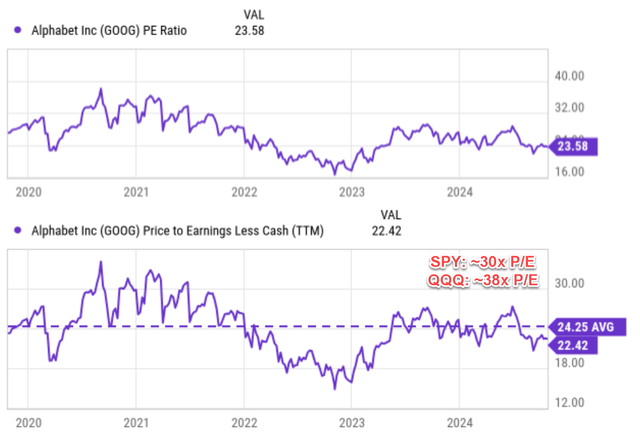
The size price correction (especially considering the divergence from the broader tech sector) has compressed GOOG’s valuation substantially and created an enticing entry price. GOOG now trades at a P/E ratio of 23.58x only, as you can see from the chart below (the top panel), near the lower end of its historical spectrum.
Investors also need to bear in mind that the company has a sizable net cash position on its ledger. To wit, GOOG ended FY Q2 with approximately $100 billion in cash (or equivalent assets) but only with about $13.0 billion in long-term debt. What’s more, its free cash flow continued to be robust, and my forecasts point to about $83.0 billion in FY 2024. The board of directors approved the company’s first-ever dividend (a quarterly cash payment of $0.20 a share) and the repurchase of an additional $70 billion in shares going forward. After the dividend and buyback, I anticipate a good chunk of net cash left to further strengthen its cash position.
Thus, when the net cash position is considered, its P/E is even lower than on the surface. As seen in the bottom panel of the chart, its P/E is only 22.4x. This is noticeably below its historical average of 24.25x and drastically lower than the broader market. For instance, QQQ currently is priced around 38x P/E and SPY around 30x P/E.
I think the price-value gap is too large here, as I consider GOOG’s profitability and growth potential to be far superior to the overall market, as detailed next.
Seeking Alpha
GOOG stock: profitability and growth potential
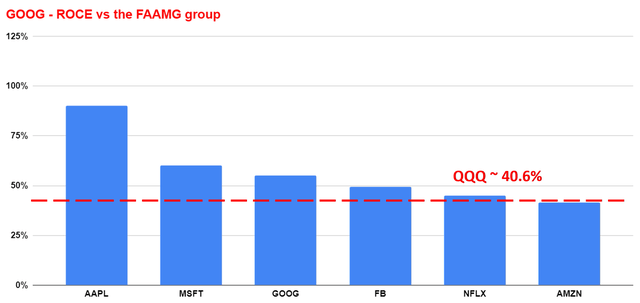
To showcase GOOG’s profitability, the next chart compares its ROCE (return on capital employed) against the rest of the FAAMNG stocks and also the broader tech sector. The ROCE of GOOG has been about 54% on average in the past 3 years by my calculation. This level of ROCE compares favorably against the FAAMNG group – a group of overachievers. For the general tech sectors approximately by QQQ, the average ROCE is ~40% by my estimate (and by the way, the average of SPY is about 20% as an additional reference point).
Author
Going forward, I anticipate GOOG’s superior profitability to persist or even further improve given its vast scale, market-leading position, and also the ongoing initiative. It is a true internet powerhouse in my view and derives its income streams from some of the areas best positioned for secular growth.
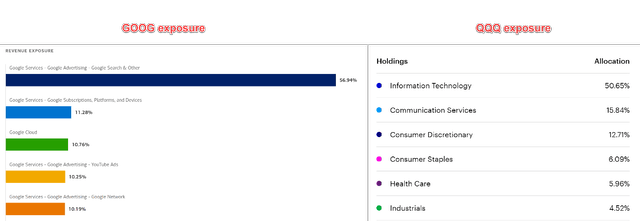
Let me cite a few notable examples from the chart below. GOOG currently derives about 57% of its revenues from Google Search & Other, highlighting its dominance in the search space. Google services (which include its subscription, platforms, and also devices) contribute about 11% and complement the search business extremely well. Google Cloud is the 3rd largest contributor (around 10%). In its Q2 report, Google Cloud just surpassed $10 billion in revenues and $1 billion in operating profit, a record achievement for the segment. With the strong demand for LLM and AI-related applications mentioned before, I am optimistic that such momentum will be reflected in its Q3 earnings and will continue in the next few years. In contrast, QQQ has sizable exposure (as shown in the right panel of the following chart) to less promising areas (i.e., in terms of growth) in my view, such as consumer staples (~6%), healthcare (~6%), and industrials (~4.5%).
BOA and QQQ webpage
Other risks and final thoughts
Looking past Q3, the chart below shows the consensus EPS estimates for GOOG stock in the next 5 years. As seen, the consensus estimate for the full fiscal year of 2024 is $7.65, representing a significant year-over-year growth of 31.96%. This positive trend is expected to continue, with EPS estimates increasing eventually to $13.57 for FY 2028. Overall, analysts’ estimates point to a compound annual growth rate (“CAGR”) of approximately 16% in the next few years.
The forward P/E ratio based on FY1 EPS is about 21.8x. The ratios are expected to decrease quickly as its EPS growth (e.g., to only 19x in FY 2025). Such multiples translate into very attractive PEG ratios (P/E growth ratio) for GARP investors (growth at a reasonable price). An FWD P/E of 21.8 and an expected growth rate of 16% imply a PEG ratio of 1.36x. The effective PEG ratio is even lower when the cash position is adjusted as aforementioned. In contrast, my estimate for QQQ and SPY PEG ratios are somewhere between 3x and 4x, assuming an annual earnings growth rate of 8~10% for the broader market.

Seeking Alpha
In terms of downside risks, the competition risks and uncertainties surrounding its AI initiatives are the main risks in my view. Besides, the antitrust and privacy concerns mentioned earlier, rivals such as MSFT and OpenAI are also rolling out new features with their products to challenge GOOG’s dominance in the search space, with OpenAI’s SearchGPT as the latest example. Given its scale and dominance in certain segments such as search, there is a remote chance that the U.S. DOJ could push for a breakup of the company into independent pieces. However, it is not clear to me if such a breakup could be a negative for sure in terms of shareholder returns. Given its current valuation multiple, a breakup might provide better clarity in its valuation and lead to shareholder gains.
To conclude, the goal of this article is to incorporate recent developments surrounding GOOG and provide a preview of its Q3 earnings. My overall assessment is that Q3 is very likely to surprise the market in a positive direction, given the ongoing demand for LLM and GOOG’s strategic position on this front. Combined with the stock’s compressed valuation, such a surprise could trigger a large price surge.
Analyst’s Disclosure: I/we have no stock, option or similar derivative position in any of the companies mentioned, and no plans to initiate any such positions within the next 72 hours. I wrote this article myself, and it expresses my own opinions. I am not receiving compensation for it (other than from Seeking Alpha). I have no business relationship with any company whose stock is mentioned in this article.
Seeking Alpha’s Disclosure: Past performance is no guarantee of future results. No recommendation or advice is being given as to whether any investment is suitable for a particular investor. Any views or opinions expressed above may not reflect those of Seeking Alpha as a whole. Seeking Alpha is not a licensed securities dealer, broker or US investment adviser or investment bank. Our analysts are third party authors that include both professional investors and individual investors who may not be licensed or certified by any institute or regulatory body.
As you can tell, our core style is to provide actionable and unambiguous ideas from our independent research. If your share this investment style, check out Envision Early Retirement. It provides at least 1x in-depth articles per week on such ideas.
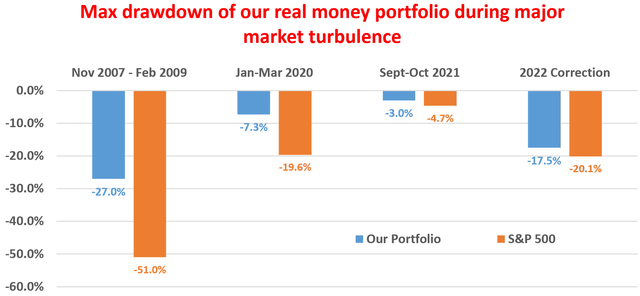
We have helped our members not only to beat S&P 500 but also avoid heavy drawdowns despite the extreme volatilities in BOTH the equity AND bond market.
Join for a 100% Risk-Free trial and see if our proven method can help you too.
