Summary:
- Information wants to be free. But the cost to obtain information used to be very expensive.
- Take maps as an example, a city map cost me about $3 before Alphabet Inc.’s Google maps.
- And Google’s true moat is its ability to reduce the marginal cost of information.
- Now, the cost of obtaining a city map, or a bunch of city maps, is almost zero.
- This Google moat is incredibly stable and scalable. The ongoing AI advancement will fill it with even more crocodiles.
Jeff J Mitchell/Getty Images News
Thesis
Why am I bullish about Alphabet Inc. (NASDAQ:GOOG, NASDAQ:GOOGL) aka Google? Many reasons. I’ve written articles about its specific business operations and finances before. And today’s thesis will focus on a more basic and fundamental point of view: the marginal cost of information. I will explain why Google’s true moat is its ability to reduce the marginal cost of information, and why this is an incredibly durable and scalable moat. Marginal cost is the cost that comes from producing one additional item. And Google has reduced such marginal cost to essentially zero in most of the areas that it has touched.
Next, I will use Google Maps as a primary example to elaborate on the above thesis. I use Google Maps because it is the App that I am sure every one of us has used (and many of us, like this author, now cannot live without). But the same argument really applies to the many other Google products, ranging from its ubiquitous search engine, to Google Docs, to many of its cloud computing Apps.
Marginal cost of information
Information used to be expensive. For example, when I was a graduate student in the San Francisco Bay area (back in the 2000s), and needed to interview with Google, I required a city map – a paper map that would cost about $3. And if I needed to interview with another company in the area (say, Apple), I would need another map, which would cost me another $3.
Today, digital maps that we use for “free” still have a cost, but the cost has become fixed. For example, Google has spent a ton of money to make its maps App and pays an ongoing cost to maintain it. It is difficult to determine exactly how much money Google spent to develop Google Maps, as the development of the platform was integrated with other projects and was spread out over many years. My estimate is that Google has invested more than $10 billion since its launch in 2005, and it spends about ~ $1 billion a year to update/maintain it.
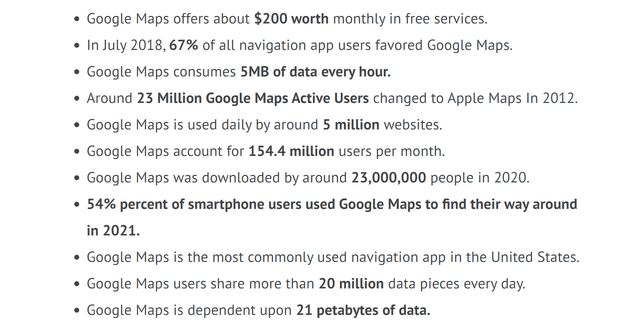
But once the fixed cost has been paid, the cost to each user to obtain a map from Google has become essentially zero now. Or, in other words, the cost for Google to offer an additional map to an additional user has become essentially free. And when you can reduce the marginal cost of ANY useful piece of information to zero, the world will help you find plenty of monetization opportunities. And the list below provides a good glimpse into its potency. As seen, Google Maps alone is estimated to provide $200 worth of free services to each user.
Google: Marginal profitability
As aforementioned, many other Google products have done the same. Its search engine has reduced the marginal cost of an additional search to zero. It is kind of like each of us can obtain any number of encyclopedias and reference books for free. Running a traditional ad is expensive. And running it twice did not make it cheaper by too much. But Google ads changed this fundamentally, too.
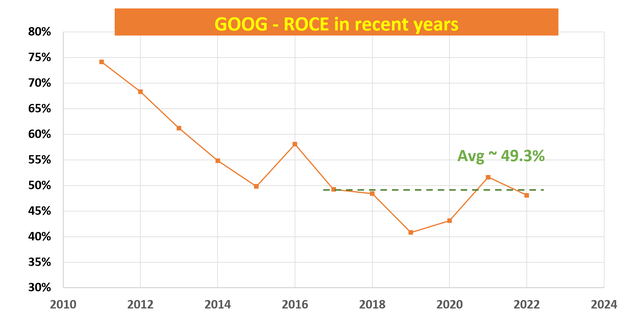
Google’s ability to reduce the marginal cost of providing information is the root of its profitability. Moreover, I view it as a strong and durable root as you can see from the following two charts below. The first chart shows ROCE (return on capital employed) for GOOG as detailed in this article.
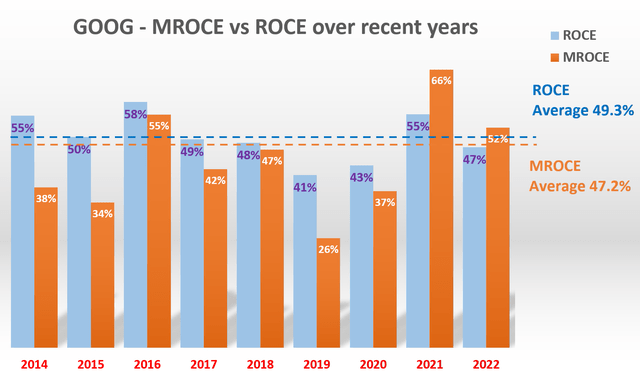
In this article, since the focus is on the marginal cost of producing information, I want to draw your attention to the next two charts. These charts illustrate the concept of marginal return on capital employed (“MROCE”) and Google’s MROCE, demonstrating the profitability brought about by its ability to reduce the marginal cost of information. A detailed explanation of the method that I used to compute the MROCE is provided in my earlier article here. The basic steps are:
- The calculation is based on the ROCE data corresponding to the figures shown in the chart above.
- The MROCE data was then obtained using these steps: A) the capital employed (“CE”) was calculated annually, B) the year-over-year incremental CE was computed, C) the year-over-year incremental earnings were calculated, and D) the MROCE was determined by dividing B by C.
Since the MROCE represents the marginal profit produced by employing an additional unit of capital (say, to provide an additional Google map), MROCE provides insight into the direction of future profitability and scalability. As seen, GOOG’s MROCE has averaged 47.2% over the previous years, matching its ROCE closely. The minor difference could be attributed to rounding errors or financial uncertainties, but the overall consistency demonstrates its sustainability and scalability.
Risks, expected returns, and final thoughts
Google faces risks, too. Besides macroeconomic risks (say a recession that severely shrank the ad budget), it also faces competition risks constantly. Although Google dominates the search engine market, it faces competition from other established search engines (like Microsoft’s Bing, Yahoo, and Baidu) and also emerging technologies (like Chatbots). In the meantime, Google faces regulatory scrutiny and lawsuits constantly too. Regulators around the world are concerned about its business practices, particularly in the areas of antitrust and data privacy.
However, my view is that these risks have been more than priced in already at GOOG’s current valuations. I view the valuation as discounted and expect a lucrative return potential when the discount is combined with its profitability and scalability. My return projections are summarized in the following table. The key assumptions in the projections are that GOOG maintains a ROCE of around 49.3% and reinvestment rates of around 10%, resulting in a 4.9% sustainable growth rate.
I think these assumptions are very reasonable given the ROCE and MROCE data analyzed above and the root of its moat. In terms of P/E, its FW multiples are in the range of 14x to 20x (as shown in the second chart below) based on accounting EPS for the next few years. As detailed in my earlier article, my assessment is that the accounting EPS systematically underestimates its earnings power by 10% to 15%. Thus, in terms of owners’ earnings, my estimate of its FY1 P/E is around 17x, translating into an owners’ earnings yield of 6.8%.
All told, my projected return for Google is almost 12% per annum, consisting of 6.8% from owners earning yield and 4.9% from growth rates. And finally, I view my estimate here to be on the conservative side for several reasons. First, the Google growth rate quoted here is the real growth rate without the inflation escalator included yet. And second, I have not included its disruptive growth potential in new areas.
Going forward, I see Google’s AI advancement will further reduce the marginal cost of providing information and further widen its moat. Its prominent position in its key segments (search engine, digital ad), when aligned with its ongoing AI foothold, forms a strong strategic combination. And in my view, Google has a quite strong AI foothold with DeepMind and Google Cloud AI.
Source: Author based on Seeking Alpha data. Source: Seeking Alpha data.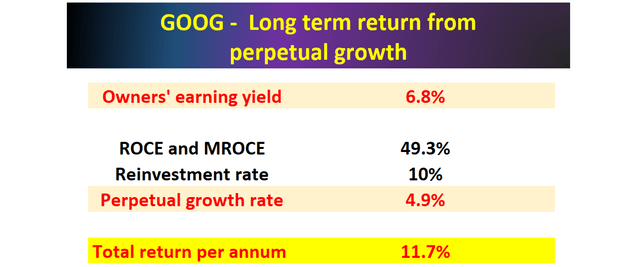

Analyst’s Disclosure: I/we have no stock, option or similar derivative position in any of the companies mentioned, and no plans to initiate any such positions within the next 72 hours. I wrote this article myself, and it expresses my own opinions. I am not receiving compensation for it (other than from Seeking Alpha). I have no business relationship with any company whose stock is mentioned in this article.
Seeking Alpha’s Disclosure: Past performance is no guarantee of future results. No recommendation or advice is being given as to whether any investment is suitable for a particular investor. Any views or opinions expressed above may not reflect those of Seeking Alpha as a whole. Seeking Alpha is not a licensed securities dealer, broker or US investment adviser or investment bank. Our analysts are third party authors that include both professional investors and individual investors who may not be licensed or certified by any institute or regulatory body.
As you can tell, our core style is to provide actionable and unambiguous ideas from our independent research. If your share this investment style, check out Envision Early Retirement. It provides at least 1x in-depth articles per week on such ideas.
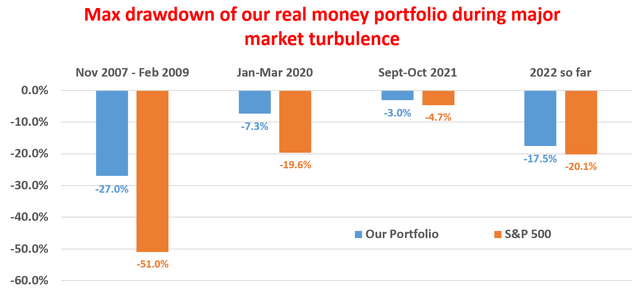
We have helped our members not only to beat S&P 500 but also avoid heavy drawdowns despite the extreme volatilities in BOTH the equity AND bond market.
Join for a 100% Risk-Free trial and see if our proven method can help you too.
