Summary:
- The past few months have been a bumpy time for Halliburton Company, as the stock materially underperformed the market.
- Despite a recent stock price decline, the company’s financial performance remains strong, with revenue growth and improved operating income.
- Investors should keep an eye on upcoming financial results and industry trends to assess the company’s future performance and potential for growth.
zhengzaishuru
With a market capitalization of $29.76 billion as of this writing, Halliburton Company (NYSE:HAL) is a massive player in the energy services industry. Even though the general environment looks bullish for oil and natural gas at this point, shares of the company are going through a bit of pain. You see, back in April of this year, I wrote an article that took a bullish stance on the firm. I ended up rating the company a ‘buy’ because of a favorable oil environment, robust financial performance, and the fact that shares were attractively priced. Even so, the stock has fallen 12.7% since then, at a time when the S&P 500 is up 13.1%.
As disappointing as this is, I am not deterred. More recent data provided by management does paint something of a mixed picture. In the near term, I think it’s even possible that the company could see a bit of pain from a fundamental perspective. But given how shares are currently priced, both on an absolute basis and relative to similar enterprises, I think that my bullish sentiment was not misplaced. This does not mean that the picture cannot change, either for the better or worse.
I say this because it’s important to remain flexible in our thinking when it comes to investing, especially in the energy market. The good news is that investors will soon have additional clarity as to the health of the company. This is because, before the market opens on July 19th, management is expected to announce financial results covering the second quarter of the company’s 2024 fiscal year. Leading up to that point, analysts were bullish from a revenue and profit perspective. But as with any company at any point, investors would be wise to keep a close eye on things and see to what extent that picture might change.
A look at recent results
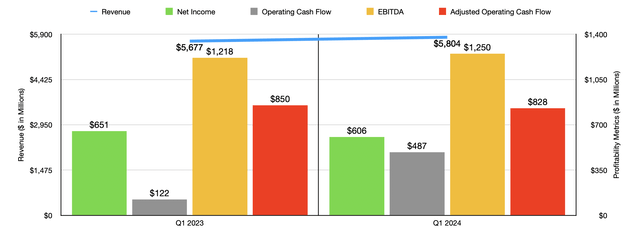
When I last wrote about Halliburton earlier this year, we had data covering through to the end of the 2023 fiscal year. Today, results now cover through the first quarter of 2024. That would probably be a good starting point for us to use. During the first quarter of the year, management reported revenue of $5.80 billion. That marks an increase of 2.2% compared to the $5.68 billion generated just one year earlier.
This was driven entirely by the company’s Drilling and Evaluation segment, which provides a wide array of services like field and reservoir modeling, drilling, fluids, evaluation services, well bore placement solutions, and more. During the quarter, the company generated $2.43 billion from this set of operations. That’s 7.2% higher than the $2.27 billion generated the same time one year earlier. Management attributed this increase in revenue to stronger demand for drilling related services in the Middle East and North America, as well as to improved activity in certain parts of its business in Latin America. Higher fluid services revenue in Europe also aided to this top-line growth.
By comparison, the company’s Completion and Production segment was a source of weakness for investors. Revenue of $3.37 billion came in 1.1% lower than the $3.41 billion generated one year earlier. For context, this is the part of the company that provides cementing, stimulation, specialty chemicals, intervention, pressure control, artificial lift, and completion products and services to its customers. Even though the segment benefited from improved completion tool sales in certain parts of the world, as well as higher stimulation activity in Latin America and higher cementing and artificial lift activity in various markets, pain was caused by reduced pressure pumping services in the US.
While revenue increased, profitability for the company took a step back. Net income dipped from $651 million to $606 million. Part of this was because of one-time costs. For instance, the company had some upgrading expenses totaling $34 million. It also saw a worsening of its “other” expenses from $47 million to $108 million. This surge was driven primarily by an $82 million impairment that the company booked on an investment in Argentina, as well as from costs associated with the currency devaluation in Egypt. At least you can say that these are one time pain points for the company rather than something more structural.
If you actually look at the operating income of each of the firm’s segments, you would actually see an improvement year over year. The Drilling and Evaluation segment reported an increase in income from $369 million to $398 million, while the Completion and Production segment saw a rise from $666 million to $688 million. Other profitability metrics were mostly positive. Operating cash flow expanded from $122 million to $487 million. If we adjust for changes in working capital, we do get a decline from $850 million to $828 million. However, this is offset to some extent by the fact that EBITDA for the business expanded from $1.22 billion to $1.25 billion.
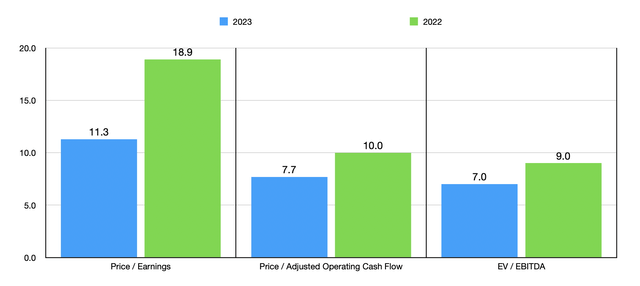
Unfortunately, it’s still too early into the 2024 fiscal year to reliably project out what financial performance might look like for the rest of the year. This is especially true, because management has not provided guidance. But if we use historical results from 2022 and 2023, shares look reasonably attractive. In the chart above, you can see how the stock is priced based on these metrics. Using the 2023 figures, shares are especially appealing. And in the table below, I decided to compare Halliburton to five similar firms. On a price to earnings basis, two of the five were cheaper than it. But this number drops to one of the five when we use the other two profitability metrics.
| Company | Price / Earnings | Price / Operating Cash Flow | EV / EBITDA |
| Halliburton | 11.3 | 7.7 | 7.0 |
| Baker Hughes (BKR) | 19.3 | 10.3 | 9.9 |
| Tenaris S.A. (TS) | 5.2 | 4.2 | 3.1 |
| NOV Inc. (NOV) | 7.4 | 22.5 | 8.4 |
| SLB Inc. (SLB) | 15.4 | 10.1 | 9.8 |
| ChampionX (CHX) | 17.8 | 10.4 | 8.4 |
What to keep an eye on
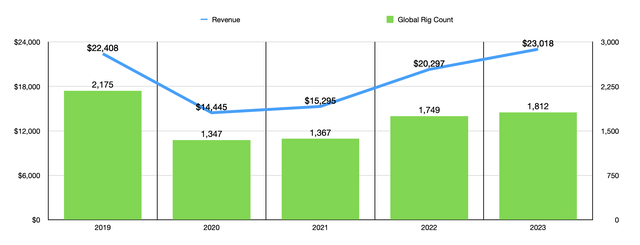
Even though I am currently rating Halliburton a “buy,” I do think that some of the uncertainty that investors might have regarding the company is not displaced. Currently, even though energy prices are high, there are some data points that suggest a weakening of demand for the services of companies like this. For instance, in the first quarter of this year, there were 831 drilling rigs in operation in North America. That’s down from the 981 in operation one year earlier. It is true that the number of international rigs is up, having risen from 915 last year to 965 this year. But that doesn’t change the fact that total global rigs are down from 1,896 to 1,796 in the course of a single year.
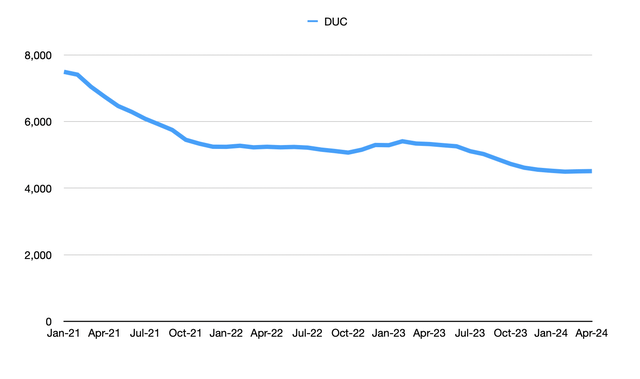
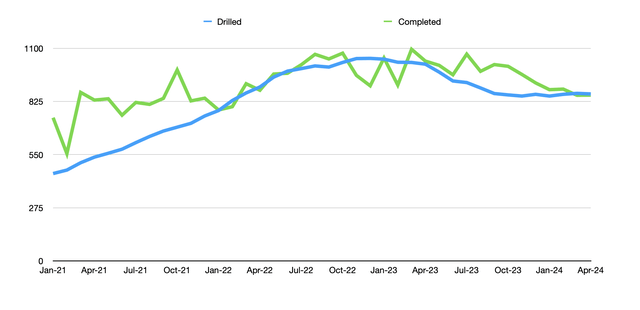
The fact of the matter is that revenue for the company does typically follow rig activity patterns. In the chart above, you can see revenue for each of the past five years and how that stacked up against the number of global rigs in operation. So far this year, the company is bucking the trend. But this doesn’t mean that things will stay this way for long. The fact of the matter is that we are also seeing some questionable activity when it comes to drilled, completed, and DUC (drilled but uncompleted) wells in the US. Considering that 44% of the company’s revenue comes from North America, this is important to it.
For the first four months of this year, the number of drilled wells totaled 3,446. That’s down 16.3% from the 4,117 wells reported for the same four months of last year. The number of wells completed, meanwhile, has fallen by 14.6% from 4,089 to 3,490. And from April 2023 through April of this year, the number of DUC wells has fallen from 5,323 to 4,510. That’s a year-over-year drop of 15.3%. We have started to see some improvement over the past couple of months. For instance, in March of this year, the number of drilled wells was the highest it had been dating back to August 2023. And for two months in a row, ending in April, we have seen DUC counts rise sequentially. The increase seen in March was the first such improvement experienced since February 2023.
Any sort of drilling and completion activity that is uptrending should be considered positive for the business. That means demand for its services is on the rise. The fact that the industry has seen a general downtrend is indicative of weakness. Of course, a case could also be made that if DUC wells rise by too much, then revenue for the company in the future could be deferred on the Completion and Evaluation side of things. But considering that DUC wells are near 10-year lows, I think that, if anything, this would indicate the potential for the build-up of additional drilled wells.
In the near term, reduced drilling and completion activities could cause some pain for the company. But the good news on this front is that global oil production specifically is expected to continue rising. In the second quarter of this year, according to the EIA (Energy Information Administration), the global supply of oil is expected to be around 102.06 million barrels per day. By the final quarter of this year, it’s expected to grow to 103.11 million barrels per day. And by the final quarter of 2025, it’s expected to hit 105.61 million barrels per day. And for the US on its own, natural gas production is expected to be about 1.6% higher next year than it is forecasted to be this year.
It is with this uncertainty in mind that investors would be wise to pay careful attention to what new data comes out when management reports financial results in the coming days. At present, analysts are pretty bullish. They expect revenue of $5.95 billion. That would be up from the $5.80 billion reported for the second quarter of 2023. They also expect earnings per share to be $0.80. That would be an improvement over the $0.68 per share reported for the second quarter of last year. It is worth noting that the company had an irregular expense of $104 million during that time. So if we adjust for that, earnings per share last year were $0.77. Even this could be a bit odd considering that management has been buying back a great deal of stock. From the first quarter of 2023 to the first quarter of 2022, the firm reduced its share count from 907 million to 891 million. Further reductions are likely and could impact total net income.
If we assume that there is no change in share count, and if analysts are correct, then net income should rise from $610 million last year to $713 million this year. There are no forecasts from analysts regarding other profitability metrics. But likely, these will also increase if analysts are correct about revenue and earnings. In the table above, you can see what these were in the second quarter of 2023.
Takeaway
I understand why investors might be a bit cautious regarding Halliburton right now. But on the whole, the company appears to be very solid. There could be some short-term pain in the not too distant future. And investors would be wise to be on the lookout for indicators of that. However, for now, Halliburton Company shares look attractively priced, both on an absolute basis and relative to similar firms. And absent anything major coming out of the woodwork, I suspect that the bullish assessment that I originally gave the company earlier this year will prove itself out.
Editor’s Note: This article discusses one or more securities that do not trade on a major U.S. exchange. Please be aware of the risks associated with these stocks.
Analyst’s Disclosure: I/we have no stock, option or similar derivative position in any of the companies mentioned, and no plans to initiate any such positions within the next 72 hours. I wrote this article myself, and it expresses my own opinions. I am not receiving compensation for it (other than from Seeking Alpha). I have no business relationship with any company whose stock is mentioned in this article.
Seeking Alpha’s Disclosure: Past performance is no guarantee of future results. No recommendation or advice is being given as to whether any investment is suitable for a particular investor. Any views or opinions expressed above may not reflect those of Seeking Alpha as a whole. Seeking Alpha is not a licensed securities dealer, broker or US investment adviser or investment bank. Our analysts are third party authors that include both professional investors and individual investors who may not be licensed or certified by any institute or regulatory body.
Crude Value Insights offers you an investing service and community focused on oil and natural gas. We focus on cash flow and the companies that generate it, leading to value and growth prospects with real potential.
Subscribers get to use a 50+ stock model account, in-depth cash flow analyses of E&P firms, and live chat discussion of the sector.
Sign up today for your two-week free trial and get a new lease on oil & gas!

