Summary:
- Several high-quality dividend growth stocks that are trading near 52-week lows and at a discount to their fair value based on Historical and Future valuations are highlighted.
- An in-depth update for Nike is completed, and it appears to be attractively valued for long-term investment.
- Other companies that may also be attractively valued include: ResMed, MarketAxess, NextEra Energy, QUALCOMM, Pfizer, Bristol-Myers Squibb, and Elevance Health.
Thank you for your assistant
Introduction and Background
The last time I wrote, I was having a hard time finding good value in the market. Since then, I’ve been pleasantly surprised that many high-quality, dividend growers that I regularly track have come into my fair valuation zone, allowing me to initiate and add to many holdings. By tracking around 100 of the highest quality dividend growth stocks on a regular basis, I am prepared to invest when they enter fair valuation.
One of my favorite ways of looking for potential value in this high-quality dividend growth space is to screen for those stocks trading near 52-week lows. For this exercise, I decided to filter my watchlist by companies that are trading at less than 30% of their 52-week range (52-week low being 0% and 52-week high being 100%).
Using this first pass criteria, we will be looking at the following list of companies:
FinBox, Seeking Alpha, Author’s Analysis FinBox, Seeking Alpha, Author’s Analysis

Fair Value Estimation
As I’ve described in previous articles, I like to calculate a fair value in two ways, using a Historical fair value estimation, and a Future fair value estimation. The Historical Fair Value is simply based on historical valuations. I compare 5-year average: dividend yield, P/E ratio, Schiller P/E ratio, P/Book, and P/FCF to the current values and calculate a composite value based on the historical averages. This gives an estimate of the value assuming the stock continues to perform as it has historically. I also want to understand how the stock is likely to perform in the future so utilize the FinBox fair value calculated from their modeling, a Cap10 valuation model, FCF Payback Time valuation model, and 10-year earnings rate of return valuation model to determine a composite Future Fair Value estimate.
I also gathered a composite target price from multiple analysts including Reuters, Morningstar, Value Line, FinBox, Morgan Stanley, and Argus. I like to see how the current price compares to analyst estimates as another data point, and as somewhat of a sanity check to my own estimates.
Plotting three variables on one plot is tricky but using a bubble plot allows us to visualize three variables by plotting the Historical fair value versus the Future Fair Value on a standard x-y chart, and then use bubbles to represent the size of discount relative to analyst estimates.
Author calculation of Historical and Future Fair Value, analyst estimates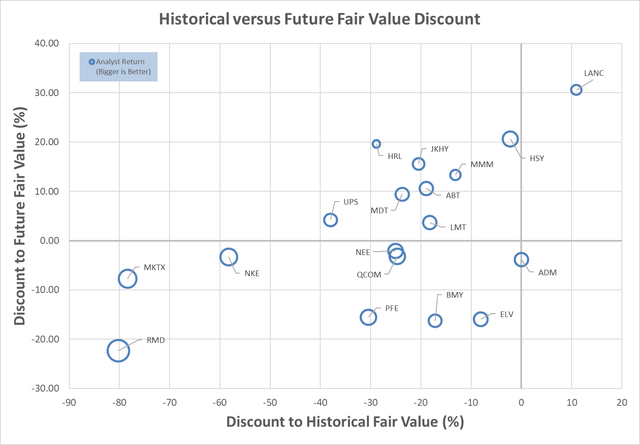
This chart is insightful once you understand how to interpret it. What we are looking for are stocks that are trading at a discount to both the Historical Fair Value and the Future Fair Value. So, those stocks that are farther to the left, and farther to the bottom, are potentially the stocks trading at the largest discount to fair value. This would be the bottom left quadrant of the graph. Additionally, those stocks with the biggest bubbles are the stocks that are trading at the largest discount to analyst estimates, so in theory, stocks in the lower left quadrant that also have large bubbles, should be very decent candidates for investment.
I am really pleased to see that there are several candidates that look very promising based on this analysis – more than there have been in a while.
Digging into this chart suggests that ResMed (RMD), MarketAxess (MKTX), NIKE (NYSE:NKE), NextEra Energy (NEE), QUALCOMM (QCOM), Pfizer (PFE), Bristol-Myers Squibb (BMY), and Elevance Health (ELV) are attractively valued from a Historical and Future Fair Value perspective.
I currently own all these stocks and believe that each could be an excellent candidate for further investigation, and potential investment, especially for long-term investors.
Additionally, I have recently published articles on ELV here, and BMY here, that I believe are still very relevant for further investigation.
The most recent purchase that I have made from the above candidates is Nike when it’s price fell below $92. It has been a while since I covered Nike. I don’t especially like to make purchases right before earnings are announced, especially when a stock has been trending down, but in this case, there are two reasons I decided to invest, in addition to being potentially attractively valued. First, it is trading close to 52-week lows (obviously the theme of this article), and it has also fallen more than 20% below my most recent purchase price, which isn’t an automatic trigger for me to buy more but is a trigger for me to investigate further. So, with that in mind, let’s do just that.
Nike Preliminary Analysis
I like to start simple when analyzing companies. Nike has a 5-year average Return on Equity of 39.2% and Return on Invested Capital of 24%. These are excellent number and the RoE and RoIC numbers are reasonably close, suggesting that management is likely not using excessive debt to increase RoE. Morningstar’s Wide Moat and Exemplary capital management ratings are excellent. Nike is currently 4-star rated at Morningstar, suggesting it could be attractively valued. Now, looking at the dividend, Nike’s 42% Earnings-based payout ratio and 43% Free Cash Flow-based payout ratios suggest the dividend is comfortably covered and sustainable. The 5-year dividend growth rate of over 11% is also very good, though the starting yield around 1.5% is also low, and likely not attractive for shorter term income-oriented investors. With my estimated growth rate for Nike being above the dividend growth rate, I feel this is a safe, attractive investment option, especially for the long-term, dividend growth investor.
Nike Strategy and Background
For a deeper dive into Nike’s strategy and background, as well as some of the risks that are involved with a company like Nike, I would refer you to the last article that I wrote about Nike here, which I believe is still relevant to these topics.
Nike Historical Valuation Analysis
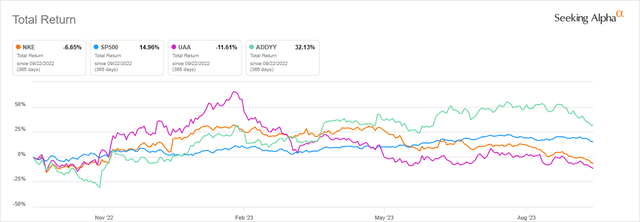
I always like to start my historical assessment of a stock with a look at performance compared to the S&P500 and relevant peers over the past. This isn’t particularly useful by itself, but can provide an indication of potential, as well as sentiment. It’s interesting that the last time I wrote about Nike, it had outperformed the S&P500 and its peer significantly. Currently, with the downturn over the past year or so, it has now underperformed significantly over the 5-year period. This could be an indication of a business in significant decline or could also be an indication of pessimism that might not be wholly merited. As stated earlier, Nike is down over 20% from the last time I purchased it.
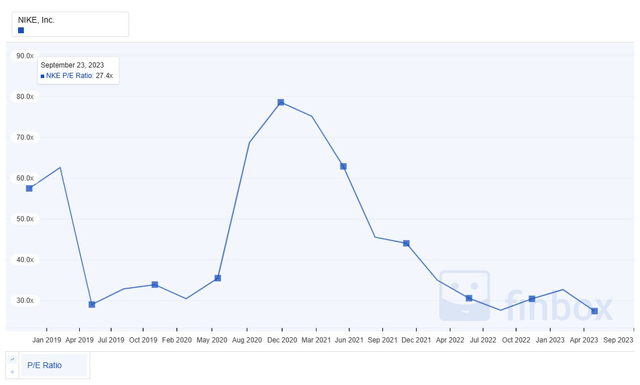
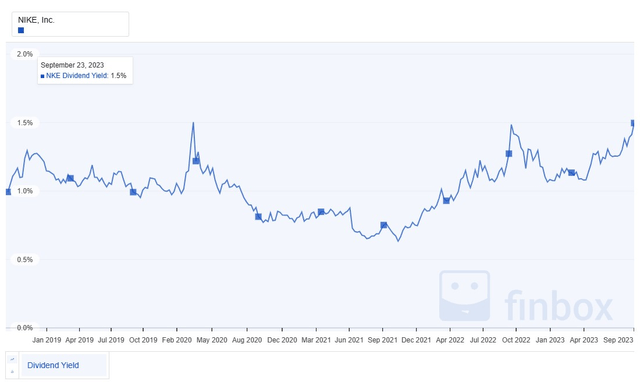
Two of the fundamentals I like to investigate further are historic P/E and yield. Low P/Es relative to history, coupled with high yields compared to history can often indicate attractive valuation, assuming the underlying business is sound.
Nikes’s 5 year average P/E chart shows that this can be a somewhat volatile holding, which is all the more reason to look for times to buy at good valuation. Nike’s 5 year average P/E is around 45.6 – valued for its growth. The current P/E of 27.4 is well below that historical average, and one of the lowest multiples in the past 5 years. Clearly, the market expects the growth story is at risk.
From a yield perspective, Nike is also at a high compared to its 5-year history. The 1.5% yield compared to the average of 1, though not a high yield, is high compared to the average, suggesting it could be attractively valued on a yield basis, or in decline.
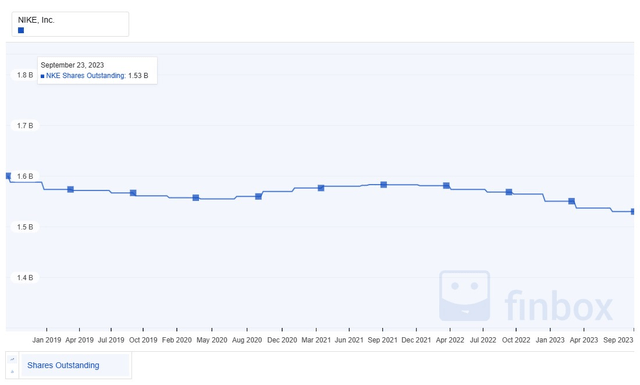
A key part of the Total Shareholder Return includes stock buybacks, which are also important to dividend growth sustainability. Nike has a solid history of share buybacks which have decreased the number of shares outstanding for shareholders. This is an important part of a sustainable dividend growth strategy.
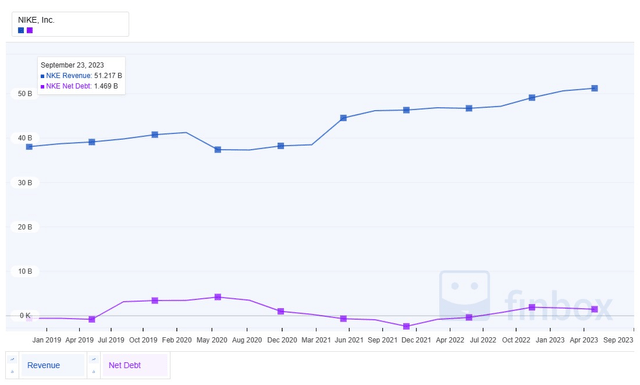
Nike has excellent financials, with fairly consistent revenue growth, and low net debt levels. The growth in revenue, coupled with low debt levels, is also important for sustained dividend growth. Additionally, this growth in revenue without leveraging debt is a key competitive advantage that allows Nike the flexibility to continue to invest, and thereby ward off the competitive advances inherent to this business.
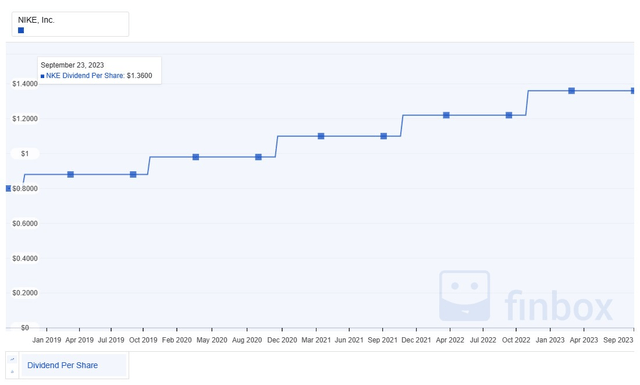
Nike has been paying a growing dividend for around 21 years, depending on the source, and has been paying a dividend for 33 years. Their growth has been stable and consistent. The 5-year average is around 11%, with the most recent raise being right in line. The starting yield may not be great, but the long-term growth potential can make up for that over time.
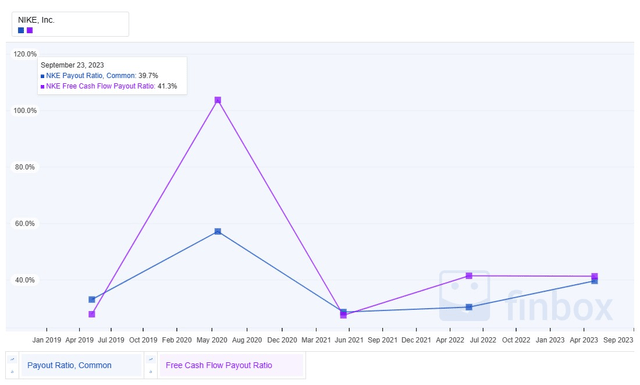
Obviously, dividend growth doesn’t do any good if the growth is not sustainable. In this case, Nike’s free cash flow-based payout ratios have remained consistent and conservative. The payout ratios did rise during COVID, however, normally, the ratios stay below 50%, which coupled with Nike’s business growth, offer a lot of protection for the dividend, as well as potential for sustained growth.
The story of stocks in companies like Nike are a growth story. When the growth story is intact, the multiples will be high, and the stock prices will climb. When that story comes into question, the multiples will become shaky, and the prices will fall. If confidence in the growth story returns, the stock will likely take off again. Based on the historical indicators assessed, Nike appears to be very attractively valued. Additionally, this is a strong, high-quality business with resources and margin to continue to pay a growing dividend into the future.
Nike Future Valuation Analysis
Because we want our dividends to grow in the future, not just the past, we need confidence that the results the company has already achieved will likely continue. We are looking for evidence that the drop in pricing and valuations is temporary, not an indication of a change in fortune.
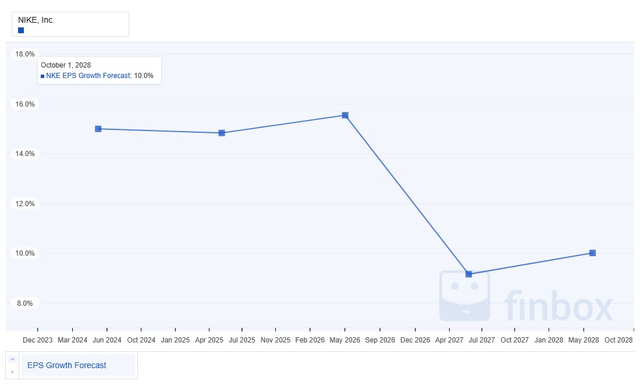
Looking at future Earnings Per Share projections, Nike is projected to have solid low-double digit, to high single digit growth moving forward. For a stock that has seen prices that project decline, that is a positive surprise.
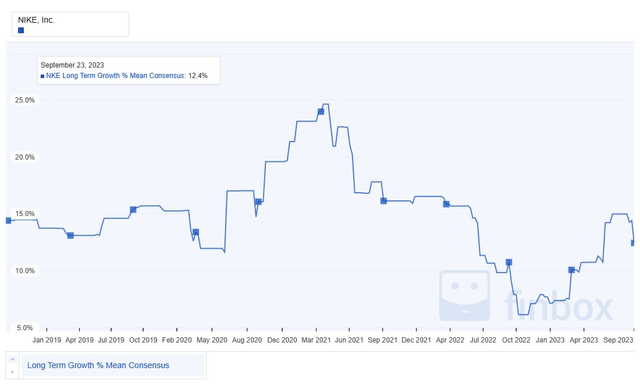
Growth is one of the hardest things to predict in investing, otherwise, investing would be much simpler. Though we are thinking about the future in this section, I like to look at the history of growth forecasts to see how they align with the future predictions. Past predictions are well aligned with the future predictions, suggesting that the current consensus does not predict a significant deviation from past growth results.
My own estimate for Nikes’s forward growth is around 13%. I derive this from a combination of various growth projections and growth models. I personally feel like the growth story is still intact, and supports my assessment that this is a high-quality dividend growth investment at the right valuations.
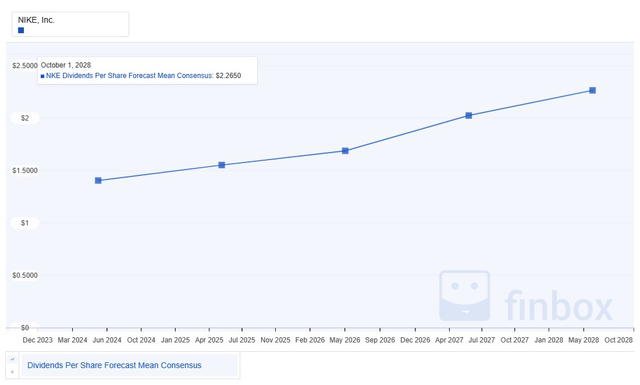
For a dividend growth investor, understanding future dividend growth potential is also important, especially in as much as it is sustainable. Here are the long-term dividend growth projections for Nike. It looks like the future growth in the dividend is projected to be as stable as past growth.
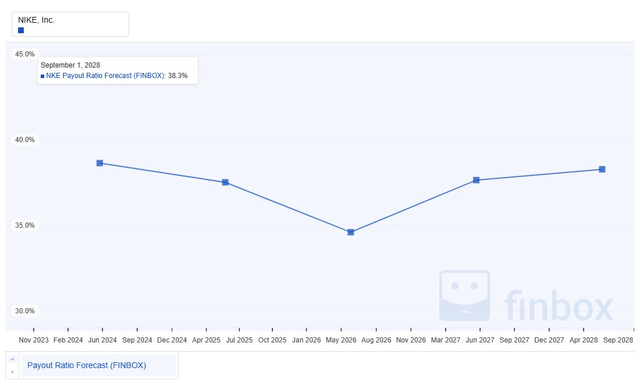
Based on this forecast, and what we’ve seen already as far as earnings growth and projected dividends, the earnings payout ratio is also forecast to be healthy for the near future. It appears that Nike will be able to sustain strong future dividend growth, without significantly increasing the earnings-based payout ratio.
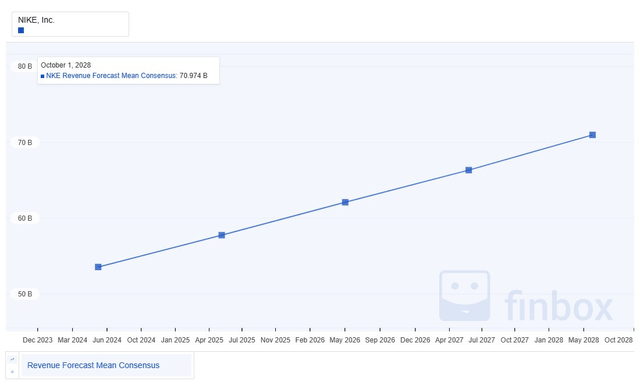
The projected growth in expected revenue is tied up in the above data, however, just to show it explicitly, the revenue growth projections for Nike are very admirable, and again, if accurate, suggest a very sustainable, growing dividend with likely capital appreciation to boot.
Nike Risk
Nike is a high-quality, solid, conservative company, which is one of the best in its class. The S&P credit rating of AA-, Moody’s credit rating of A1, and A++ Value Line Financial Strength rating all attest to the quality of this company.
As pointed out in my previous article on Nike here in more depth, the key risks with Nike are consumer sentiment, significant emerging and existing competitive pressure, political risks with some of the stances the company has taken, geopolitical risk due to the sources of a significant amount of its supply as well as end market geographies, and from an investment perspective, the risk that the long history of excellent growth is coming to an end. Nike may also be caught up in some of the broader market worries that higher interest rates are going to dampen growth. I do not believe this given the low net debt, and significant financial resources the company possesses, but this could be playing to the favor of investors that can see through this and embrace the long term.
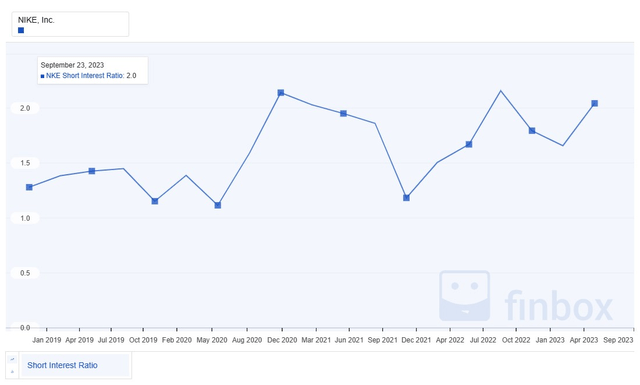
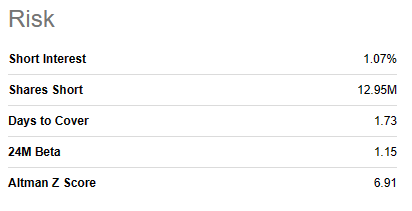
As a final check of risk, I like to look at short-term risk indicators for any new investments, with Short Interest being one key indicator for me that I might be missing something that others might know.
Based on the low short interest, I don’t see any short-term red flags.
Summary
From my perspective, I believe that Nike is temporarily out of favor, or that it is being dragged down by broader concerns with growth investments at large. I believe the growth story is still intact that it appears to be attractively valued at this point. I don’t usually like to buy right before earnings, so we will see how things go when earnings are updated. In any case, I have recently added to my position and believe this is an excellent long-term investment at these valuations, with the added benefit of strong, sustainable dividend growth.
As part of this analysis, we have also determined that ResMed, MarketAxess, NextEra Energy, QUALCOMM, Pfizer, Bristol-Myers Squibb, and Elevance Health are attractively valued from a Historical and Future Fair Value perspective. I own all of these stocks and have recently been adding to my positions in them as well. If you are interested in further analysis, I would encourage a review of my recent articles on ELV here, and BMY here, that I believe are still very relevant for further investigation.
Analyst’s Disclosure: I/we have a beneficial long position in the shares of MMM, BMY, ELV, LMT, MKTX, NEE, NKE, PFE, QCOM, RMD, UPS either through stock ownership, options, or other derivatives. I wrote this article myself, and it expresses my own opinions. I am not receiving compensation for it (other than from Seeking Alpha). I have no business relationship with any company whose stock is mentioned in this article.
Seeking Alpha’s Disclosure: Past performance is no guarantee of future results. No recommendation or advice is being given as to whether any investment is suitable for a particular investor. Any views or opinions expressed above may not reflect those of Seeking Alpha as a whole. Seeking Alpha is not a licensed securities dealer, broker or US investment adviser or investment bank. Our analysts are third party authors that include both professional investors and individual investors who may not be licensed or certified by any institute or regulatory body.

