Summary:
- Pfizer yields 5.57% with a B- dividend safety rating, known for Eliquis and Xeljanz.
- Technical analysis tools show bullish trends: trading above 30-week EMA, increasing momentum, and improving relative strength.
- Smart money buying, volume spikes, and breakout from consolidation suggest bullish outlook for Pfizer stock.

georgeclerk
In this article, I will outline why I think the high yielding pharmaceutical giant Pfizer (NYSE:PFE) looks bullish. Pfizer, known for Eliquis and Xeljanz, yields 5.57% and has a dividend safety rating of B- according to Seeking Alpha. I will outline my investment thesis using technical analysis tools such as price action, volume, momentum, and relative strength. I last wrote about PFE being bullish back in April 2021. Pfizer has since risen and then sold off considerably, so now I will take a fresh look at Pfizer.
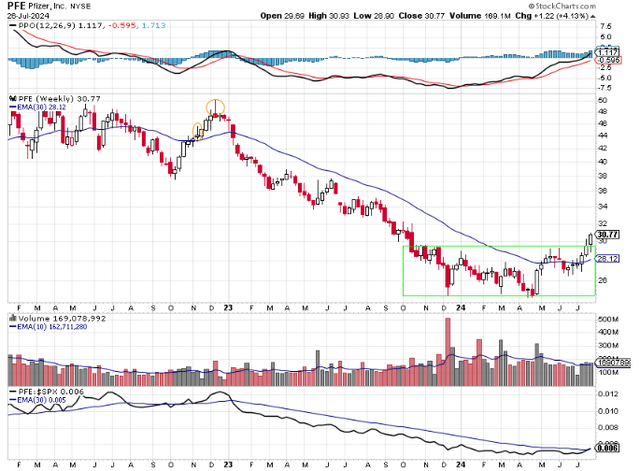
Chart 1 – Pfizer Weekly w/ Momentum, Volume, and Relative Strength

www.stockcharts.com
When analyzing a stock, I often start with looking at price action on a weekly basis using a 30-week exponential moving average (EMA). Using weekly price data helps smooth out the day-to-day noise, and using a 30-week EMA gives me an intermediate to long-term viewpoint of the trend. My goal is to buy a stock that is trending higher. In short, I want to buy a stock that is trading above its upward sloping 30-week EMA. I would sell the stock or short the stock when it trades below its downward sloping 30-week EMA. This simple strategy keeps me out of trouble. Looking at Chart 1, you can see that for almost all of 2023 and for most of 2024 so far, PFE traded below its downward sloping 30-week EMA. Since PFE traded below its downward sloping 30-week EMA, I had no interest in buying shares during that time. Using the 30-week EMA as a buy or sell indicator doesn’t work all the time. I don’t know of any strategy that works all the time. Using the 30-week EMA as a buy or sell indicator guarantees that I won’t buy at the lowest low or sell at the highest high. What 30-week EMA does do is it allows me to stay in a bullish trending stock. Or stay out of a bearish trending stock.
Looking at Chart 1, I like what I see regarding the price action of PFE. It is trading above its 30-week EMA. That is bullish. The 30-week EMA is now trending higher after seven or eight weeks of being flat. That is bullish. Lastly, PFE has broken above the range of consolidation that is outlined by the green box. The green box has about 10 months of PFE trading in a range or sideways. Now it looks like PFE is ready to trend higher away from the area of consolidation.
These consolidation periods, especially after a large decline in price, are also known as areas of accumulation because smart money or institutional buying takes place. Smart money buying is only done because the smart money believes that the shares are undervalued, and they expect the shares to rise in price. Looking at the volume pane in Chart 1, you can see the spikes in volume inside the green box. These volume spikes are the footprints of smart money. They are bullish. They have the financial muscle to buy millions of dollars’ worth of shares. Retail traders such as I don’t cause volume spikes. Another bullish sign is that in recent weeks, volume has increased as PFE has moved above the area of accumulation. The volume picture looks bullish to me.
I like to buy shares of stock that are showing strong momentum. The Percentage Price Oscillator (PPO) is my preferred indicator to measure momentum. PPO is easy to understand. It defines momentum in two different ways. When the black PPO line is above the red signal line, that means that there is short term bullish momentum in the stock. That is the condition PFE is in now. When the black PPO line is below the red signal line, then that is an indication of short term bearish momentum. When the black PPO line is above zero or the centerline of the chart, that is an indication of long term bullish momentum. With the black PPO line reading 1.117 that means we have long term bullish momentum. If the black PPO line is below zero, then there is long term bearish momentum. I say long term because you can see that the black PPO line doesn’t often oscillate above and below zero. It normally stays above or below zero for months at a time. Notice the black PPO line during the price decline in 2023 and most of 2024. The black PPO line was saying that long-term momentum was bearish. It pays to pay attention to long-term momentum. I see momentum as bullish.
The last factor I use when deciding to buy a stock is relative strength. I want to own stocks that are outperforming the SP 500 index. That is the only way I can beat the SP 500 index. The relative strength line shown in the bottom pane of Chart 1 is easy to read. The black line is a ratio of the price of PFE to the price of the SP 500 index. When the black line is rising, then PFE is outperforming the SP 500 index. When the black line is falling, then PFE is underperforming the SP 500 index. You can see that PFE lagged the market during the 2023 to 2024 price decline. Now the situation seems to be improving. The relative strength line is trending higher and is above its 30-week EMA. I see relative strength as bullish.
As I mentioned earlier, my analysis doesn’t work all the time. For any number of reasons, I could be wrong in my analysis. There could be a recall with one of Pfizer’s vaccines. Earnings and guidance could come in light. There could be an interest rate surprise that spooks the market. Any number of things could happen. That is why I always use a stop loss. To me, it’s better to take a small loss on a trade and then move on, than it is to suffer a large loss such as the one that took place in 2023 to 2024. Large losses are tough to recover from, in my experience. Looking at Chart 1, there are two levels where it makes sense to have a stop loss. The first level is below the recent price advance at $26. A stop loss technique that I use often is simply a weekly close below the 30-week EMA. You could even combine the two if you take a position at this level. Sell part of your position if PFE closes below its 30-week EMA. Sell the remaining shares if PFE closes below the $26 level. If you are compelled to buy PFE, keep in mind that PFE has been up for six consecutive weeks. You may have the opportunity to buy some shares during a natural pullback after six strong weeks of performance.
In summary, PFE is a high yielding stock that looks bullish to me. It now trades above its 30-week EMA, its 30-week EMA is trending higher, and PFE recently broke above an area of accumulation. Volume looks bullish as smart money has recently been purchasing shares. Momentum is both short-term and long-term bullish. Relative strength is now improving. If you decide to buy some shares in PFE, consider using a stop loss in case my analysis proves incorrect.
Analyst’s Disclosure: I/we have a beneficial long position in the shares of PFE either through stock ownership, options, or other derivatives. I wrote this article myself, and it expresses my own opinions. I am not receiving compensation for it (other than from Seeking Alpha). I have no business relationship with any company whose stock is mentioned in this article.
Seeking Alpha’s Disclosure: Past performance is no guarantee of future results. No recommendation or advice is being given as to whether any investment is suitable for a particular investor. Any views or opinions expressed above may not reflect those of Seeking Alpha as a whole. Seeking Alpha is not a licensed securities dealer, broker or US investment adviser or investment bank. Our analysts are third party authors that include both professional investors and individual investors who may not be licensed or certified by any institute or regulatory body.
