Summary:
- The Home Depot reported strong Q3 2024 results, with adjusted earnings per share and sales exceeding expectations. However, the 6.6% sales growth shouldn’t be overinterpreted.
- Company-wide comparable sales declined by 1.3%, a significant improvement against the backdrop of a continued challenging environment and inflationary pressures on consumers.
- Operating profitability weakened as expected, but there are signs of stabilization. FCF for the first nine months was comparatively weak, but this is largely due to a difficult comparison.
- At 27 times earnings and a sub-4% FCF yield, HD stock is expensive, but I don’t consider it a sell given the strong execution and enormous economies of scale.
JHVEPhoto/iStock Editorial via Getty Images
Introduction
The world’s largest home improvement retailer from a net sales perspective – The Home Depot, Inc. (NYSE:HD) – reported its third quarter fiscal 2024 results today. I last covered HD stock back in May, discussing the retailer’s performance in fiscal 2023, but importantly also the acquisition of SRS Distribution for more than $18 billion.
Against this backdrop, and considering the somewhat unexpectedly solid returns of HD stock since my bullish article in November 2023, I think it’s a good time to reassess. After all, the challenges explained in an article on Home Depot and its main competitor, Lowe’s Companies, Inc. (LOW) in May 2023 are still relevant today.
The Home Depot Q3 FY2024 Earnings Analysis
For the recently concluded quarter, Home Depot reported adjusted earnings per share (EPS) of $3.78 and sales of $40.2 billion, beating the latest estimates by 3.3% and 2.5%, respectively. Judging from HD’s track record, this double beat is no surprise. While the 6.6% increase in net sales compared to the third quarter of fiscal 2023 looks extremely positive, investors need to realize that this is due to the acquisition of SRS Distribution, which was completed on June 18, 2024.
Critical investors could argue further that surprising positively on an adjusted EPS estimate isn’t particularly difficult, but I think it’s worth highlighting that GAAP EPS was only 2.9% lower than adjusted EPS and that the only adjustment made in Q3 (and also year to date) was related to amortization of acquired intangible assets. In my view, such adjustments are totally acceptable, and I shared my reasons – although obviously not directly comparable – in an article discussing Johnson & Johnson’s (JNJ) earnings quality.
The most important performance indicator for The Home Depot, however, remains comparable sales, which were down 1.2% year-over-year in the U.S. On a company-wide level, comparable sales declined 1.3%, but keep in mind that sales outside the U.S. only represent approximately 8% of consolidated sales.
In my view, a decline in comparable sales by 1% isn’t exactly a bad result, particularly considering felt inflation among consumers and the clear trend in recent quarters that bigger-ticket purchases are being postponed. This is an effect that’s to be expected – despite HD’s partly non-cyclical characteristics. In fact, considering the still challenging environment, I, personally, view the 1.2% decline as very favorable, and as illustrated in Figure 1, the number didn’t benefit from a favorable comparison.
Figure 1: The Home Depot, Inc. (HD): Year-over-year change in quarterly comparable sales (own work, based on information from company filings)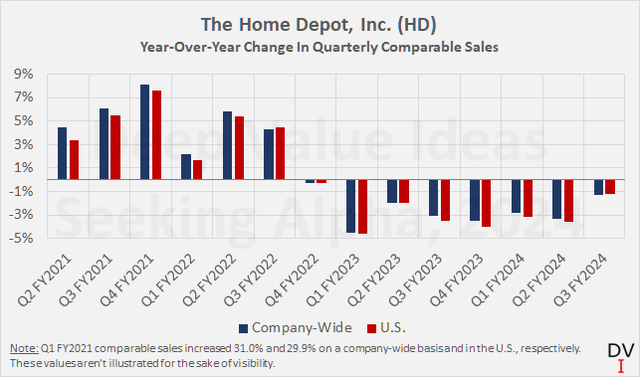
While I think it’s fair to conclude that consumer sentiment is showing feeble signs of improvement, it will be interesting to see what competitor Lowe’s is going to report next Tuesday. In this context, HD’s basically flat number of transactions in Q3 (399.0 million) and a decline in average ticket size by just 0.8% year-over-year, to $88.65, also deserve mention, same as the increase in total sales guidance to 4% from 2.5% to 3.5% back in August and the improved comparable sales outlook of -2.5% vs. -3% to -4% previously. Hence, and considering we are already two weeks into Q4 of fiscal 2024, it looks like the second half of the year is performing better than management originally anticipated.
At the same time, a one-time boost in sales stemming from Hurricane Helene certainly benefitted the comparison. However, judging from the insignificant impact on Truist Financial Corporation’s (TFC) related loan loss provisions – a bank I covered in October which has exposure in the area – I think it would be unfair to take the fact that management has not mentioned an estimate of the impact as a sign that they are trying to paper over otherwise weaker than expected growth.
Profitability-wise, HD reported a 70 bps decline in adjusted operating margin year-over-year for Q3 2024 to 13.8%, or by 80 bps on a GAAP basis, to 13.5%. Judging from Figure 2, which illustrates the expected seasonal pattern of HD’s profitability, a difficult comparison can be ruled out as an explanation for the weakness.
Figure 2: The Home Depot, Inc. (HD): Quarterly operating profitability on a GAAP basis, including an estimate for Q4 FY2024 (own work, based on information from company filings)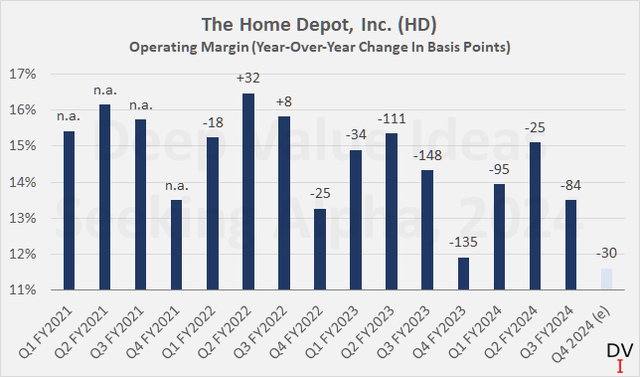
The company now expects GAAP operating profitability near the low end of the already narrow guidance range of 13.5% to 13.6% noted in Q2. Likewise, adjusted operating profitability is now expected to average 13.8% in fiscal 2024 vs. a range of 13.8% to 13.9% previously. This implies that operating profitability will likely be around 11.6% in Q4 fiscal 2024 (light blue bar in Figure 2 above), confirming the ongoing margin pressure. At the same time, I believe it is unlikely that operating profitability will fall much further, of course barring significant external events and a resurgence in inflation. HD continues to execute very well, benefits from enormous economies of scale and has a highly efficient supply chain and distribution footprint.
Operating cash flow and thus cash flow profitability were also lower than in the previous year when looking at the nine-month period. Free cash flow also declined, but capital expenditures for the current year remained essentially unchanged at $2.4 billion. Adjusted for stock-based compensation, HD generated 10% lower free cash flow than in the first nine months of fiscal 2023, or around $12.4 billion. While lower operating profitability likely also played a role in this decline, investors should be aware that the nine-month period ended October 29, 2023, benefited from a $1.4 billion working capital-related tailwind.
Therefore, I think it is only fair to conclude that HD continues to be highly cash-generative, which makes the dividend appear very safe (current payout ratio of 50% of free cash flow). Share repurchases have been muted so far at only $649 million year-to-date, but in light of rather aggressive share buybacks in previous years and pronounced debt – as discussed in my previous articles – this is a welcome sign of financial prudence, also in light of the $18 billion takeover of SRS Distribution earlier this year.
Year-over-year, net debt is up 33%, to $53 billion and excluding operating leases of $6.4 billion. Adding operating leases, adjusted net debt would have increased by 34%, to $61.8 billion. This sounds like a lot – and it certainly is – but keep in mind The Home Depot has very strong cash conversion and typically generates between $12 billion and $18 billion in annual free cash flow, after having adjusted for stock-based compensation and working capital movements. In this context, it’s also worth highlighting that Home Depot continues to benefit from a significantly stronger credit rating than peer Lowe’s. While the latter has a Moody’s rating of Baa1 (last affirmed in July 2023), Home Depot has a rating of A2, so two notches higher, and the rating agency also affirmed HD’s rating despite the bold acquisition of SRS Distribution.
Conclusion: Why HD Stock Isn’t A Contrarian Sell After Solid Q3 Earnings
Home improvement giant The Home Depot, Inc. reported strong third quarter fiscal 2024 results in what continues to be a challenging environment. Both adjusted earnings per share and sales were ahead of expectations, and the 7% year-over-year sales increase in particular seemed to be a big positive surprise. However, this apparent improvement is due to the consolidation of SRS Distribution.
Aside from that, Home Depot also reported pretty solid numbers on a comparable basis, with comparable sales down just 1.3% company-wide and 1.2% in the U.S. – which accounts for more than 90% of total net sales. This is a significant improvement on previous quarters and a benefit due to an easy comparison that can be ruled out. That being said, the positive impact of sales related to Hurricane Helene certainly helped the comparison, but given the low loan loss reserves at a large regional bank with exposure in the area, I don’t believe this one-time benefit to HD was significant. After all, unlike Truist’s banking operations, Home Depot’s operations are very broadly spread across the U.S.
Operating profitability has weakened further, but I would say in line with expectations. The profitability guidance (which was lowered very slightly) implies a GAAP operating margin of about 11.6% for Q4. That sounds very weak, but is actually completely acceptable given the seasonality of HD’s business. The expected year-over-year decline of only 30 basis points confirms continued stabilization.
Year-to-date operating and free cash flow were around 10% lower than in the same period last year, but still strong as a margin of 10.4% shows, and it is important to remember that the first nine months of fiscal 2023 benefited from a $1.4 billion tailwind in terms of working capital. Adjusted for this effect, cash flow profitability remained virtually unchanged compared to the previous year. Given the continued strong business performance and reliable cash flows, I do not consider the current elevated net debt of $53 billion to be overly concerning. The suspension of share buybacks is nevertheless a prudent decision and is also welcomed because HD spent $18 billion on the acquisition of SRS Distribution not so long ago.
Taken together, Home Depot continues to be an investment I can sleep very well with, despite a continued difficult environment and a possible resurgence of inflation. However, at a current price of $410 per share, which equates to a price-to-earnings ratio of 27, I will not be adding to my position. Similarly, with a free cash flow yield of about 3.7%, which implies a perpetual growth rate of more than 3% at a discount rate of 7.0% (Figure 3), I would not call HD stock a value investment.
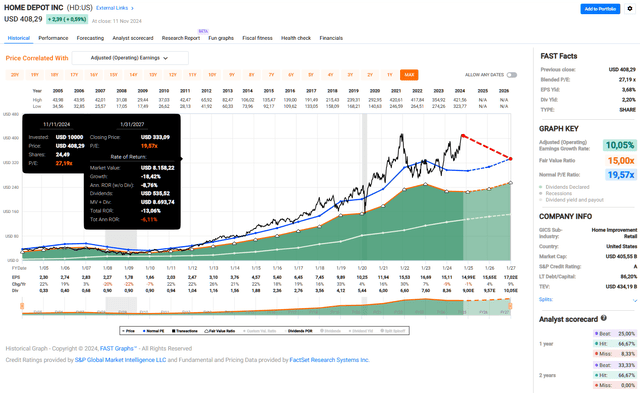
That said, I, personally, believe that despite the negative expected returns according to Figure 4, HD shares aren’t a sell even at current levels. As the largest home improvement chain in the U.S., which continues to perform strongly, benefits from enormous economies of scale and has a highly efficient supply chain and distribution network, I believe a premium is entirely justified.
Figure 3: The Home Depot, Inc. (HD): Discounted cash flow sensitivity analysis (own work, based on information from company filings and own calculations) Figure 4: The Home Depot, Inc. (HD): FAST Graphs chart, based on adjusted earnings per share (FAST Graphs)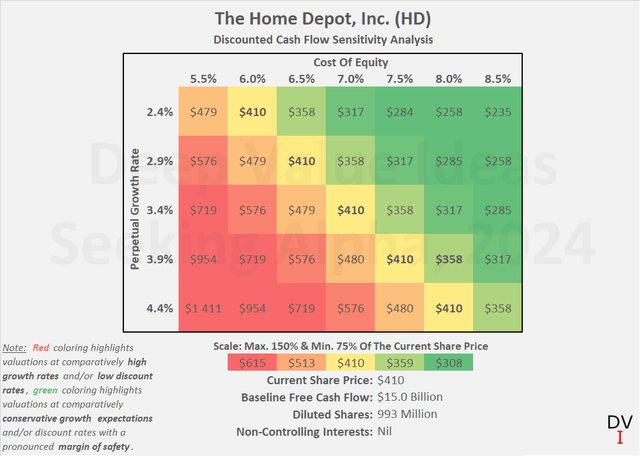
Thank you very much for reading my latest article. Whether you agree or disagree with my conclusions, I always welcome your opinion and feedback in the comments below. And if there’s anything I should improve or expand on in future articles, drop me a line as well. As always, please consider this article only as a first step in your own due diligence.
Analyst’s Disclosure: I/we have a beneficial long position in the shares of HD, LOW, JNJ, TFC either through stock ownership, options, or other derivatives. I wrote this article myself, and it expresses my own opinions. I am not receiving compensation for it (other than from Seeking Alpha). I have no business relationship with any company whose stock is mentioned in this article.
The contents of this article, my previous articles, and my comments are for informational purposes only and may not be considered investment and/or tax advice. I am a private investor from Europe and share my investing journey here on Seeking Alpha. I am neither a licensed investment advisor nor a licensed tax advisor. Furthermore, I am not an expert on taxes and related laws – neither in relation to the U.S. nor other geographies/jurisdictions. It is not my intention to give financial and/or tax advice, and I am in no way qualified to do so. Although I do my best to make sure that what I write is accurate and well researched, I cannot be held responsible and accept no liability whatsoever for any errors, omissions, or for consequences resulting from the enclosed information. The writing reflects my personal opinion at the time of writing. If you intend to invest in the stocks or other investment vehicles mentioned in this article – or in any investment vehicle generally – please consult your licensed investment advisor. If uncertain about tax-related implications, please consult your licensed tax advisor.
Seeking Alpha’s Disclosure: Past performance is no guarantee of future results. No recommendation or advice is being given as to whether any investment is suitable for a particular investor. Any views or opinions expressed above may not reflect those of Seeking Alpha as a whole. Seeking Alpha is not a licensed securities dealer, broker or US investment adviser or investment bank. Our analysts are third party authors that include both professional investors and individual investors who may not be licensed or certified by any institute or regulatory body.
