Summary:
- Home Depot has maintained stable revenues and grown cash flows despite market fluctuations and atypical inflation.
- The company’s strong financial results are accompanied by a commitment to share buybacks.
- The recent technical breakout and new multi-year highs lead us to believe that all-time highs are in play.
- We anticipate $400 per share or more in coming quarters based on an improving technical picture and an attractive multiple.
- We reiterate our “Strong Buy” rating.
Justin Sullivan/Getty Images News
Almost two years ago, we published a bullish article on Home Depot (NYSE:HD) titled: “Home Depot: Use The Dip To Climb Aboard This Long-Term Wealth Compounder“, where we covered the company in depth.
In the piece, we analyzed the company’s consistent long-term top- and bottom-line growth profile, leading market position, and share buyback program to establish that the firm was – in our minds – a ‘compounder’, a company able of compounding an investment’s value at a higher-than-average rate over a long period of time.
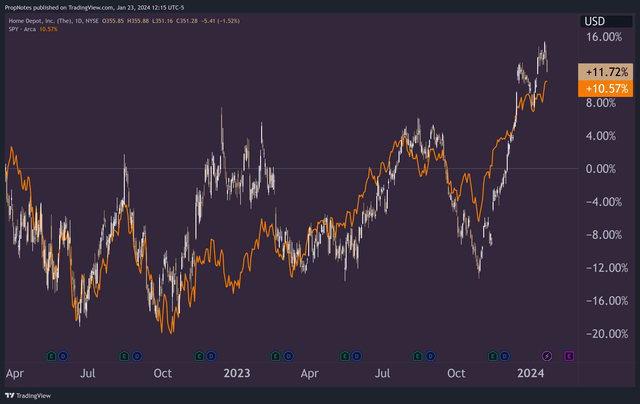
Since then, the company has outperformed the market (if only slightly), with a total return of 11.7% vs. the S&P’s 10.5%:
However, functionally nothing has changed about Home Depot – in a good way.
The company has kept revenues stable while growing cash flows, as it continues to ingest the market fluctuations brought about by the pandemic and a higher-than-average level of inflation.
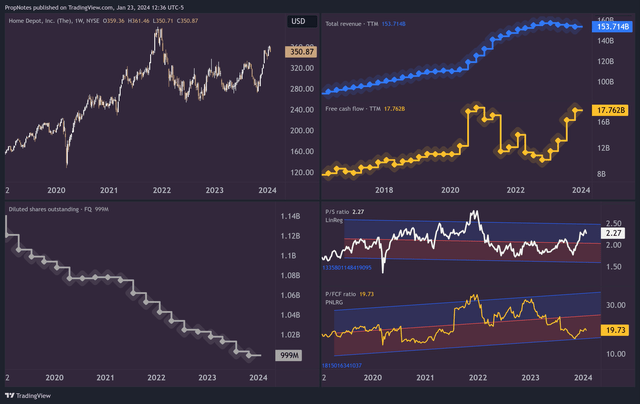
On the supply side, management has continued to buy back shares of the company, reducing share count to under 1 billion diluted outstanding for the first time in living memory.
Additionally, the company still looks attractively valued on a number of profitability metrics, like Price to FCF.
With a fresh technical breakout on the chart, today we thought it would be a good time to look at the company from another angle and analyze whether or not the recent price action should augment the bullish thesis.
Is Home Depot as strong of a buy as it was in early 2022?
Here’s a quick spoiler alert; in our opinion, absolutely.
Let’s dive in and explain why.
Financial Results
As we just mentioned, Home Depot appears to be a compounder-class company. Growth in profits has continued unabated despite the challenging inflationary environment experienced over the following two years, and management has kept revenue stable, even following the complexities of the ~40% spike in growth that was a result of Covid.
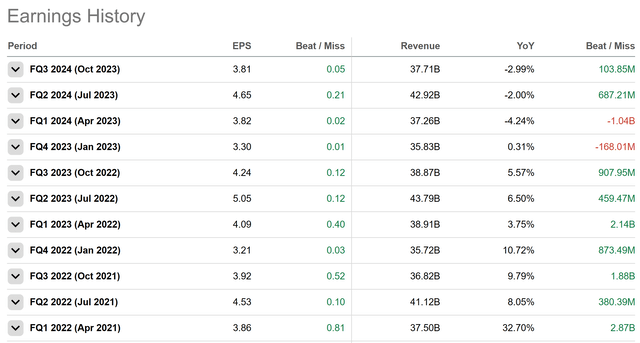
On the earnings front, the company has also piled up beat after beat:
This has mirrored growth in HD’s TTM FCF, which is now back at all-time highs around ~8 billion, following a confusing period for all of retail:
These strong financial results are accompanied by a strong level of commitment to share buybacks, which continue unchecked.
Finally, the company trades at an interesting looking 19.7x FCF, which appears historically attractive for investors, as it’s trading below the long-term linear regression and is in the lower standard deviation band. You can see this on the bottom right in the image above.
But what about the technical situation? Does it add to the “Long” thesis here?
The Technicals
We certainly think so.
Since our last article, HD has been trading sideways, which mirrors the general market action:
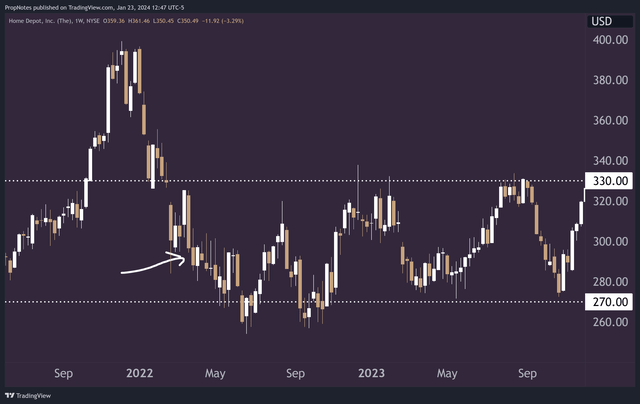
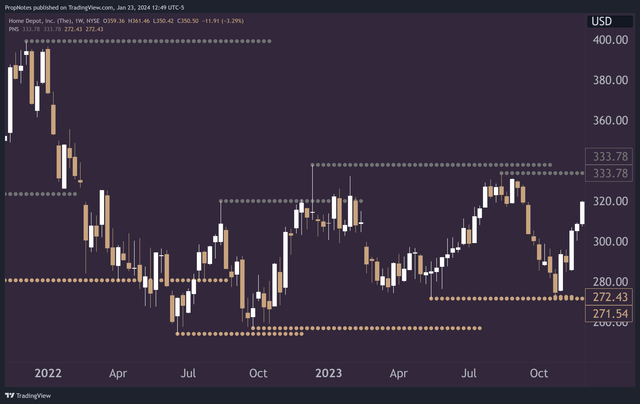
Prices have mostly stayed in between $270 and $330, as rangebound trading has prevailed.
This is especially pronounced when looking at pivot points throughout the last few years, which show a consistent pattern of highs and lows being formed around these levels:
Pivot points, if you don’t know, are important local highs and lows in a given market. These may not be all-time highs and lows, or even yearly highs and lows, but they represent important prices that define when certain sides of the market are likely to ‘throw in the towel’, as a lot of trading is done, and a lot of stop loss orders, are typically concentrated around these spots.
Some think these levels are only relevant to retail traders, but having worked at a number of professional trading firms, we can attest that these levels are relevant to basically all market participants.
Following a break in a level, it is common for that zone to become a support, as opposed to a resistance, or vice versa.
Here’s the situation now in Home Depot.
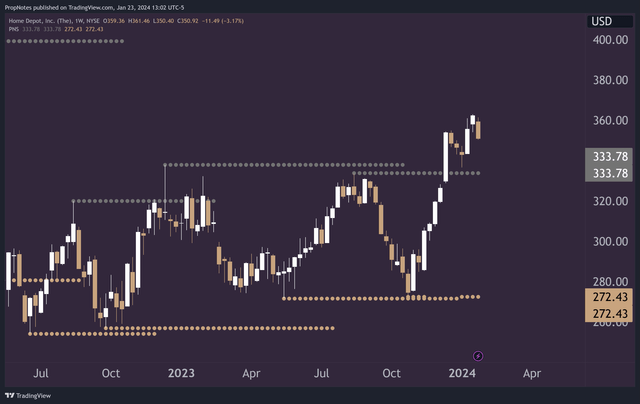
Recently, the stock broke out of this range, rallying up to $360:
This may look unimportant, but it represents a massive bullish change in the technical situation that should be only further exacerbated by the solid fundamentals we touched on.
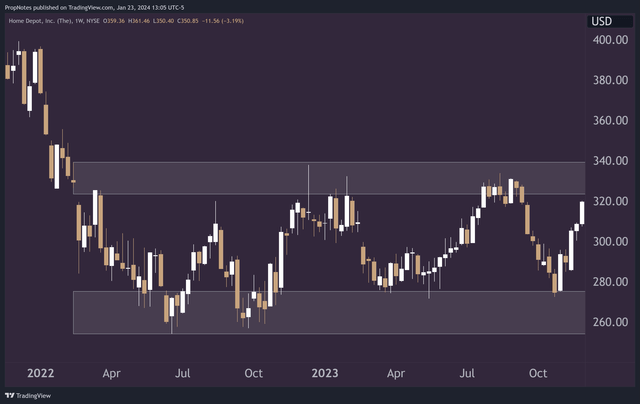
Let’s look at it from another angle. Here’s the zone that HD was trading in:
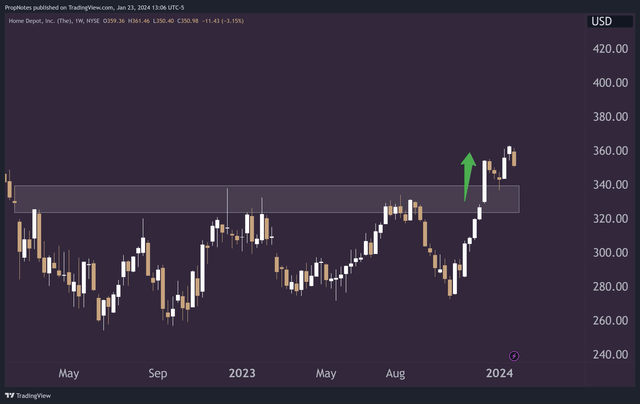
And here’s how HD has reacted, now that it’s broken above the ~330 resistance zone:
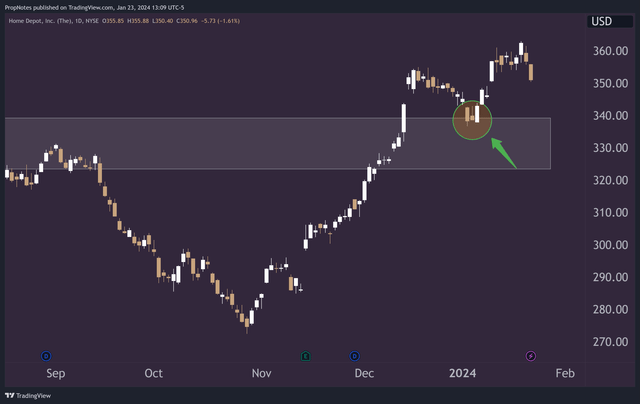
Critically, the stock came back down to the ~330 level following the breakout, and instead of getting sold off by investors, new buyers came into the name, pushing prices back up to new multi-year highs.
Check out this action here on the daily chart (zoomed in for clarity):
To us, the whole technical demeanor of the stock is now changed following this breakout & successful retest.
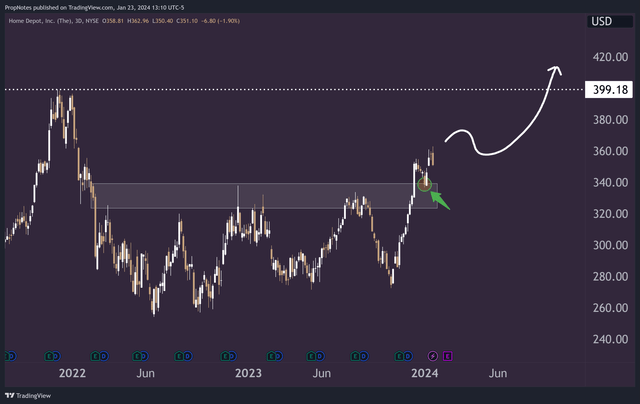
Save some market catastrophe, the path now appears clear for the stock to challenge new highs near $400 per share:
When combined with the solid underlying fundamentals and attractive FCF multiple, we expect that HD could march back to highs around $400 per share and above over the coming months.
If the market continues its bullish tone, then we expect this could happen sooner, rather than later.
Risks
While the breakout is certainly a sign for celebration for Home Depot investors, there are some risks associated with HD’s current technical picture.
First off, the company could see a reversal in fortunes over the coming weeks and months if prices turn around. It’s important to remember that price action charting is not perfectly prescriptive, and things can happen to muddy the waters. Just because the stock currently has some momentum doesn’t mean that it can’t dry up as quickly as it has materialized. We realize this makes it sound like technical analysis is useless – it’s not. That said, it doesn’t always ‘work’. We think that in conjunction with the fundamentals, this breakout should be well ‘trusted’.
Additionally, if the market’s technical situation worsens, then it’s unlikely that HD will see material, technical outperformance simply as a result of this breakout. While individual charts are powerful indicators of supply and demand for investors in a stock, the market’s overall direction can overpower most stocks’ direction on most days, and thus, that should be carefully monitored as well.
Finally, earnings are in 28 days, which is key. The recent breakout into the release represents considerable exuberance on behalf of traders, but materially bad numbers, or a poor reaction to good numbers, could spell disaster and re-orient the technical situation. If earnings are a bust, then it could invalidate the price structures we’ve mentioned, and the stock could trade down to range lows near $270.
Summary
When combined with the recent breakout dynamics we’ve discussed here, we expect that HD’s solid fundamental situation and relatively attractive FCF multiple could lead the stock moving higher in coming quarters. While there are some risks to be aware of from a technical perspective, we believe that HD represents a solid investment decision at the present moment.
Thus, we re-iterate our “Strong Buy” rating.
Stay safe out there!
Analyst’s Disclosure: I/we have a beneficial long position in the shares of HD either through stock ownership, options, or other derivatives. I wrote this article myself, and it expresses my own opinions. I am not receiving compensation for it (other than from Seeking Alpha). I have no business relationship with any company whose stock is mentioned in this article.
Seeking Alpha’s Disclosure: Past performance is no guarantee of future results. No recommendation or advice is being given as to whether any investment is suitable for a particular investor. Any views or opinions expressed above may not reflect those of Seeking Alpha as a whole. Seeking Alpha is not a licensed securities dealer, broker or US investment adviser or investment bank. Our analysts are third party authors that include both professional investors and individual investors who may not be licensed or certified by any institute or regulatory body.

