Summary:
- Home Depot’s stock is favored for its consistency, quality, and size, fitting well in the current market environment despite modest dividend yields.
- The company benefits from long-term home improvement trends, driven by demographic factors and the need for home upgrades, supporting its revenue growth.
- HD’s strong profitability and manageable valuation make it a solid long-term investment, even if it underperforms the broader market in the short term.
- I maintain a 5% portfolio position in HD, focusing on dividend yield and price appreciation, and assign a buy rating based on its high-quality profile.
Oleg Kovtun
Things are really heating up. Not at Home Depot (NYSE:HD) because its stock story is one of consistency and not dramatics. That’s one reason why, despite its dividend yield sitting toward the bottom of my acceptable range, I’ve owned it since just before Memorial Day in my stock portfolio, which I run based on the Yield At a Reasonable Price (YARP™) dividend stock analysis approach I created a while back.
HD fits in so well in the current environment because of what the stock market favors beyond the Magnificent 7 names. Size matters, as mega caps like this Dow Industrials component are so much more in favor than small caps. That is despite a widening gap in valuations which, in past markets, would have sent investors running to smaller companies the way folks run to Home Depot stores on a Saturday.
But the market also favors quality, as it searches for stocks to own outside of the tech giants. HD is not terribly cheap, and it does not look to me like a giant price mover in the next 12 months. But I don’t need that or look for it.
Instead, I look for companies I can own long-term, but tactically manage the positions to garner as much dividend yield as I can on each quarterly ex-dividend date, and capture the price appreciation on top of that. But I’m a risk manager first, so I am unwilling to hold a stock at a higher weighting in the portfolio (5% is my maximum at cost) if its chart pattern looks dangerous, or even weak. More on my journey with the stock below.
Home Depot: high-level view
The world’s largest home improvement retailer is familiar to US consumers, with sales of more than $150 billion. Over the decades, the company has adeptly managed its growth to the point where its average store size now tops 100,000 enclosed square feet. And that doesn’t even include another 20% of the typical store that is the outdoor garden department.
But while an iconic brand and a history that essentially has taken the mom-and-pop store in its field out of business, this is a consumer-driven business. Whether the consumer is the end buyer at HD or whether a contractor is doing the purchasing for them, the recent period of higher interest rates and inflation naturally impact a stock like this.
Argus Research reports that 75% of U.S. homeowners with mortgages are locked in below 4.5%. So while the Covid era was “stay at home” for one reason, we are likely now in a period of “keep your home.” That translates to home improvements, and plays into HD’s hands quite nicely.
Perhaps the biggest long-term hurdle is demographically based, as 70% of US homes are more than 25 years old and upgrades are vital. And we still have yet to meet the demands for homeownership that were suppressed back in the global financial crisis 15 years ago. This all adds up to HD being a strong secular position as a new generation of buyer emerges, and rates gradually move lower. The company has said that this process could fuel its revenue for the next 5 years. This is a company that always finds a way to compete well, and its size and financial strength show up in its strong Seeking Alpha profitability grade, which is the one I focus in on in my process of selecting stocks for at least a token 1% position in my portfolio.
Charting Home Depot
Now, let’s take a look at HD visually, across fundamental, quantitative and my bread-and-butter investment genre, technical/price trend analysis. First, here’s a chart of 12-month rolling returns for the stock, but the key part is below. There, I’ve plotted the 1-year rolling return of HD versus the S&P 500. Remember that in recent years, that index has trounced most individual stocks. It is very top-heavy. HD has thus had an extended period where underperforming the market has been the norm, even though it has put up some decent non-relative return numbers.
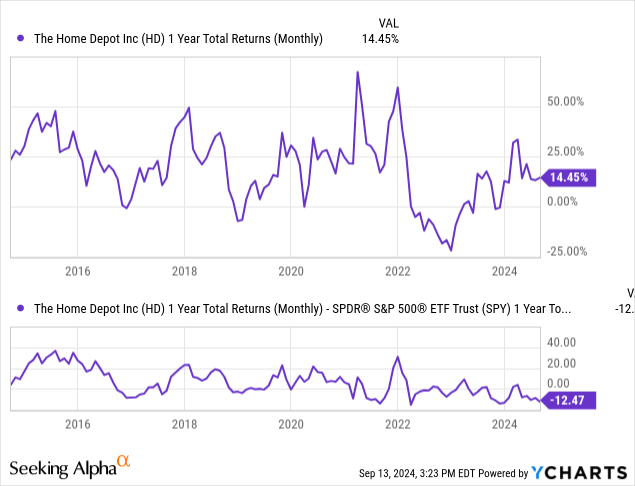
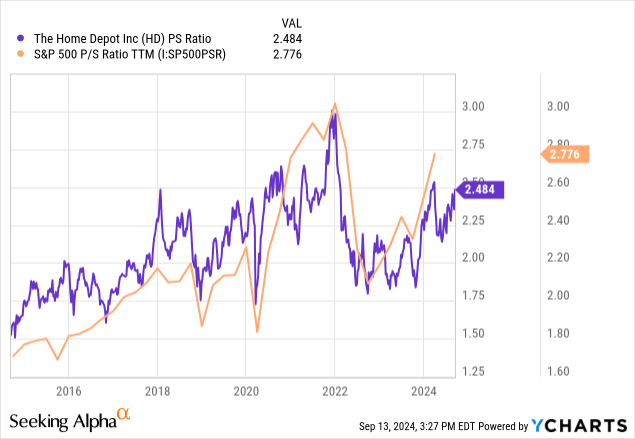
This is one of many things I look at to better understand why stocks show up favorably in my own, proprietary rating process. This lagging performance versus the broad market, combined with the gradual interest in moving outside the “usual suspects” that now dominate the S&P 500 index, tilts in the favor of non-technology, high profitability large cap stocks like this one. In other words, I don’t just screen and filter and buy. I do that, but then question every aspect of it. I think all investors should. As I noted above, HD is not excessively cheap and this chart of price to sales versus the S&P 500 indicates that. It currently sells at a modest discount, but it is rare to see HD at a huge P/S discount to the market.
My positioning…so far
HD made it in the door back in May, as shown below from my brokerage account snapshot. I bought a “starter” position (1% of portfolio) around $327 per share, and as I often do in treading lightly, the stock rallies firmly from there. It did, and I bought 2% more and then another 2% shortly after, both in August around the $375 area.
That allowed me to qualify for the maximum amount of dividend income I could expect (with a 5% max position I allow myself in one stock), since I had recently raised my position. That’s part of my YARP routine, based in large part on the technical trend, which I’ll discuss below.
Rob Isbitts (brokerage statement)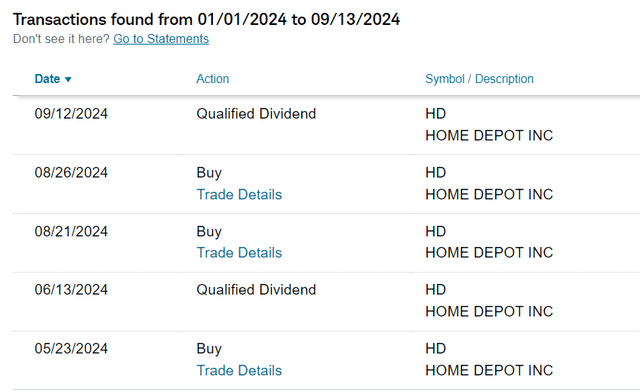
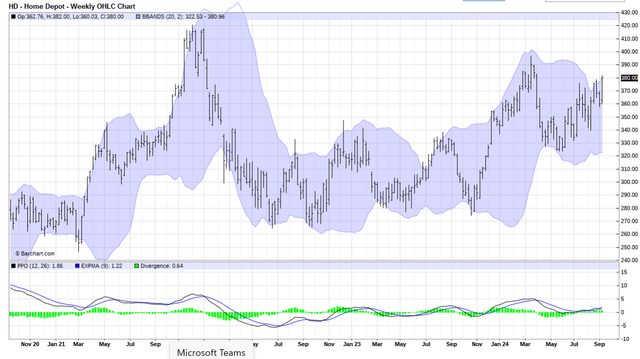
HD continues to be a 5% position for me, though I’ll note that all of these positions are flexible. But the price chart below, both daily and weekly, are encouraging to me. Steady series of higher highs, though with an all-time high point looming above. Overall, I like the looks of this one.
Seeking Alpha / Ycharts. Seeking Alpha/Ycharts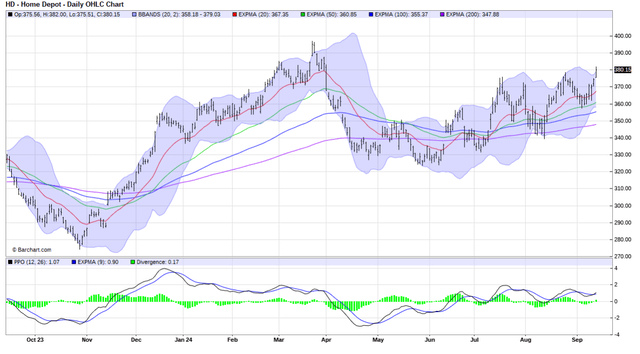
That profitability rating is rock-solid (A+) and that should remain in place. I’m not surprised the valuation rating is high, given my notes above, but again, as a tactical investor, that’s less of an issue to me.
Seeking Alpha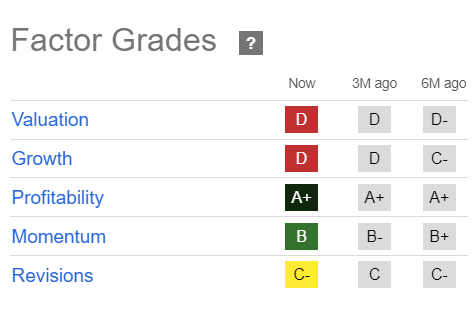
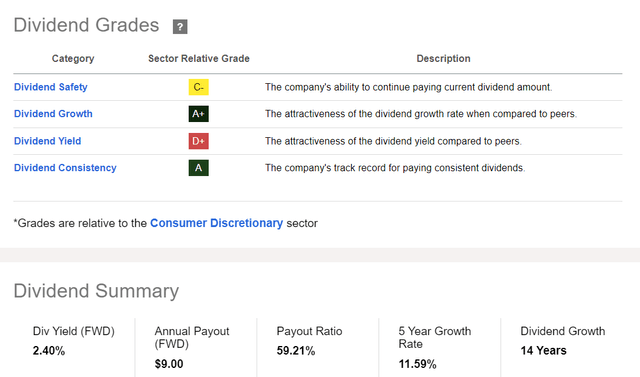
The dividend is solid, but not spectacular. That means I’ll need more price appreciation than I would require for a higher yielding holding.
Conclusion
Home Depot fits my high quality, yield at a reasonable price approach on a long-term basis. I expect to keep it in the portfolio for a while unless the yield gets so low, I feel it necessary to find another higher-yielding stock to replace it.
I’ll assign a buy rating here, given my current max 5% position.
Analyst’s Disclosure: I/we have no stock, option or similar derivative position in any of the companies mentioned, and no plans to initiate any such positions within the next 72 hours. I wrote this article myself, and it expresses my own opinions. I am not receiving compensation for it (other than from Seeking Alpha). I have no business relationship with any company whose stock is mentioned in this article.
Seeking Alpha’s Disclosure: Past performance is no guarantee of future results. No recommendation or advice is being given as to whether any investment is suitable for a particular investor. Any views or opinions expressed above may not reflect those of Seeking Alpha as a whole. Seeking Alpha is not a licensed securities dealer, broker or US investment adviser or investment bank. Our analysts are third party authors that include both professional investors and individual investors who may not be licensed or certified by any institute or regulatory body.
