Summary:
- The Home Depot, Inc.’s earnings drivers include the number of stores, comparable store sales growth, profit margin changes, and the number of shares outstanding.
- Shares outstanding have steadily declined, as the company used its strong free cash flow to buy back stock.
- Home Depot’s profit margin has increased over the years due to good management and its strong market position in the home improvement industry.
- Near record-low housing turnover is currently hurting Home Depot’s sales growth and profit margin.
- Despite Home Depot’s strengths, I don’t expect buying yet until the P/E ratio is lower and a recovery in home sales is clearer.
alvarez/E+ via Getty Images
Oops!
All investors have their regrets. I share one with many people – Amazon (AMZN). I bought some around the year 2000, but fairly quickly sold it. Another regret is The Home Depot, Inc. (NYSE:HD). Someone told me to buy it in about 2009. It was an interesting enough idea to me that I remember it to this day, but I did nothing. That $25 stock is now $340. Oops!
A few weeks ago, I was thinking about a new topic to write on in my area of expertise of housing and consumer finance. Home Depot popped into my head. So 15 years later, I took a deep dive into the Home Depot story. Here goes.
Home Depot’s earnings drivers
Four key factors drive Home Depot’s earnings:
- The number of stores
- Comparable store sales growth
- Profit margin changes
- The number of shares outstanding.
This table shows how each factor contributed to Home Depot’s EPS growth over the past 20 years:
Home Depot financial reports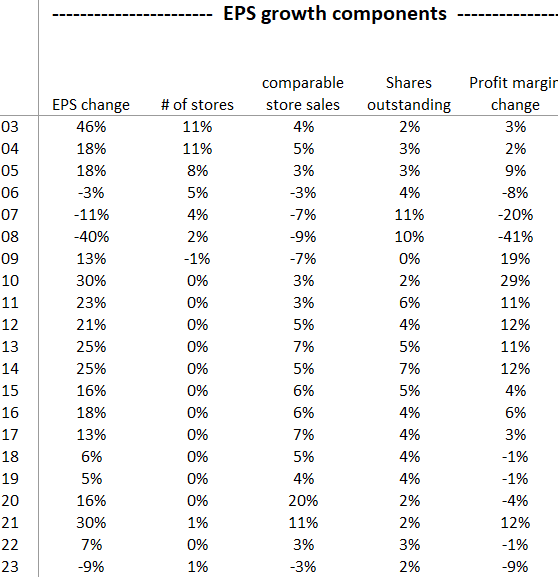
I’ll describe each EPS driver in some depth.
The number of stores
Home Depot opened its first store in 1978. I pick up its store story in 1989:
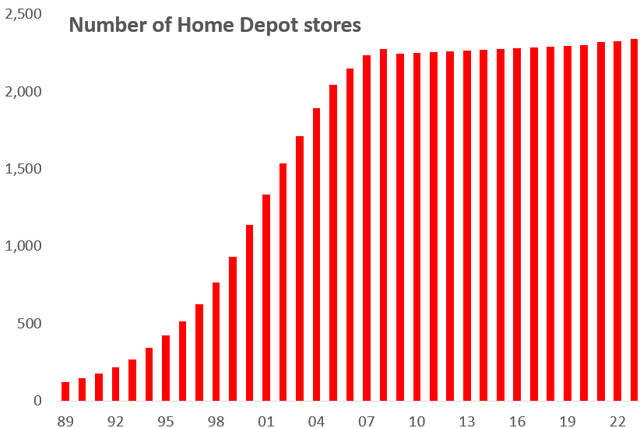
As you can see, the company rapidly grew its store network until 2007, and it has been stable since, presumably because it attained coverage of its key markets. Management has committed to adding 80 stores over the next five years, which will add a little less than 1% a year to Home Depot’s store network.
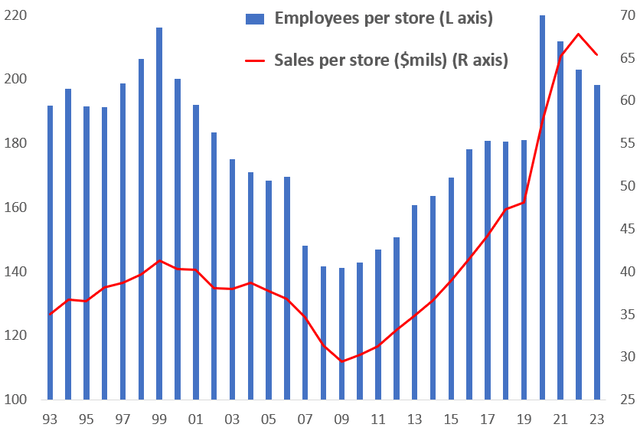
Note that the employees in those stores are a critical value-add in the hardware store business because of the service they provide to customers. The following chart makes that point abundantly clear. It compares the sales per store to the number of employees per store:
A great correlation. The management team during the early ‘00s tried an efficiency strategy, reducing costs by reducing store employees. Sales clearly suffered as a result. New management reversed that strategy, and sales rose again. The chart also shows that management got a bit over-excited by the surge in ’20 sales, and since has returned to a more normal store headcount.
Note that online retail is not a separate sales outlet for Home Depot. A significant portion of Home Depot’s customers value the input they receive from the company’s staff. And customers frequently order online but pick up at the store, or first visit a store and then later order online. Management is working hard to make this bricks-and-clicks integration more seamless.
Comparable store sales growth
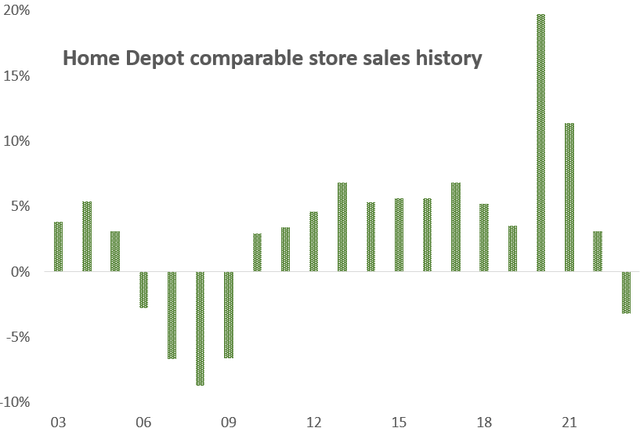
This measure compares sales volume versus a year ago, for stores open at least a year. Here is the 20-year history:
Three conclusions:
1. Comparable sales growth is cyclical, tied to housing/economic cycles.
2. COVID sparked a strong interest in consumers in housing, both purchases and home improvements, a factor that is in the process of stabilizing.
3. Median same-store sales growth was 4% over the past two decades, in line with overall consumer spending growth.
Profit margin changes
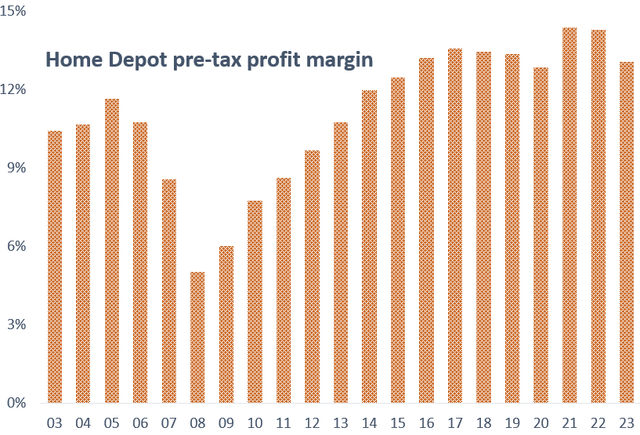
Here is the two-decade history of Home Depot’s pre-tax profit margin:
This chart shows that Home Depot’s profit margin at present is well above where it was 20 years ago, and even 10 years ago. Why? I believe there are two reasons:
1. Good management. I already showed you the benefits that Home Depot received by increasing its level of service. Another great sign is that while Home Depot has made many acquisitions over the last two decades, some pretty large, it has never had a goodwill write-off, and has never taken a loss on a discontinued operation.
2. At least a semi-oligopoly. According to MarketWatch, Home Depot and Lowe’s have a combined 30% of the U.S. home improvement market, with Home Depot at 17%. This strong market position gives Home Depot economies of scale and power over their suppliers, as well as helps keep pricing to the consumer more stable.
The number of shares outstanding
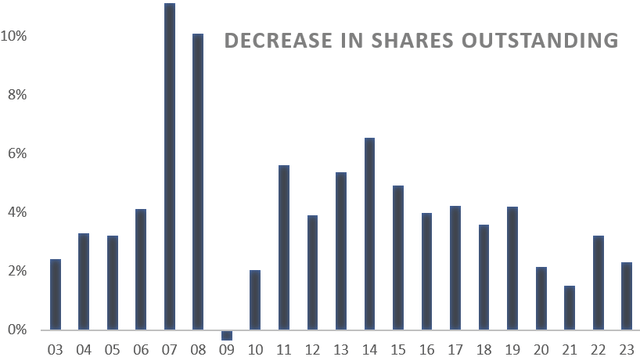
Simple math says that the fewer the shares outstanding, the greater the EPS. Here is a history of the annual percentage change in Home Depot’s shares outstanding:
Home Depot has 2.4 billion shares outstanding in 2001. Today it has 1.0 billion, a 57% decline. Further, over the last two decades, Home Depot averaged a 43% dividend payout ratio. So remarkably, Home Depot has averaged a combined 126% of earnings paid out as dividends plus share repurchases! All while making a number of value-added acquisitions.
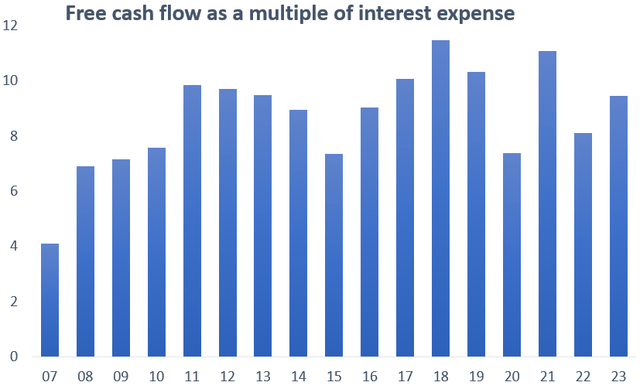
Paying out more to shareholders than it earns requires a high level of confidence by the debt markets because some of those dividends and stock buybacks came from borrowed money. Home Depot’s debt outstanding increased from $1 billion in 2003 to $44 billion today. Despite this surge in debt, the company maintains an A credit rating. Why? Because of this chart, which shows Home Depot’s free cash flow (after capital spending and acquisitions) as a multiple of its interest expense:
Despite all the debt growth, Home Depot averaged 9 times coverage of its debt expense, and the lowest year since 2008 (the middle of a housing recession!) was 7 times. So if you’re a lender, Home Depot remains an excellent credit that can handle more financial leverage.
Putting the four EPS factors together – the outlook for this year
Home Depot already took its shot at this one on its Q4 earnings call:
“Our diluted earnings per share percent growth is targeted to be approximately 1% compared to fiscal 2023.”
The weak 1% growth is explained by our four factors:
1. The number of stores grew by 0.6% last year.
2. Management expects comparable store sales growth of -1% because of still-weak home sales and the hangover from the COVID-period spending bubble. But a 53rd week this year will turn -1% comp sales into +1% reported sales
3. The profit margin should compress somewhat because of operating deleverage caused by the negative sales comps and pay increases made to increase employee retention, partly offset by some fixed cost-cutting.
4. The number of shares outstanding should decrease by its usual 2%.
Not a great result, but an unusual year because of the home sales weakness.
Putting the four EPS factors together – the long-term outlook
Home Depot management again chimed in on a long-term EPS estimate:
“We expect a base case once we return to market normalization of 3% to 4% sales growth, flat gross margin, an assumption of operating expense and operating margin leverage and growth and EPS growth of mid- to high single-digit percentages.”
Does that 5-9% long-term EPS growth forecast make sense? The 4 EPS factors says yes:
1. The number of stores is not much of a swing item. At best, it can add 1% in a year, but on average should be maybe ½% a year – 10 stores.
2. The number of shares outstanding should decline by 2% a year for the next few years, but slow towards 1% a year very long-term. The shares outstanding chart above shows the gradual decline in percentage share shrinkage.
3. Comparable store sales growth base case growth of 3-4% makes sense, in line with consumer spending growth.
4. A profit margin base case of flat also seems reasonable; it has been flat for nearly a decade.
The EPS growth factors add up to ½% + 1½% + 3½% + 0 = 6%, or the lower end of the range that Home Depot suggested. The upper end will require some better trends.
That better trend is out there, but will take some time.
The down-the-road key EPS growth game changer – Home sales
As a housing products retailer, Home Depot’s sales and profits are largely driven by:
- New home construction
- Renovation of a newly purchased home
- Ongoing maintenance and improvement of an owned home.
The first two, home sales, explain 40% of the change in Home Depot’s comparable sales, according to a regression analysis. More importantly, this chart shows the importance of home sales to Home Depot’s profit margin:
Home Depot financial reports, the Census Bureau, the National Association of Realtors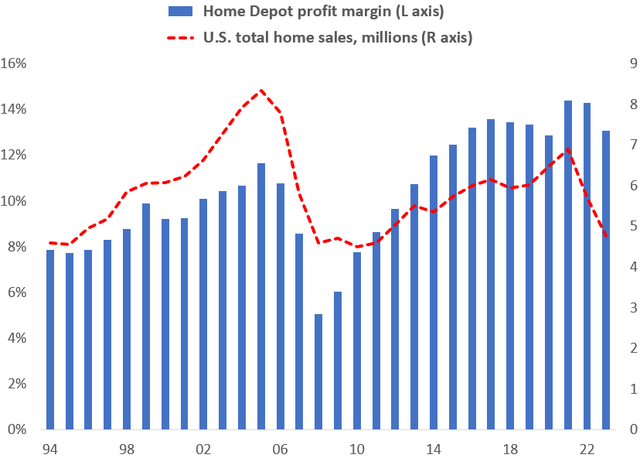
Source – Home Depot financial reports, Census Bureau, National Association of Realtors.
The current “turnover ratio” (existing home sales as a percent of total single family homes) is at lows only seen previously during two serious recessions, as this chart shows:
The Census Bureau, the National Association of Realtors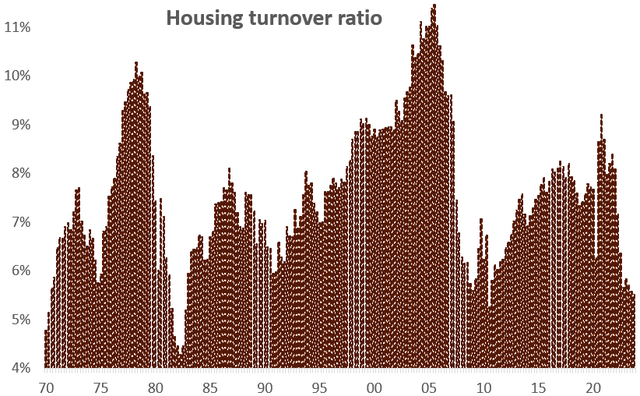
A return to a more normal housing turnover ratio should require improved housing affordability – some combination of: ((A)) lower home prices relative to household incomes; and ((B)) lower mortgage rates. For what it’s worth, Fannie Mae expects total home sales to rise by only 3% this year, but 10% next year. Maybe.
Another opportunity for Home Depot is the record $32 trillion of equity homeowners have in their properties. U.S. home mortgage debt is only 29% of home values, the lowest ratio since 1960 (when “Theme From a Summer Place” was sadly the #1 hit). So, when interest rates get low enough, home equity lines of credit should be a great financing tool for home improvement projects.
These opportunities will eventually surface, and when they do, Home Depot will have some double-digit EPS growth years. But they could be years away.
Wrapping up – valuation.
Here is a history of Home Depot’s P/E ratio over the past two decades:
Home Depot financial reports, Yahoo Finance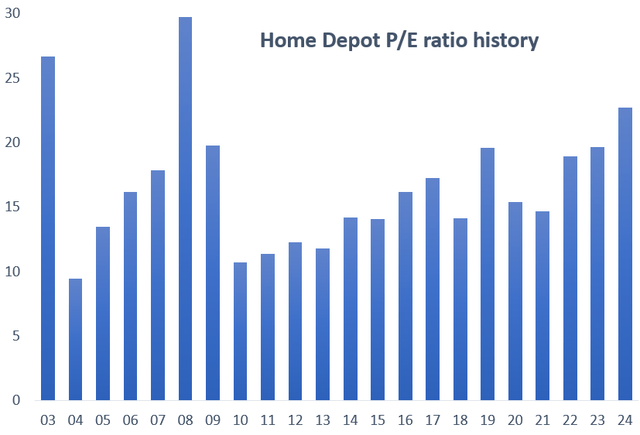
What jumps out to me in this chart is the steady increase in P/E ratio from 2010 to today. After all, the 26% average EPS growth rate from 1997 to 2019 is now only 6-9% according to the company.
I believe there are two reasons for the expanded P/E ratio. One is that investors got PTSD about the housing market after the traumatic bust of ’07 — ’11. That PTSD has been gradually wearing off. The other likely reason is increases in confidence that management is operating efficiently, expanding prudently, and is shareholder-friendly with its cash flow.
I do not expect further material multiple expansion for The Home Depot, Inc. stock from here, not for a 6-9% long-term EPS grower. I therefore believe that Home Depot is fairly valued today. Thus, I will be a buyer in one of two events:
- A material selloff in the stock
- More clarity that housing turnover is returning to its normal range, which could take a couple of years.
Analyst’s Disclosure: I/we have no stock, option or similar derivative position in any of the companies mentioned, and no plans to initiate any such positions within the next 72 hours. I wrote this article myself, and it expresses my own opinions. I am not receiving compensation for it (other than from Seeking Alpha). I have no business relationship with any company whose stock is mentioned in this article.
Seeking Alpha’s Disclosure: Past performance is no guarantee of future results. No recommendation or advice is being given as to whether any investment is suitable for a particular investor. Any views or opinions expressed above may not reflect those of Seeking Alpha as a whole. Seeking Alpha is not a licensed securities dealer, broker or US investment adviser or investment bank. Our analysts are third party authors that include both professional investors and individual investors who may not be licensed or certified by any institute or regulatory body.

