Summary:
- Home Depot’s Q1 2023 results showed a decrease in sales and net income with management expecting a year of “moderation” but the valuation does not reflect this.
- Sales for 2023 are expected to fall between 2% and 5%, and diluted EPS is expected to decrease around 7% to 13% giving the company a 21.3x forward P/E.
- History shows that sales from Home Depot get hit the hardest from the peer group during times of economic weakness and can be slow to recover.
- Home Depot’s free cash flow analysis yields 3.6% which is significantly lower than Lowe’s free cash flow yield of 5.3%.
Justin Sullivan
Shares of Home Depot (NYSE:HD) have been put on my watch list for an investment opportunity in a weakening economy. The company is currently only 9.1% off 52-week highs and the Q1 2023 results show revenue decreases from the prior year as the economy starts to weaken. Home Depot is the world’s largest home improvement retailer so economic weakness will inevitably filter through their results, hopefully creating a buying opportunity.
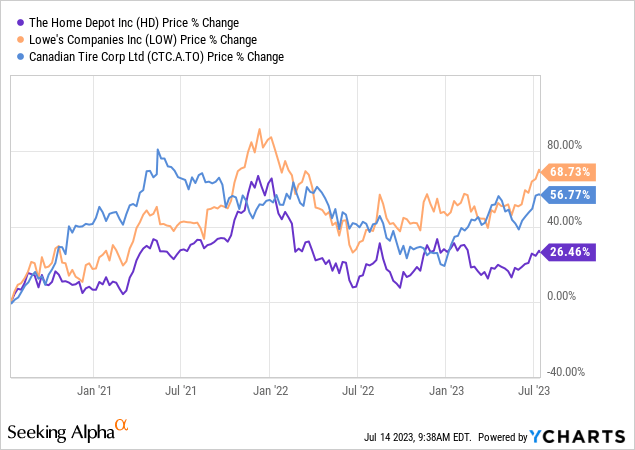
Purchasing this industry leader at the right price could make a great long-term investment and investors should think about adding Home Depot to their personal watch list. This article will look through the financial results of Home Depot and how they were affected by the last large economic and housing crash of 2008 to get a sense of worst case revenue declines. We will also compare Home Depot to its leading competitor in the U.S., Lowe’s (LOW) and Canadian Tire (OTCPK:CDNTF) as we look at relative valuations across the industry.
Latest Q1 2023 Results
In Home Depot’s latest Q1 results released back in May, the company reported weakening sales with total sales and comparable store sales both down 4.2% and 4.5%, respectively. Management commented on the strength of the market in prior years with the realization that 2023 will be a year of “moderation”.
The drop in revenues made its way down to earnings with net income of $3.9 billion ($3.82 per diluted share) compared with net earnings of $4.2 billion ($4.09 per diluted share) in the same period of 2022. The lower 6.6% decrease in EPS compared to the 7.1% drop in total net income was due to continued share repurchases over the year with the weighted average outstanding for the Q1 period decreasing 2.0% YoY.
The company guided for full year 2023 sales to fall in the 2 – 5% range which from the Q1 results already look to be near the lower end. Guidance for diluted EPS is for a decrease around 7% – 13%. Based on 2022 diluted EPS of $16.69, the midpoint of a 10% decrease would be around $15.00 for a forward P/E of 21.3x (4.7% earnings yield). This is a pretty low forward earnings yield where earnings might be compressed for a couple of years in an environment where GICs offer 5% yields.
Profitable and Growing
Home Depot has a vast footprint across North America with 500,000 employees and 2,300 stores. Given the scale of the retailer, Home Depot has been able to achieve a return on invested capital of 32.6% over the past five years. This level of profitability is well above my rule of thumb of 9% ROIC, allowing me to be confident that, in my opinion, the company is able to maintain its intrinsic value over the business cycle.
Home Depot’s Historical Profitability & Growth (compiled by author from company financials)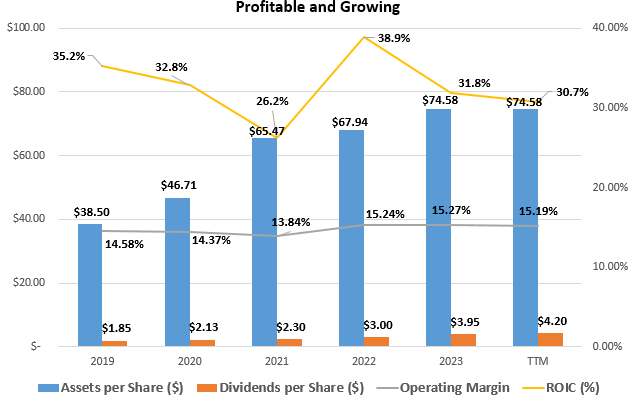
This high ROIC is also larger than the 24.6% achieved at Lowe’s over the past 5 years showing Home Depot’s industry leading operations. Home Depot also has higher gross margins than Lowe’s at 33.8% compared to 32.8% over the past 5 years. This difference in profitability grows as we move down the balance sheet with Lowe’s much higher selling, general, and administrative costs of 21.2% being +3.8% higher compared to Home Depot’s 17.4% SG&A expense rate. This SG&A difference is the primary driver of net income margins at Home Depot averaging 10.5% over the 5 year period compared to Lowe’s 6.3%.
Returning Cash To Shareholders
Home Depot does a tremendous job of returning cash flow to shareholders through the form of dividends and share repurchases. With capital expenditures and acquisitions only taking up on average 18% and 7%, respectively, of cash flow from operations since 2007, this leaves approximately 75% to be returned to investors through the form of dividends and share repurchases. With average cash flow from operations of $15.4 billion over the past five years, this 75% would imply free cash flow available to shareholders of $11.5 billion for only a 3.6% free cash flow yield at the current $316.3 billion market capitalization.
Cash Flow Analysis of Home Depot (compiled by author from company financials)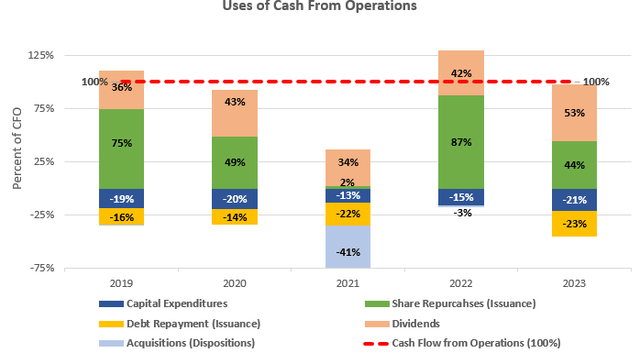
Home depot is a great company, but that does not make it a great investment at any price. From a relative valuation standpoint, Lowe’s looks like the more practical choice at the less expensive valuation. Lowe’s currently has a 4.8% free cash flow yield based on an updated market cap from the FCF analysis mentioned in my article on Lowe’s back in May. This 1.2% difference in earnings yields between the companies means investors are getting a 33% higher earnings yield with Lowe’s.
Valuation Comparison across Peers
In addition to the historical free cash flow analysis, the higher valuation from Home Depot can also be seen in other metrics. Looking across a peer group of Lowe’s and Canadian Tire to get a sense of relative valuation, Home Depot seems to be priced much higher than the group.
The forward P/E of 21.3x is the top of the pack and 24% higher than Lowe’s 17.2x P/E. Home Depot’s EV / EBITDA of 13.7x is the highest of the peer group being 13.2% higher than Lowe’s. The big standout from this peer group analysis is Canadian Tire, which while not a perfect peer competitor being more on the consumer side, is valued significantly cheaper at only 11.7x forward P/E! Now that forward P/E represents an 8.5% earnings which value investors could start to wrap their head around when risk-free GICs offer 5% interest rates.
Home Depot Valuation Comparison (compiled by author from Seeking Alpha market data)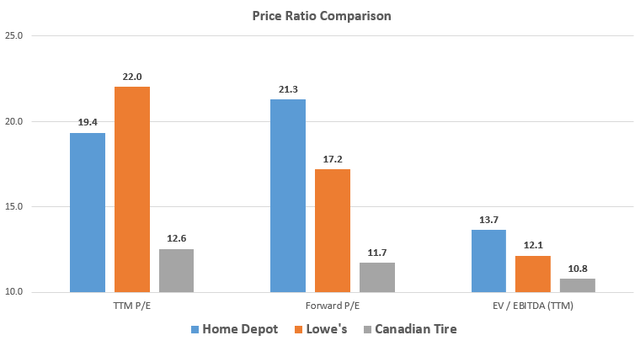
Growth at Home Depot vs. Lowe’s since 2008
The home improvement retail sector is crucial to the economy and the housing sector makes up a large proportion of GDP giving retailers like Home Depot a great runway for continued operation and growth alongside the economy. However, like all retail, the home improvement business is competitive and businesses compete on prices and efficient operations to win market share. This is epitomized in a recent quote from the CEO of Home Depot.
We operate in a large and highly fragmented market with unique characteristics that make it one of the most attractive sectors in retail, if not the economy as a whole. While we are the number one home improvement retailer in the world, we have a relatively small share of the market today, and there are significant opportunities in front of us, said Decker (CEO, Home Depot)
I always like to look at the long-term perspective and with the rise in interest rates and potential economic slowdown on the horizon, it is important to analyze how the home retailers were affected in the last big recession. Looking back to the 2008 financial crisis when property values plummeted and home building took a hit, Home Depot saw sales decline sequentially for three years from $79,002 billion in 2007 to $66,176 in 2010 for a whopping 16.3% total decline in revenues with a couple of years having big negative 7% sequential revenue drops.
Management has noted before that sales have been positively affected by the low interest rate environment and at-home spending during COVID. From history, it looks like these trends can take years to unwind as consumers and home builders tighten their belts.
Home Retailer Revenues Decline During 2008 Financial Crisis (complied by author from company financials)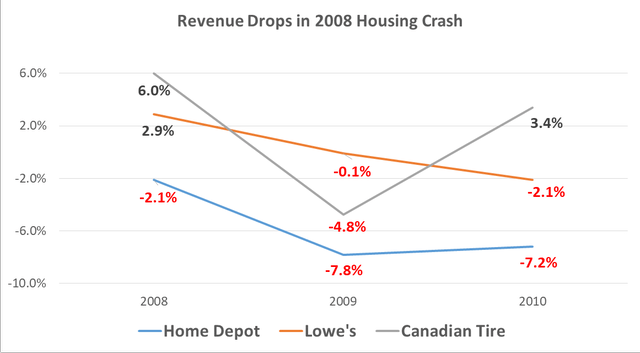
Getting a sense of the worst case scenario for revenues gives perspective, but let’s also keep in mind that Home Depot never lost money during the 2008 financial crisis, earnings just fell 60.7% from 2007 highs to lows in 2009 alongside the previously mentioned drop in revenues. Home Depot is a highly profitable business and a few bad years of sales growth (or even declines) do not break the company.
Since the 2008 financial crisis, Home Depot has gone on to grow revenues by 5.2% annualized based on the 3-year average revenues for 2009 to 2012. This growth rate is second in our peer comparisons with Lowe’s taking the revenue lead at 5.4% annualized growth and Canadian Tire at 4.9%. These are good mature long-term growth rates from all the competitors and show they are continuing to gain market share long term as they grow alongside the economy.
What about the Debt?
Home Depot has added significant amount of debt in recent years (+56.6%!) while also reducing the share count as can be seen below. However, the interest coverage (including lease payments) still looks very healthy at 7.3x in 2022. This +7x coverage leaves room for any mid-term revenue weakness and further or prolonged higher interest rates.
Debt & Share Capital at Home Depot (compiled by author from company financials)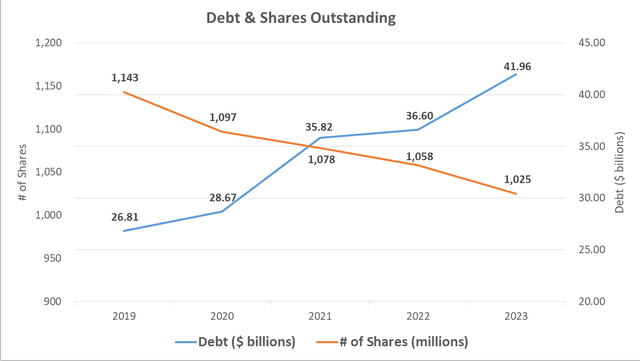
Also notable in the above graph is that since 2019, Home Depot has bought back a nice 10.8% of their total share count for an average repurchase rate of 2.7% of their outstanding shares a year. These share repurchases have helped support higher EPS growth than the long-term revenue growth rate mentioned earlier. I always like to see share repurchases by management as it shows capital budget discipline and management’s faith in the long-term prospects of the business.
Takeaway for Investors
Home Depot is a great industry-leading company but its valuation looks expensive on both a relative and absolute basis in an economy where sales are weakening. While Home Depot’s valuation might not be as cheap relatively compared to Lowe’s, the company is a great name to keep on my watch list for a buy during economic weakness when it trades at less expensive multiples. GICs around 5% represent an attractive alternative to riskier forward earnings yields which could be set to see some turmoil.
Editor’s Note: This article discusses one or more securities that do not trade on a major U.S. exchange. Please be aware of the risks associated with these stocks.
Analyst’s Disclosure: I/we have no stock, option or similar derivative position in any of the companies mentioned, and no plans to initiate any such positions within the next 72 hours. I wrote this article myself, and it expresses my own opinions. I am not receiving compensation for it (other than from Seeking Alpha). I have no business relationship with any company whose stock is mentioned in this article.
While the information and data presented in my articles are obtained from company documents and/or sources believed to be reliable, they have not been independently verified. The material is intended only as general information for your convenience, and should not in any way be construed as investment advice. I advise readers to conduct their own independent research to build their own independent opinions and/or consult a qualified investment advisor before making any investment decisions. I explicitly disclaim any liability that may arise from investment decisions you make based on my articles.
Seeking Alpha’s Disclosure: Past performance is no guarantee of future results. No recommendation or advice is being given as to whether any investment is suitable for a particular investor. Any views or opinions expressed above may not reflect those of Seeking Alpha as a whole. Seeking Alpha is not a licensed securities dealer, broker or US investment adviser or investment bank. Our analysts are third party authors that include both professional investors and individual investors who may not be licensed or certified by any institute or regulatory body.
