Summary:
- Home Depot recorded better-than-expected EPS figures but fell short on revenues in Q1.
- In this high-interest rate environment, many people might not want to invest in kitchens and bathrooms, so the company seems to be focusing more on professional customers.
- We explain why we think this home improvement retailing giant might be supported with buy-on-dips trading strategies going forward.

M. Suhail/iStock Editorial via Getty Images
During the first-quarter period, Home Depot, Inc. (NYSE:HD) recorded better-than-expected earnings figures but fell short on revenues. Specifically, the home repair retailer posted EPS figures of $3.63 (against the market’s consensus estimates of $3.60) on revenues of $36.42 billion (against the market’s consensus estimates of $36.66 billion). Concerns are circulating with respect to the average consumer’s willingness to invest in large-scale home renovation projects (such as kitchens and bathrooms), while we continue to languish within this current high-interest rate environment.
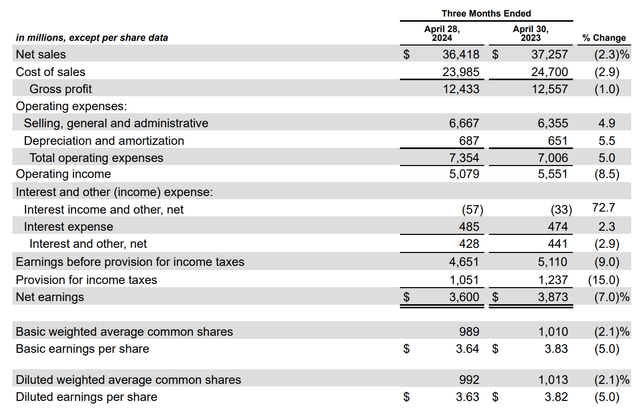
First-Quarter Earnings (Home Depot)
Overall, the company seems to be finding itself within a refocusing period that places more attention upon professional customers (as evidenced by its recent plans to acquire SRS Distribution). We are seeing some moderate selling pressure following this latest earnings release, but we will outline our broader bullish outlook on this stock – and explain why we think this home improvement retailing giant might be supported with buy-on-dips trading strategies going forward.
HD: Monthly Chart (Income Generator via TradingView)
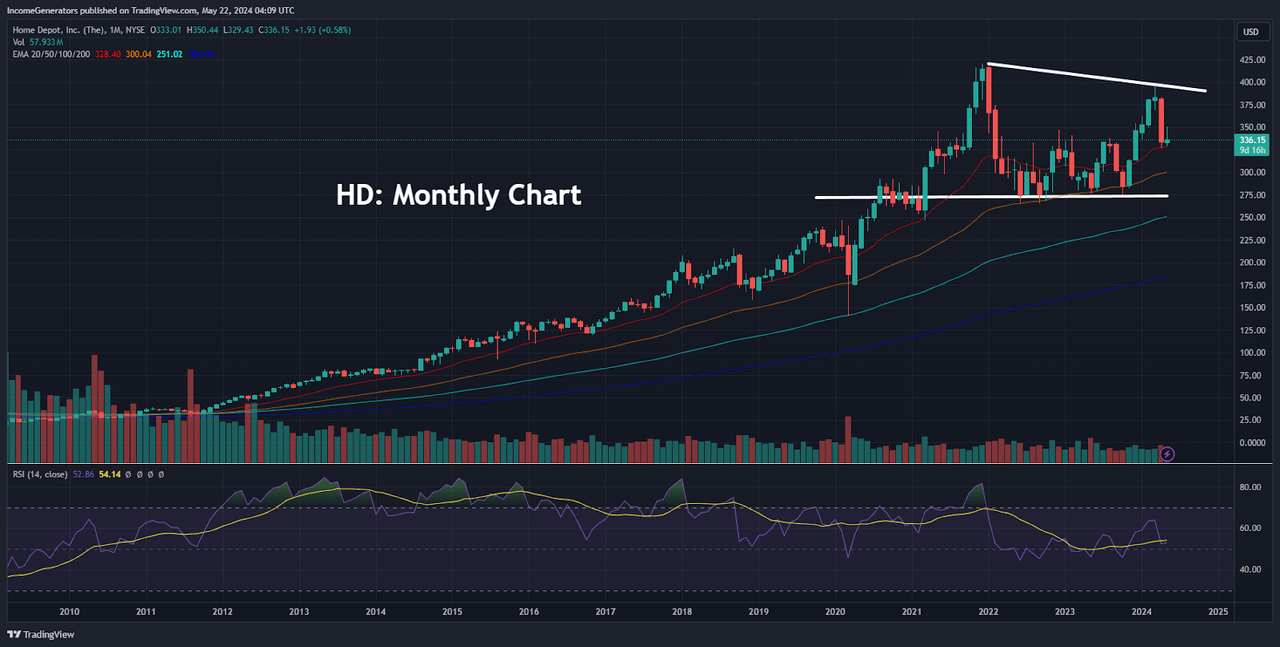
On the monthly chart, we can see that HD is an excellent example of a stock price history that tends to strictly obey its long-term exponential moving averages. For investors with a conservative portfolio outlook, this is an excellent sign (and not as common as some might think), so while we do see various instances of decline on the monthly price histories, it seems clear that these downward bearish moves should largely be interpreted as healthy corrections. Primary evidence for this positive characterization can be found in the fact that monthly indicator readings in the Relative Strength Index (RSI) tend to become overbought much more often than they tend to become oversold.
In the chart history shown above, we actually cannot find any instances in which a disappointing earnings scenario caused a massive disruption in surprising the consensus outlook. In contrast, we can see here that when prices tend to become overbought, they simply drift back toward their exponential moving averages long enough to allow indicator readings to revert back toward the midpoint of the histogram. Of course, this type of behavior cannot be expected to happen all the time (with any stock). However, this price history really does show an exceptional example of a stock that exhibits an incredibly stable uptrend – and then moderately corrects these gains over time.
Monthly Support Levels (Income Generator via TradingView)
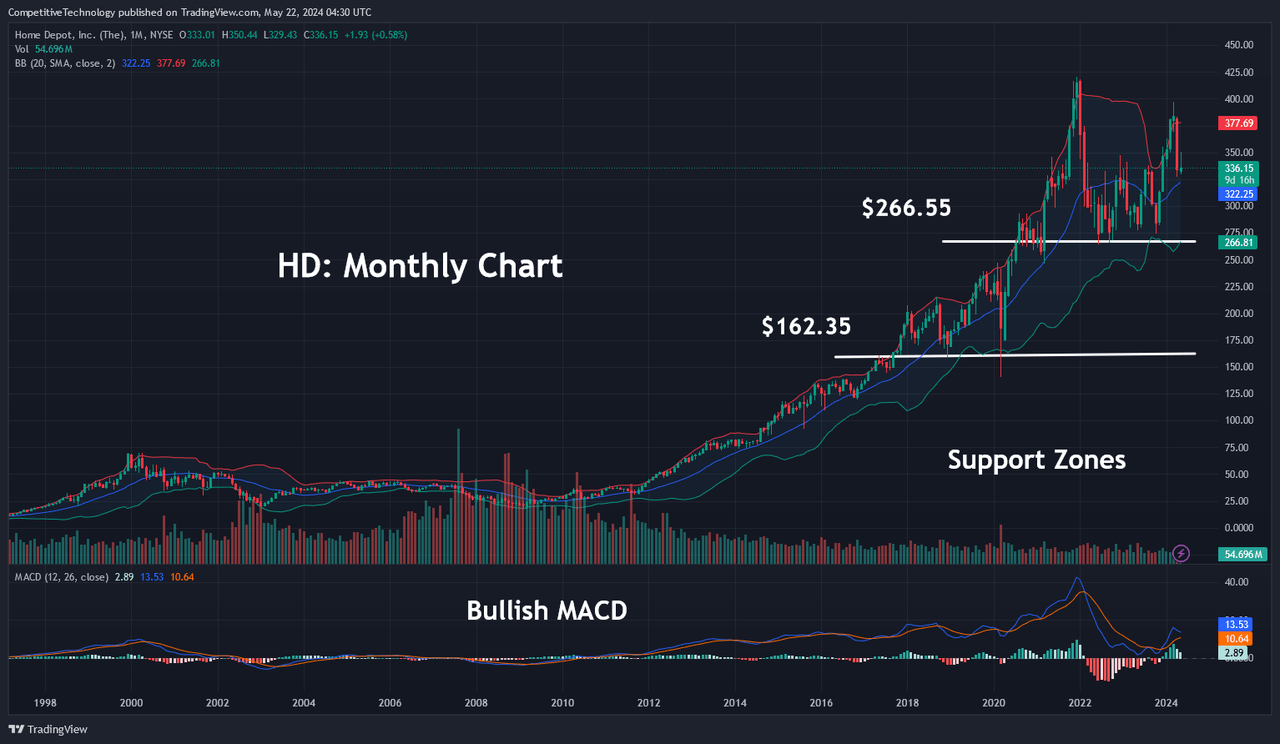
Looking at an alternative view of the same long-term price history, we can see that the stock is currently trading into its upper Bollinger Band (which is generally an indication that price rallies have become over-extended and might be ready to reverse course). Interestingly, we can see that this did occur during the April candle – and we are currently trading back toward the middle of the monthly Bollinger Band. Despite this recent decline in prices, monthly readings in the Moving Average Convergence Divergence remain positive (which makes it much less likely that we will ultimately see a stronger decline through long-term support levels).
In the chart above, we have outlined our targeted support levels at $266.55 and $162.35. These support zones stretch back to the beginning of 2021 and the end of 2018. Investors acting on the assumption that recent price rallies have extended too far can wait for potential entry points back toward these areas before looking to establish buy positions (or adding to current long positions). Alternatively, key resistance levels can now be found at the March 2024 highs (located at $396.87) and the December 2021 highs (located at $420.61). An upside breach of the former would target the latter, and we believe that an ultimate break of the December 2021 highs should be considered to be a highly bullish event that has the potential to accelerate further gains.
HD: Weekly Chart (Income Generator via TradingView)
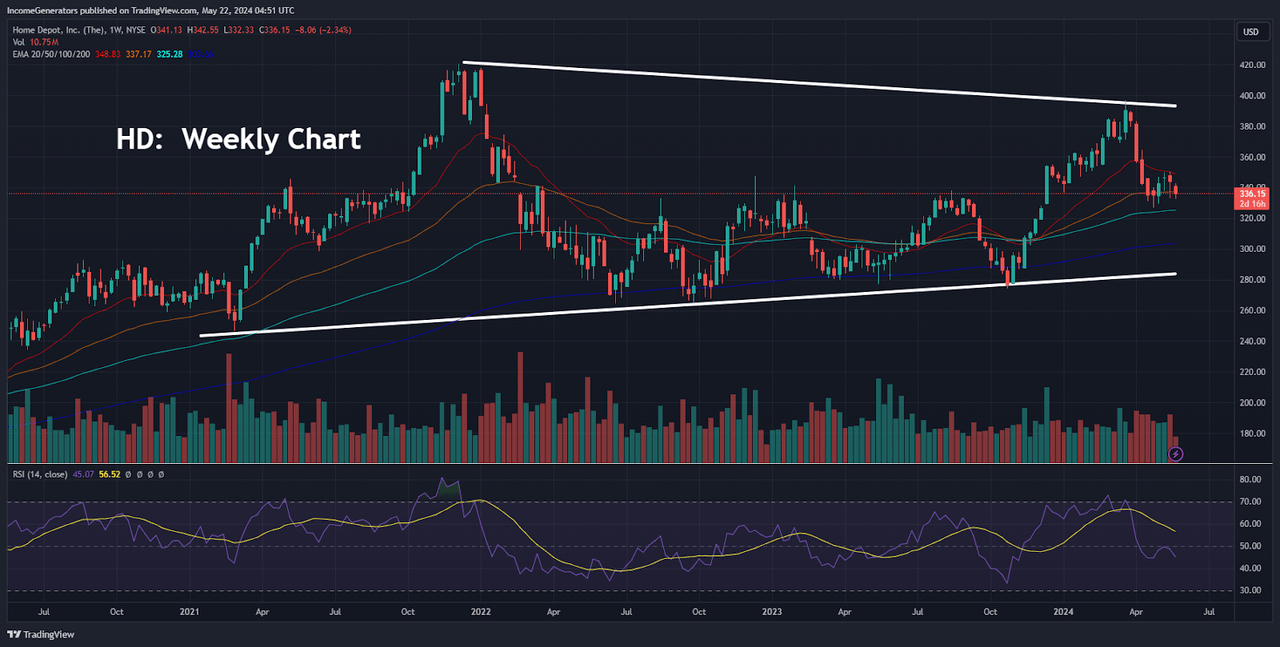
Drilling down into the weekly charts (Home Depot pun, fully intended), we can see that we currently have a symmetrical triangle that has been forming since January 2021. When we are dealing with symmetrical triangles, we tend to give a bit more credence to the broader trendline (which, in this case, would be the uptrend line). Primary reasoning for this simply comes from the fact that this is the trend that has been in place longer (and has usually held-up under a greater number of re-tests). These factors would also be true in the case of the current HD weekly chart (greater number of re-tests) – and this is why we would tend to side with the bulls in this scenario.
Unfortunately, there is not much evidence in the indicator readings themselves to agree or disagree with this assertion, as we are still holding near the midpoint of this period’s histogram. However, the RSI moving average is currently holding above the indicator reading itself, and this does offer a modestly bullish interpretation of the stock’s current price action.
HD: Daily Chart (Income Generator via TradingView)
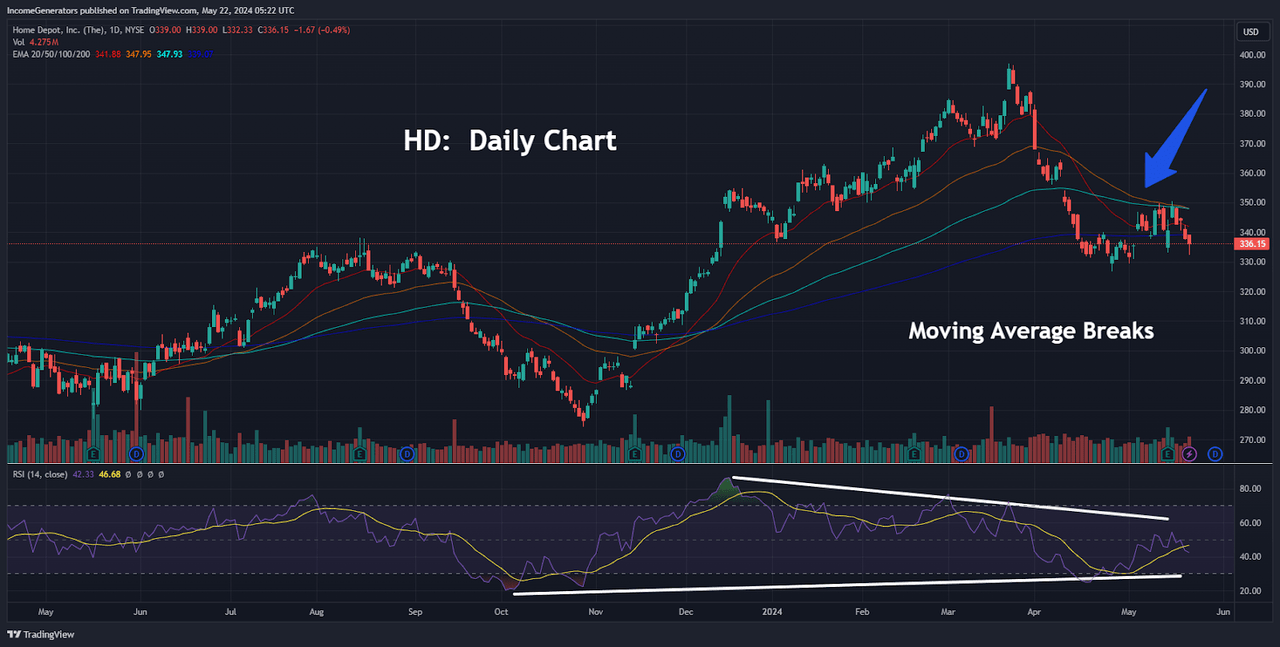
Finally, we will need to assess current activity on the daily charts, because this is where most of the market focuses its attention when dealing with technical analysis strategies. Specifically, we will need to look at the daily exponential moving averages because this is where we are actually starting to receive some conflicting information. Under the highlighted arrow, we have defined key moving average breaks in all of the major exponential moving averages. Essentially, this means that we have moved below the 20-day, 50-day, 100-day, and 200-day exponential moving average cluster – and this is not a good sign for HD bulls. We tend to believe that longer-term moving averages are more important – but these are not the signals that are typically discussed in the financial news media. If public sentiment is altered because a stock falls below its 100-day moving average, it shouldn’t be surprising to see a round of increased selling pressure in a commonly watched stock like Home Depot. For these reasons, we think it is entirely possible that share prices continue falling lower until we reach prior historical support levels near $274.26 (October 2023 lows). On the other side of the argument, we do have a modestly positive daily indicator reading in the RSI – but even this is still tempered by the fact that we are currently caught in a symmetrical triangle that tends not to be particularly decisive on its own.
On balance, we will be trading this stock from the topside. Given Home Depot’s history of maintaining stable share price trends (which almost appear to be self-correcting, in many cases), we are not seeing any alarm bells ringing which suggest that a new downside reversal might be imminent. That said, bullish investors can watch for possible breaks of recent daily lows at $326.90 (recorded on April 25th, 2024) as an initial sign that this stock might be heading lower. If this downside event does occur, we would begin to target the aforementioned October 2023 lows of $274.26 as the next bearish target.
Analyst’s Disclosure: I/we have a beneficial long position in the shares of HD either through stock ownership, options, or other derivatives. I wrote this article myself, and it expresses my own opinions. I am not receiving compensation for it (other than from Seeking Alpha). I have no business relationship with any company whose stock is mentioned in this article.
Seeking Alpha’s Disclosure: Past performance is no guarantee of future results. No recommendation or advice is being given as to whether any investment is suitable for a particular investor. Any views or opinions expressed above may not reflect those of Seeking Alpha as a whole. Seeking Alpha is not a licensed securities dealer, broker or US investment adviser or investment bank. Our analysts are third party authors that include both professional investors and individual investors who may not be licensed or certified by any institute or regulatory body.
