Summary:
- The Home Depot is the largest home improvement retailer in the world, with FY2022 revenues of $157 billion.
- The company operates over 2,300 stores offering a wide range of products and services in the US, Canada, and Mexico.
- Home Depot has a strong competitive position but is currently overpriced, making it a sell recommendation.
Justin Sullivan
Market Update
Home Depot is the market leader in the retail home improvement sector. It’s strong market position coupled with excellent financial metrics earns this company a place on my list of those companies which I watch closely.
My investing philosophy is simple – buy cheap and sell some (if not all) when it becomes expensive. My guiding light in this approach are my company valuations which I update on an annual basis or more frequently when there is a material change to either the company or the macroeconomic environment.
I last reviewed Home Depot in May 2022 (Buying Opportunities are Coming). I concluded at the time that the company was fairly valued and that investors should continue to HOLD the stock.
In hind sight this was a good call and the stock has outperformed the market since then.
In this update I think that the company’s fundamentals are still excellent but there has been a fundamental change to the macroeconomic environment – treasury yields are significantly higher and near-term economic growth expectations are lower.
The 10-year treasury yield is a fundamental input into estimating a company’s cost of capital. Increasing treasury yields cause costs of capital to rise and this acts like gravity on company valuations and drags them lower.
Even great companies can’t escape this. Let’s update my story for Home Depot.
Business Overview
Home Depot’s original market strategy, developed over 40 years ago, was to provide the most complete assortment of lumber, building materials and home improvement products, competitively priced in a service-oriented retail situation.
Over the years the company has innovated and continuously improved its offerings and service performance, but the original objective still remains in place today.
United States’ Addressable Market
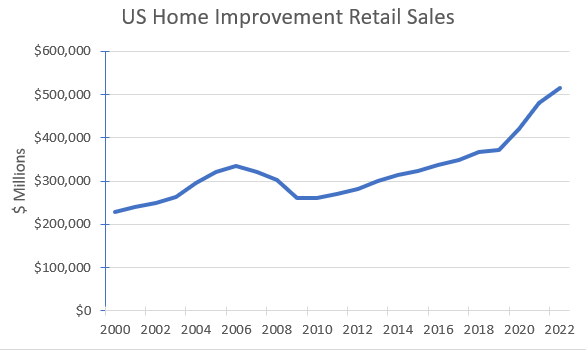
The historical US retail market for home improvement products is shown on the following chart of annual sector revenues:
Author’s compilation using data from the US Department of Census (monthly retail sales report for NAICS 444),
The key points from the chart:
- The sector is cyclical, and demand is significantly impacted by the health of the economy.
- In the GFC recession, it took 10 years for the sector to recover back to its pre-recession revenue peak (from 2006 to 2016).
- In the period between 2008 and 2019 when economic conditions were reasonably stable, the sector grew at a steady 4% per year.
- The COVID pandemic ended up creating unusually high demand for the sector’s products.
According to the North American Retail Hardware Association the sector is very fragmented but is dominated by the “big box” retailers which includes Home Depot, Lowe’s (LOW), Tractor Supply (TSCO) and several privately owned companies including Menards Inc, 84 Lumber, Northern Tool & Equipment and Carter Lumber Company.
It is estimated that the big box retailers have a 50% share of the US market.
The entire sector benefited from the COVID restrictions. Due to the various restrictions imposed by government on work and travel and courtesy of the transfer payments made by government to consumers there was an enormous surge in sales.
I estimate that the large chains did better than their smaller competitors and may have increased their market share as it was easier for them to manage the mandated operating compliance rules.
Until recently the consensus sector revenue growth for the next few years has been around 6% per year. Many of these projections are now becoming a little dated and the more recent deteriorating economic conditions may have cause to temper the sector’s near-term growth projections.
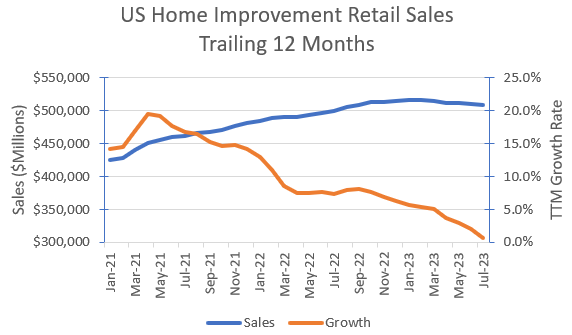
This can be seen in the following chart which shows the rolling 12-month sector revenues and annual grow rate:
Author’s compilation using data monthly data from the US Department of Census retail sales report for NAICS 444.
The chart highlights that the growth in retail sales peaked in May 2021 (due to the easy comparisons caused by COVID) and has been declining ever since.
At the end of last month (July 2023) the chart indicates that on a rolling 12-month basis the sector’s revenue growth is likely to be negative in future months.
International
Home Depot expanded its reach internationally through a relatively small acquisition in Canada in 1994. Today the company has expanded organically to 182 Canadian stores. In 2001 the company acquired its first Mexican store and today has 133 stores. However not all the international expansions have been successful. In 2006 the company acquired 12 stores in China but by 2012 they were all closed with a “clash of cultures” being slated as the reason for The Home Depot format not working in China.
In 2022 international sales represented 8% of total net sales revenues. The proportion of international sales has been unchanged since 2016.
Maintenance, Repairs & Operations Segment
Home Depot’s management have waxed and waned over the years regarding this segment. It is currently viewed positively as a means to extend the company’s addressable market following the acquisition of HD Supply in 2020.
Long term investors will recall that HD Supply was at one time a division of Home Depot and it was sold to private equity interests in 2007. Interestingly HD Supply was sold for $8,300 M in 2007 and re-acquired for $8,692 M in 2020.
Various industry experts estimate the size of the US market size to be around $150 B. The segment is thought to be mature and growing at around 2.5% per year. The market is quite diversified, and HD Supply does not participate in all the markets within the segment.
Home Depot’s Historical Financial Performance
Revenues and Operating Margins
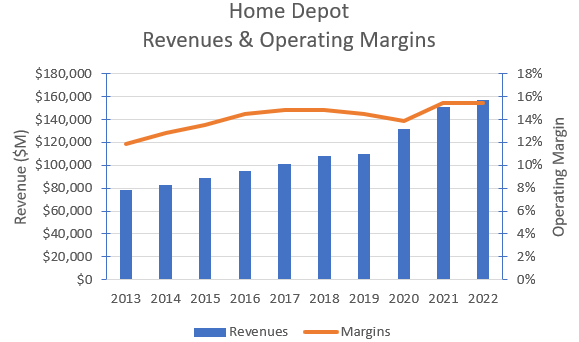
Home Depot’s consolidated historical revenues and adjusted operating margins are shown in the chart below:
Author’s compilation using data from Home Depot’s 10-K filings.
It should be noted that in 2019 there were changes to the way the accounting standards treated operating leases. I have made manual adjustments to Home Depot’ historical financial accounts to ensure consistency with the current financial statements.
Home Depot’s revenue growth has not come by significantly increasing its store count (store growth has averaged 2% for more than 10 years). Growth has predominantly been achieved by convincing existing customers to spend more within the Home Depot store (commodity price inflation has also been helpful).
Home Depot has been slowly gaining market share as it has consistently achieved higher revenue growth than the US sector. Operating margins have also increased as more volume went through the business.
The company suffered a reduction in margin during the early stages of COVID but has since recovered these costs and FY2022 margins were at the highest reported levels for more than 15 years.
I recently completed an analysis of the 32 largest listed home improvement retailers in the world. The current median operating margin for this group is 6.1% and the 90th percentile is 15.4% (the same as Home Depot’s FY2022 margin). This suggests that Home Depot’s operating margin is in the sector’s highest decile.
Home Depot is being true to its objective of being competitively priced. Its FY2022 gross margin was 33.5% which I estimate is lower than the sector’s global median of 35.7% – almost placing Home Depot in the sector’s lowest quartile.
Cash Flows
The following table summarizes Home Depot’s cash flows for the last 10 years:

Author’s compilation using data from Home Depot’s 10-K filings.
The key information from this table includes:
- Operating cash flow has significantly declined over the last 2 years because the level of working capital has doubled from $8,013 M in FY2020 to $16,760 M in FY2022. The main contributor is inventory, and it appears to be COVID related. I expect that this will be rectified over the coming quarters.
- The business requires a low level of reinvestment (2.8% of sales) which is a significant contributor to the high returns to shareholders.
- The company has released funds to shareholders by taking on a relatively modest amount of debt for a company of its type and scale.
- Home Depot returns 11.2% of sales to shareholders in a mix of dividends and stock buybacks. The data indicates that this level is reasonably sustainable.
Capital Structure
The following chart shows the history of Home Depot’s capital structure:
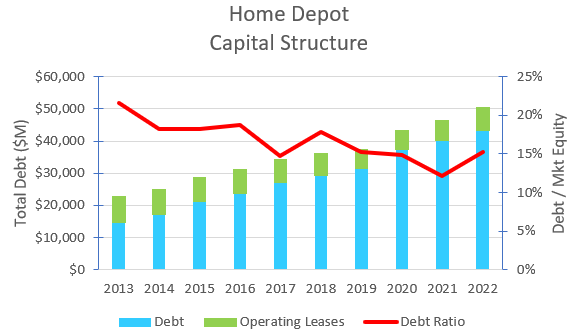
Author’s compilation using data from Home Depot’s 10-K filings.
Home Depot has been steadily reducing its debt ratio since the GFC. Typical companies in this sector have a debt ratio of 34% (Home Depot is 15%) which indicates that Home Depot’s balance sheet is being managed reasonably conservatively.
The data would suggest that the balance sheet is strong, and the company is well positioned to be able to apply additional leverage to its balance sheet if the opportunity arises (or becomes necessary).
Return on Invested Capital
The following chart shows the history of Home Depot’s return on invested capital (ROIC):
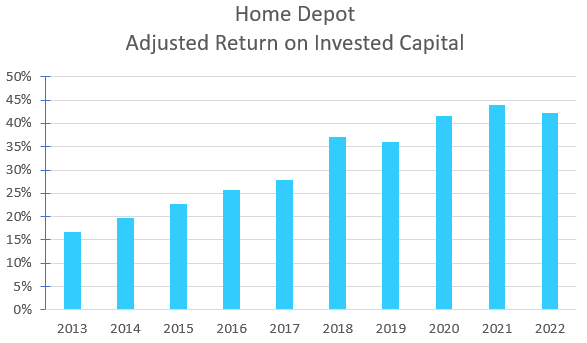
Author’s compilation using data from Home Depot’s 10-K filings.
The chart shows the spectacular improvement in the ROIC that has taken place since the GFC.
This is an outstanding result. A typical ROIC for companies in this sector is 7.5% and Home Depot’s current ROIC is in the sector’s highest decile.
In my assessment this metric is the most fundamental for investors. In my experience I have only found one other retailer of size which matches this result (AutoZone AZO).
Historical Stock Returns

Author’s compilation using data from Yahoo Finance.
The data indicates that Home Depot has been a wonderful investment for a long period of time and has easily outperformed the general market but there have been periods where the stock has significantly under-performed.
This reinforces the view that there are certain times in the economic cycle when investors need to be careful about their exposure to even the best of companies.
My Investment Thesis for Home Depot
The company has recently reported its Q2 earnings. Trailing 12-month revenue growth is now flat and management is indicating that FY2023 revenues could be up to 5% lower than FY2022.
The current consensus revenue forecast for FY2023 is 2.6% lower than FY2022’s actual and it is projected that FY2024 revenues will increase by 2.8% over FY2023. At this stage I would think that there is reasonable potential for FY2024 to be significantly lower than the current consensus if the US economy were to go into a recession
In my valuation work I do not attempt to forecast macroeconomic events. I use consensus estimates for the near term and then project a reasonably steady-state economic scenario. I deal with the impacts of any macroeconomic event by continuously updating the valuation as more significant market information becomes available.
My scenario for Home Depot continues to be reasonably upbeat and optimistic:
Growth Story
Home Depot has consistently grown revenues faster than the sector, which reflects the strength of its value proposition. I expect that this will continue given the high degree of market fragmentation. The sector is close to maturity and not withstanding any recession, the sector is expected to grow at 4% to 5% per year. I think Home Depot’s growth will be higher than the sector’s forecast.
I do not expect that Home Depot will attempt to shift the mix of its revenues between the US and its international markets nor am I expecting any sizable acquisitions.
Margin Story
Home Depot’s operating margins have been slowly rising for many years and are in the sector’s highest decile. I suspect that given the economic headwinds which are coming and with a more competitive environment I don’t believe that margins can continue to increase and will be flat to lower from here.
Growth Efficiency
As the sector’s growth flattens external pressure may be placed on the company to make investments to extend its reach into adjacent markets or into new countries in order to extend the company’s growth trajectory. I expect that management discipline will prevail and this pressure will be resisted.
The company is already very capital efficient – its capital efficiency ratio (sales / invested capital) is in the sector’s highest quartile. It would not be unreasonable for this ratio to deteriorate back towards the sector’s average. I am not forecasting for the ratio to weaken this sharply, but it means that there may be little opportunity to significantly lower the level of capital spending over time.
Risk Story
As Home Depot settles into a lower growth situation then its capital structure can be adjusted to take on some more debt provided there isn’t a significant lowering of the company’s market capitalization. This will shift the debt ratio closer to the median levels of the sector and keep the company’s cost of capital close to the median for all US companies.
Competitive Advantages
Home Depot’s competitive position is very strong and its key strengths are associated with its brand, customer service and store footprint. There will be an inevitable decline over time in the company’s ROIC, but I expect that it will always be significantly higher than its cost of capital.
Valuation Assumptions
The following table summarizes the key inputs into the valuation:
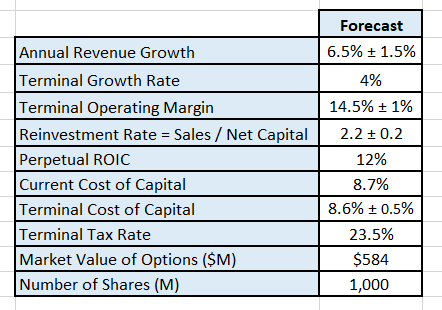
Author’s valuation model inputs.
I have used consensus revenue estimates for the first 2 years of the model and from there I have inserted my revenue growth estimate for years 3 to 7.
Discounted Cash Flow Valuation
The valuation has been performed in $USD:
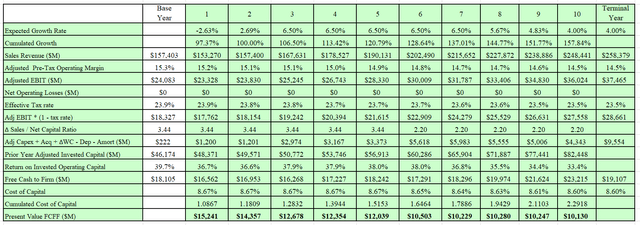
Author’s valuation model output.
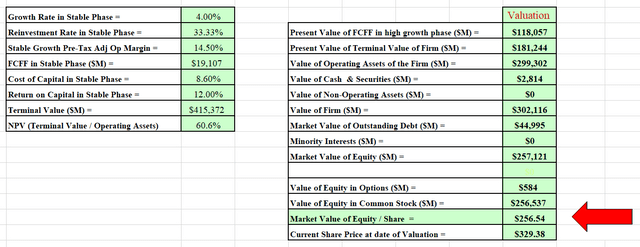
Author’s valuation model output.
I also developed a Monte Carlo simulation for the valuation based on the range of inputs for the valuation. The output of the simulation is developed after 100,000 iterations.
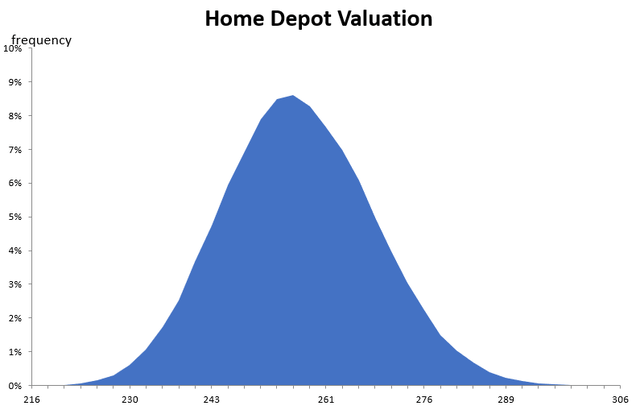
Author’s valuation model Monte Carlo simulation.
The simulation indicates that based on my future scenario, Home Depot’s intrinsic value is between $216 and $306 per share with an expected value of $257.
This would indicate that Home Depot is currently overpriced.
Why Has the Valuation Fallen?
The key reason that my valuation is lower is the higher terminal cost of capital (7.25% to 8.6%). All things being equal higher interest rates lead to higher discount rates and lower valuations.
In general, the stock market has yet to adjust market prices to the inevitable lower valuations that have been caused by higher discount rates.
Inputs Required to Justify Current Price
To test what company inputs would be required to justify Home Depot’s current price ($329) I constructed the following table which shows the resulting valuation if either the terminal operating margin or the expected sales growth were changed:
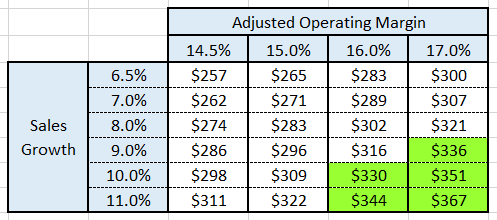
Author’s compilation.
Readers should remember that Home Depot’s current adjusted operating margin is 15.3% and its 10-year revenue CAGR is 7.7%.
The table indicates that to justify the current market price, Home Depot’s sales growth must be above 9% and operating margins must be at least 16%.
I am reasonably confident that these levels are very unlikely and for these reasons I conclude that Home Depot is currently more than likely to be expensive relative to its current intrinsic value.
Final Recommendation
Home Depot is a leading US retailer and the global leader in its sector. Adherence to its core value proposition has enabled the company to achieve outstanding returns on capital for many years. I see no reason for this to change over the long term.
Much of the available macroeconomic data suggests that the US economy (and much of the world) appears to be heading into a recession. At this stage there is no indication as to how severe the recession will be.
Home Depot operates in a cyclical retail sector and revenues are heavily influenced by the health of the economy. The most recent retail data suggests that consumers are starting to spend less, and Home Depot’s management is now forecasting that FY2023 revenues will be lower than the previous year.
The uncertain economic outlook and lower revenue forecasts have had little impact on the share price to date. Although the stock is well off its all-time high ($411 in December 2021) the current price is close to its 12-month high.
Clearly Home Depot is an excellent company and at the right price would be an excellent addition to anyone’s portfolio but as I have shown there have been significant periods of time when the stock under-performs the market.
By my assessment the company is currently over-priced and as a result I think that holders of the stock shock look very carefully at their portfolio allocation and ensure that the weighting is appropriate. In my opinion the company is a SELL.
If there was a significant retracement in Home Depot’s stock price, then I would highly recommend that investors buy this stock aggressively.
Analyst’s Disclosure: I/we have no stock, option or similar derivative position in any of the companies mentioned, and no plans to initiate any such positions within the next 72 hours. I wrote this article myself, and it expresses my own opinions. I am not receiving compensation for it (other than from Seeking Alpha). I have no business relationship with any company whose stock is mentioned in this article.
Seeking Alpha’s Disclosure: Past performance is no guarantee of future results. No recommendation or advice is being given as to whether any investment is suitable for a particular investor. Any views or opinions expressed above may not reflect those of Seeking Alpha as a whole. Seeking Alpha is not a licensed securities dealer, broker or US investment adviser or investment bank. Our analysts are third party authors that include both professional investors and individual investors who may not be licensed or certified by any institute or regulatory body.
