Summary:
- Tesla, Inc. has become the only new car company in decades to achieve significant profitability and has made EVs mainstream.
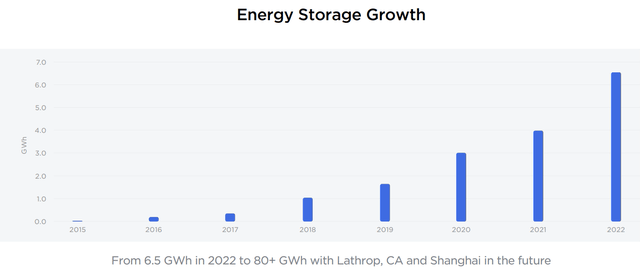
- It has strong optionality in battery storage, which is growing at 50% per year and, by 2027, could make up 20% of profits.
- Free cash flow is growing at 30%, and by 2028 Tesla’s $24 billion in annual free cash flow is expected to overshadow any other rival.
- Tesla is expected to grow 18% to 19% long-term and is the only car maker I would ever consider owning directly. It’s 27% undervalued and could almost double by 2025.
- Long term, combining Tesla with these four 8+% yielding blue-chips can deliver a 4% to 4.5% very conservative yield and 15% to 20% long-term income growth. In fact, this strategy could let you get a Tesla for free, with your dividends paying for the Volvo of EVs.
master1305
My biggest investing passion is safe, generous, and steadily growing income. There is nothing sexier than that, and here’s why.
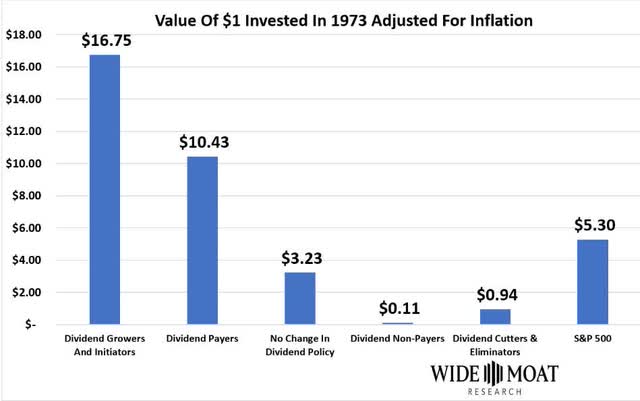
Over the last 50 years, dividend growth blue-chips have changed lives like no other asset class.
Do you know the only thing that gives me pleasure? It’s to see my dividends coming in.” – John D. Rockefeller.
Rockefeller, the 3rd richest man in history, was famous for his love of dividends. His love of safe and growing dividends is why the only two dividend aristocrats in the energy sector, Exxon Mobil (XOM) and Chevron (CVX), were created out of his Standard Oil empire.
But while Rockefeller and I are super excited about the long-term compounding power of dividend blue chips, I know that boring dividends haven’t been that popular in recent years.
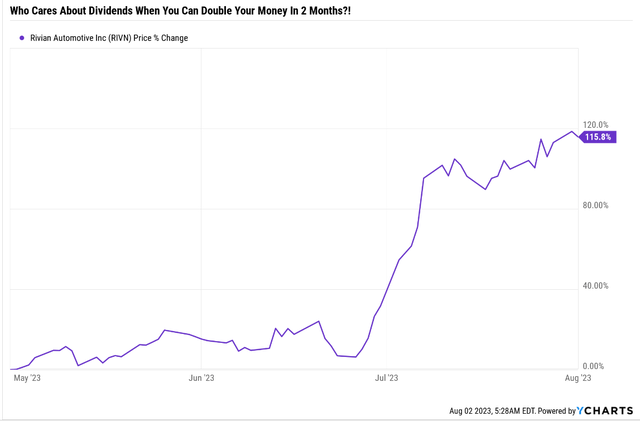
116% returns in 2 months! Who needs dividends when you can get returns like this?! Rivian Automotive (RIVN) is going to make us all millionaires! Except for one little detail.
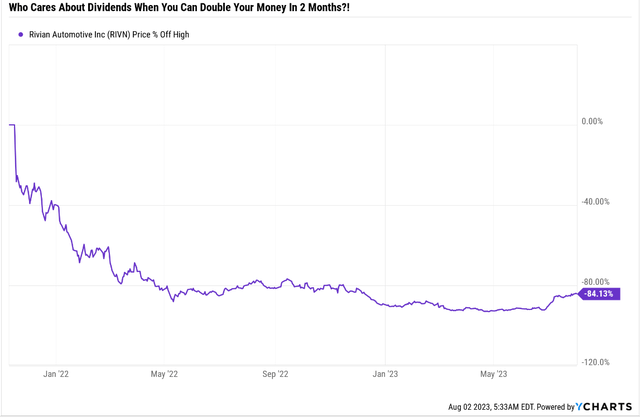
Rivian was one of the ultimate examples of speculative mania during the pandemic, hitting a $150 billion market cap 3X more valuable than Ford (F) and General Motors (GM) combined, with zero sales.
It fell 90% during the 2022 Bear market. If you were an early investor in Rivian, then after that 115% rally, you only needed to double again…and then one double, and you are back to breakeven!
Breaking even after three doublings! Dream big, baby!;)
I’m not here to talk about Rivian, a speculative company that analysts think that even $35 billion in sales in 2028 won’t cause it to become profitable.
- -$640 million net profit in 2028 on $35 billion in sales
- vs. -$5.6 billion in 2023 on $4 billion in sales.
I’m here to talk about Tesla, Inc. (NASDAQ:TSLA), the original, sexy electric vehicle (“EV”) company of the modern age. And I will show you why Tesla is a potentially wonderful speculative hyper-growth blue chip.
One that can be combined with ultra-yield Ultra SWANs like TC Energy Corporation (TRP) or British American Tobacco p.l.c. (BTI) to generate a 4% very secure yield today and potentially close to 20% annual income growth in the coming years!
The Power Of Hypergrowth + High-Yield
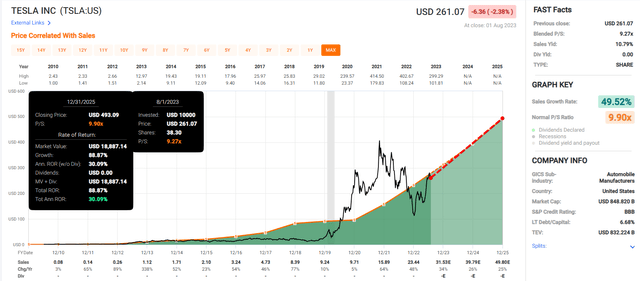
Total Returns Since 2010
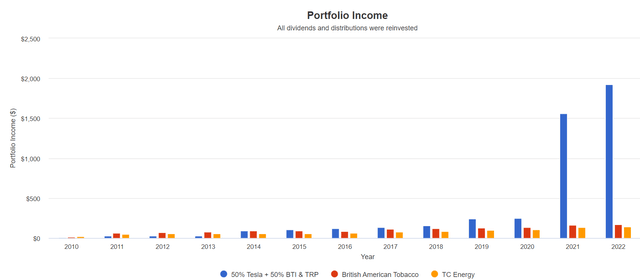
It’s not tough to believe that Tesla, combined with high-yield blue chips, can boost returns. But you might be surprised at just how much it boosts income, too.
How To Earn 4X More Income Than Pure High-Yield Plays Alone
| Metric | BTI | TRP | TSLA + BTI & TRP |
| Total Dividends | $1,311 | $991 | $4,668 |
| Total Inflation-Adjusted Dividends | $943.17 | $712.95 | $3,358.27 |
| Annualized Income Growth Rate | 9.0% | 8.5% | 42.2% |
| Total Income/Initial Investment % | 1.31 | 0.99 | 4.67 |
| Inflation-Adjusted Income/Initial Investment % | 0.94 | 0.71 | 3.36 |
| Starting Yield | 6.2% | 5.2% | 2.8% |
| Today’s Annual Dividend Return On Your Starting Investment (Yield On Cost) | 17.4% | 13.9% | 192.1% |
| 2023 Inflation-Adjusted Annual Dividend Return On Your Starting Investment (Inflation-Adjusted Yield On Cost) | 12.5% | 10.0% | 138.2% |
(Source: Portfolio Visualizer Premium.)
This is why it pays to combine yield with growth.
Long-term income growth tracks total returns. Anyone with at least ten years in their time horizon should consider bar-belling yield with some growth.
Tesla: The Stuff Rich Retirement Dreams Are Made Of
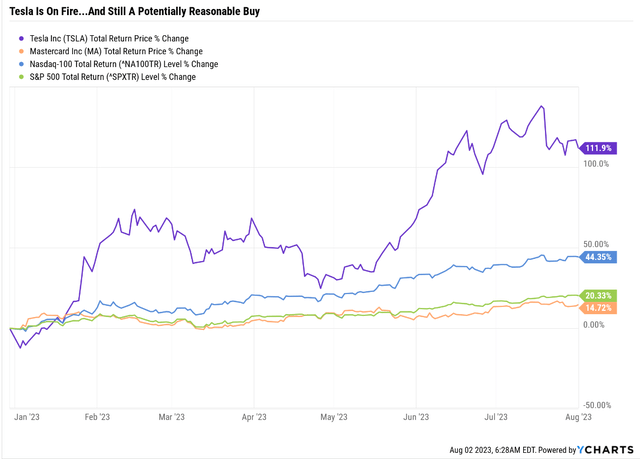
Tesla is up over 100%, and unlike Rivian, it’s been a millionaire dream-maker for many investors.
Total Returns Since 2010
Tesla is up 164X in 13 years, 16X more than the Nasdaq, which is up “only” 10-fold!
Tesla is one of the greatest success stories in capitalist history, and it’s not a bubble.
Why Tesla Likely Isn’t In A Bubble Right Now
Tesla isn’t some unprofitable speculative startup, but instead a very real and profitable company.
- S&P rates them BBB stable = 7.5% 30-year bankruptcy risk.
Ford is BB+ positive outlook (14% bankruptcy risk), and GM is BBB stable.
Tesla is an amazingly efficient profit engine. And, no, EV tax credits aren’t the reason why.
In 2023, EV credits are expected to make up $1.9 billion of Tesla’s sales.
- 2% of sales
- 17% of profit.
In 2027 analysts expect tax credits to still make up $1.4 billion worth of sales.
- 0.7% of sales
- 5% of profit.
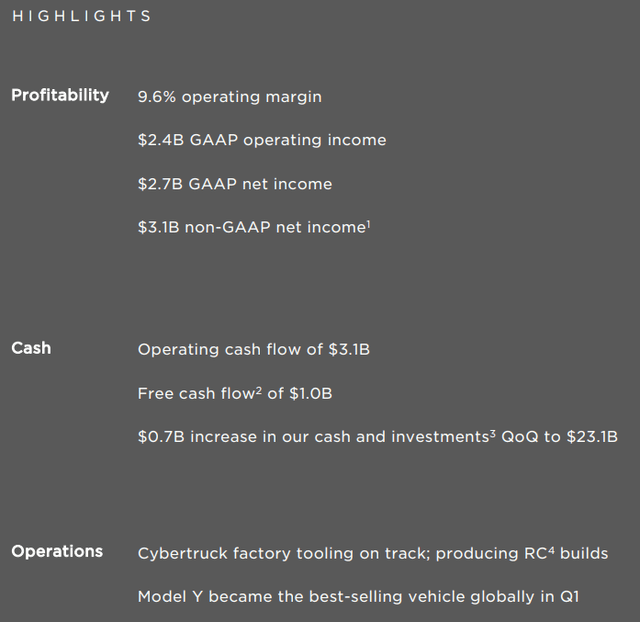
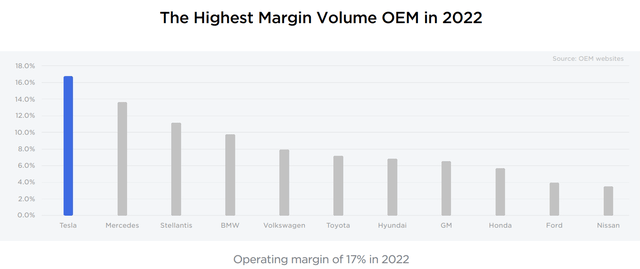
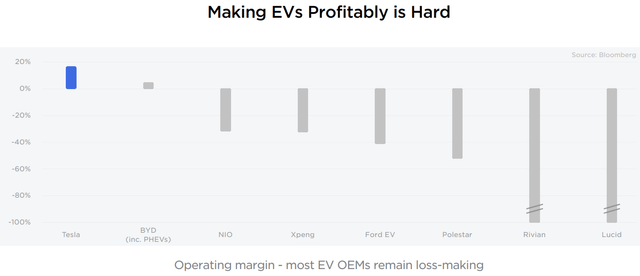
Tesla is generating margins far superior to most of its peers, including $4 billion in annualized free cash flow in the most recent quarter.
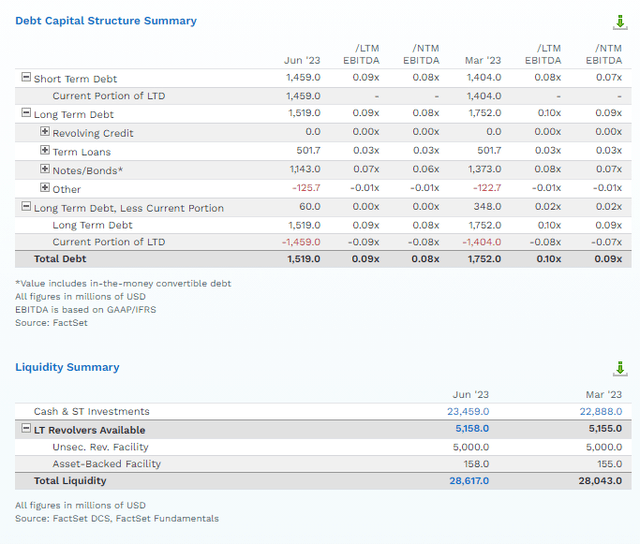
Tesla’s mountain of cash and access to low-cost capital is now at industry-leading levels.
| Company | Tesla | GM | Ford | Toyota |
| Credit Rating | BBB Stable | BBB Stable | BB+ Positive | A+ stable |
| Cash | $23,459 | $35,842 | $42,821 | 56480 |
| Credit Lines | $5,158 | $48,153 | $22,596 | 96919.2 |
| Liquidity | $28,617 | $83,995 | $65,417 | $153,399 |
| 12-Month Forward Free Cash Flow Consensus | $8,426 | $5,874 | $3,354 | $10,003 |
| 12-Month Forward R&D Spending Consensus | $3,638 | $10,000 | $8,550 | $9,127 |
| 12-Month Forward Capex Consensus | $8,935 | $11,391 | $8,935 | $12,605 |
| 12-Month Forward Growth Spending Consensus | $12,573 | $21,391 | $17,485 | $21,732 |
(Source: FactSet Research Terminal.)
Regarding stocks, I have no desire to ever own a car company. The only exception might be Tesla, because it’s such an aspirational brand that it can spend 33% to 50% less on growth and grow much faster.
(Source: FactSet Research Terminal)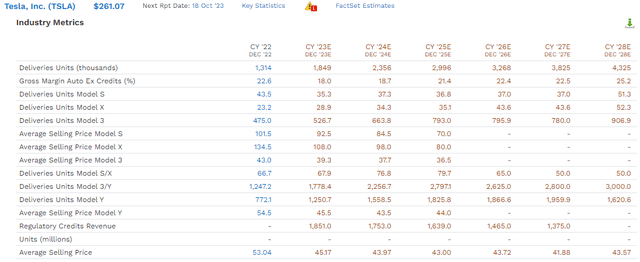
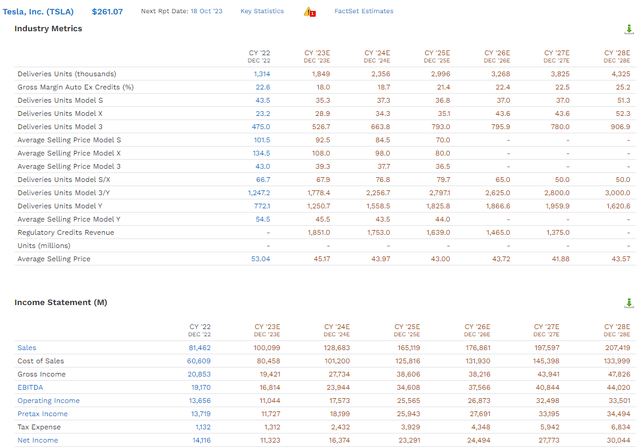
This year Tesla is expected to hit almost 2 million deliveries, and that’s expected to more than double to 4.3 million by 2028.
Telsa Medium-Term Growth Consensus
| Year | Sales | Free Cash Flow | EBITDA | EBIT (Operating Income) | Net Income |
| 2022 | $81,462 | $7,566 | $19,170 | $13,656 | $14,116 |
| 2023 | $100,099 | $6,476 | $16,814 | $11,044 | $11,323 |
| 2024 | $128,683 | $10,375 | $23,944 | $17,573 | $16,374 |
| 2025 | $165,119 | $14,480 | $34,608 | $25,565 | $23,291 |
| 2026 | $176,861 | $15,261 | $37,566 | $26,873 | $24,494 |
| 2027 | $197,597 | $20,516 | $40,844 | $32,498 | $27,022 |
| 2028 | $207,419 | $23,998 | $44,020 | $33,501 | $30,044 |
| Annualized Growth 2022-2028 | 16.86% | 29.95% | 14.86% | 16.13% | 21.55% |
| Cumulative 2023-2028 | $975,778 | $91,106 | $197,796 | $147,054 | $132,548 |
(Source: FactSet Research Terminal.)
Tesla’s free cash flow is expected to grow at 30% annually through 2028 and reach $24 billion, the largest car maker on earth.
| Year | FCF Margin | EBITDA Margin | EBIT (Operating) Margin | Net Margin |
| 2022 | 9.3% | 23.5% | 16.8% | 17.3% |
| 2023 | 6.5% | 16.8% | 11.0% | 11.3% |
| 2024 | 8.1% | 18.6% | 13.7% | 12.7% |
| 2025 | 8.8% | 21.0% | 15.5% | 14.1% |
| 2026 | 8.6% | 21.2% | 15.2% | 13.8% |
| 2027 | 10.4% | 20.7% | 16.4% | 13.7% |
| 2028 | 11.6% | 21.2% | 16.2% | 14.5% |
| Annualized Growth 2022-2028 | 12.33% | -1.71% | -0.62% | 5.07% |
(Source: FactSet Research Terminal.)
Tesla’s free cash flow (“FCF”) margin is expected to grow to a very healthy 12% by 2028, levels not seen by traditional automakers.
- Ferrari’s (RACE) FCF margin is currently 12%
- BMW’s (OTCPK:BMWYY) is 8%.
How much further can Tesla grow? Toyota and Volkswagen constantly fight for #1 in global deliveries at around 10 million.
Elon says he wants Tesla capable of 20 million deliveries by 2030.
That’s a stretch goal, and even Elon acknowledges it.
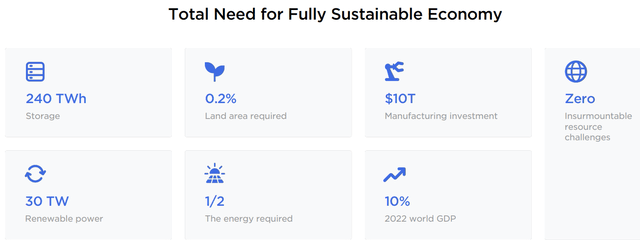
To Get The World To Carbon Neutral By 2050
Currently, China dominates global batteries, much like OPEC once did oil.
Visual Capitalist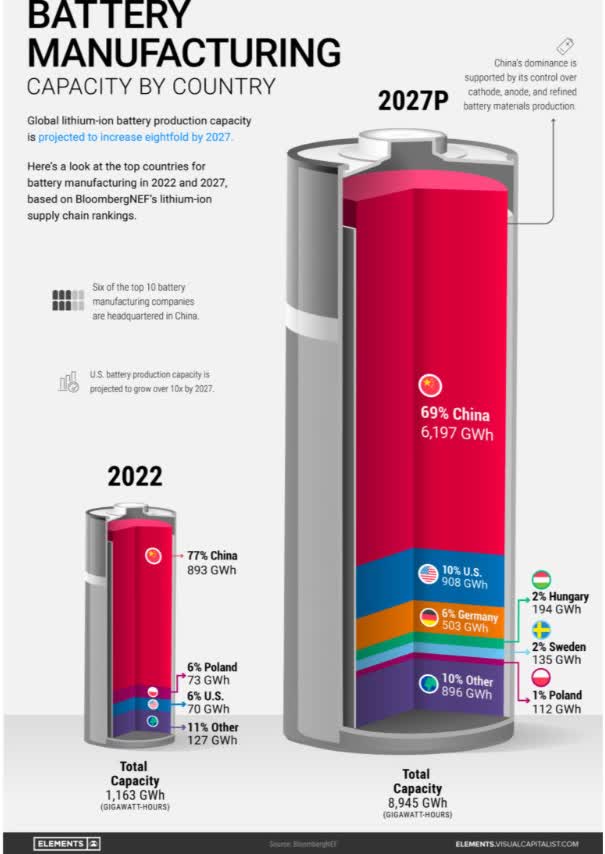
But the good news is that science, engineering, and money can solve every challenge we face.
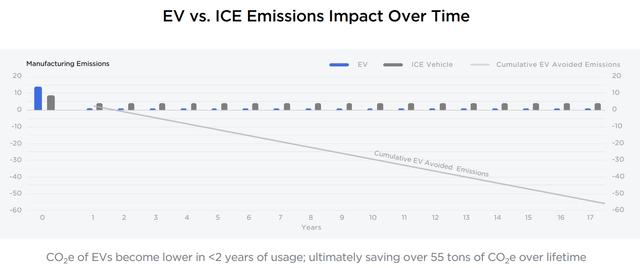
EVs are part of the solution for climate change, but not as big as you might think.
There are 1.5 billion cars in the world.
If you could magically make them all EVs over their lifetime, they would save 83 billion tons of carbon.
In 2022, the world emitted 36.8 billion tons of carbon.
- Oxford estimates that about 20% of target carbon emission reductions can be achieved with 100% global EV adoption.
What Tesla Is Doing To Save The World And Make You Money
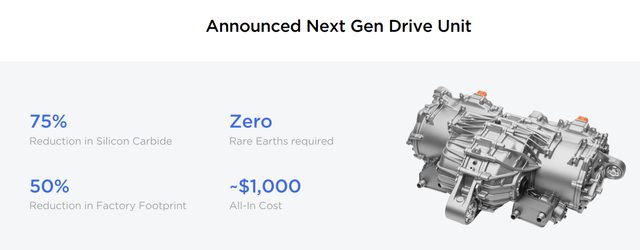
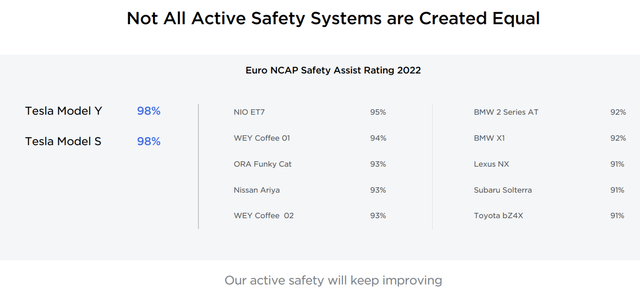
Tesla might not have the biggest R&D budget, but it’s pretty effective at developing new technology that even its rivals sometimes adopt.
Tesla Will Open Its Charging Network to G.M.’s Electric Vehicles
The electric car company, which operates the country’s most extensive charging network, recently struck a similar deal with Ford Motor.” – NYT.
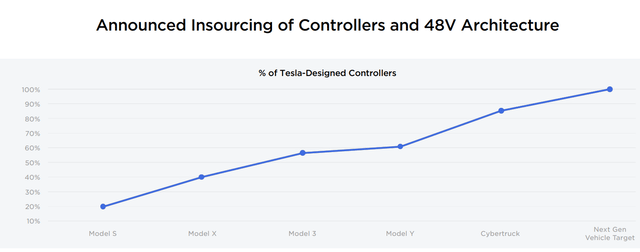
Tesla is pulling an Apple (AAPL) and taking many of its tech needs in-house to control quality and maximize economies of scale while ensuring a reliable supply chain.
So far, Tesla is the only EV maker to turn a profit (the Netflix of EVs).
Whether Lucid Group (LCID) and Rivian, and its other upstart rivals, challenge Tesla for dominance remains to be seen.
- Rivian’s average cost is almost $100,000
- how many EV hummer-sized land yachts does the world need?
What does the world need more of? Electric Volvos!
What’s better than an electric Volvo? An affordable electric Volvo!
And do you know what the world needs more than giant EV land yachts? Large utility-sized battery storage!
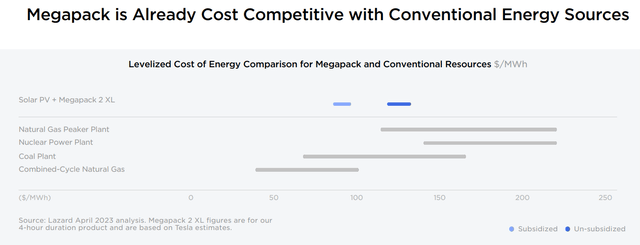
Tesla’s battery storage is already competitive with nuclear and coal and, with subsidies, even natural gas.
How much of a business is battery storage for Tesla?
- $4.3 in sales in 2022
- $32.5 billion in sales in 2027
- 50% annual growth rate
- $8 billion gross income (17% of company total) by 2027.
So battery storage, for now, isn’t a major part of the business, but it looks like it will be.
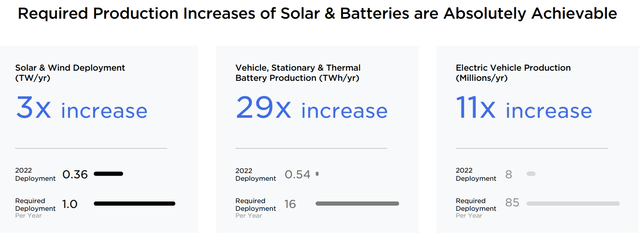
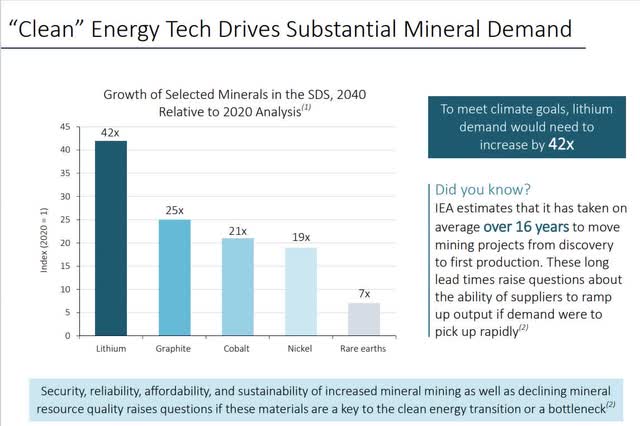
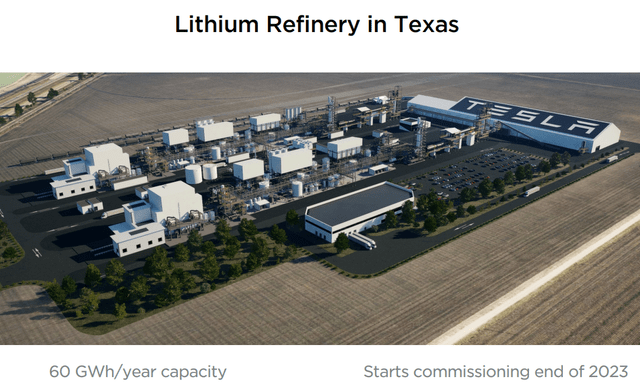
OK, but what about all that Lithium we’ll need for these batteries? We need 29X more batteries and even more lithium!
We need a lot more lithium if Elon will scale Tesla to 20 million annual cars annually by 2030.
Elon is going vertical integration like John Rockefeller.
And like Rockefeller, Musk wants to bring affordability to the masses.
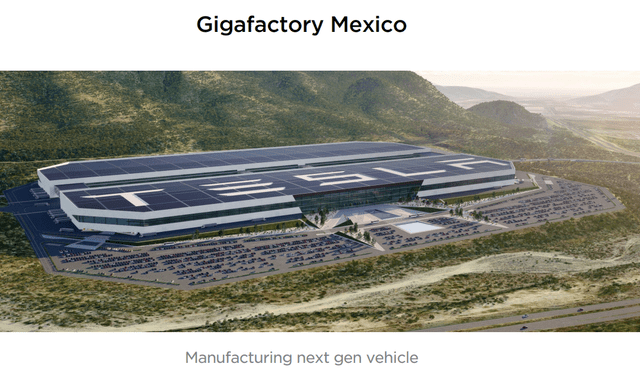
That’s why he’s planning on building the Model 2, a $25,000 car, at a rate “[an] excess of five million units per year” between the sedan and hatchback versions.
Tesla Is A Pretty Reasonable Buy Right Now
- quality: 82% high risk 13/13 speculative blue-chip
- safety rating: 87% (7.5% bankruptcy risk)
- historical fair value: $360.90
- current price: $261.07
- historical discount: 27%
- yield: 0%
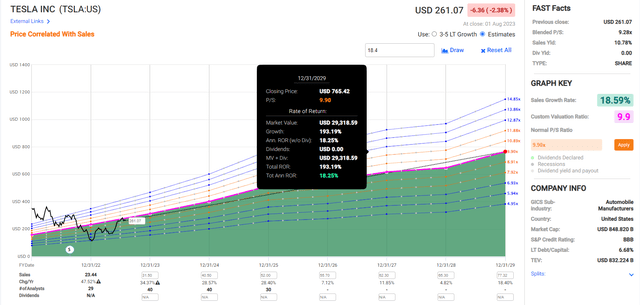
- LT growth consensus: 18.4%
- LT total return potential: 18.4%.
Tesla 2025 Consensus Total Return Potential
Tesla 2029 Consensus Total Return Potential
If Tesla grows as expected and returns to historical fair value, it could almost double by the end of 2025 and roughly triple by the end of 2029.
- about 4X the S&P 500 consensus return potential through 2025.
Earn A 4% Yield On Tesla
Combining hyper-growth with ultra-yield is a great way to maximize income, reduce risk, and maximize returns.
How To Earn 4X More Income Than Pure High-Yield Alone
| Metric | BTI | TRP | TSLA + BTI & TRP |
| Total Dividends | $1,311 | $991 | $4,668 |
| Total Inflation-Adjusted Dividends | $943.17 | $712.95 | $3,358.27 |
| Annualized Income Growth Rate | 9.0% | 8.5% | 42.2% |
| Total Income/Initial Investment % | 1.31 | 0.99 | 4.67 |
| Inflation-Adjusted Income/Initial Investment % | 0.94 | 0.71 | 3.36 |
| Starting Yield | 6.2% | 5.2% | 2.8% |
| Today’s Annual Dividend Return On Your Starting Investment (Yield On Cost) | 17.4% | 13.9% | 192.1% |
| 2023 Inflation-Adjusted Annual Dividend Return On Your Starting Investment (Inflation-Adjusted Yield On Cost) | 12.5% | 10.0% | 138.2% |
(Source: Portfolio Visualizer Premium.)
I’ve already mentioned BTI and TRP as potentially great 8+% yielding Ultra SWANs.
- British American Tobacco: 9.0% yield
- MPLX (MPLX): 0 K1 tax form: 8.7% yield
- Altria (MO): 8.3% yield
- TC Energy: 7.9% yield.
Bottom Line: Tesla Is A Great High-Yield Investment If You Combine It With The Right High-Yield Blue Chips
Do you know what’s sexier than an electric Volvo? A free electric Volvo!
My New Dream Car: The Volvo Of EVs; It’s OK; It’s For My Kids;)
And here are a few more great 8+% yielding blue chips.
| Combo | Yield | Growth |
Total Return Potential (And Approximate Income Growth) |
| TSLA + BTI | 4.5% | 11.5% | 16.0% |
| TSLA + MPLX | 4.4% | 10.2% | 14.6% |
| TSLA + MO | 4.2% | 11.8% | 16.0% |
| TSLA + TRP | 4.0% | 12.70% | 16.7% |
(Source: FactSet Terminal.)
If you invest enough into Tesla and a high-yield Ultra blue chip, Tesla and the other company will pay for your car.
That’s the true American dream, nice things you love and enjoy that are always paid for with other people’s money!
The World’s Richest People Have A Secret
The world’s richest people don’t often sell that much stock. They live off dividends or borrow against the value of their holdings and then deduct the interest from their income taxes.
This is how we should all strive to live, focused on living off income, never principle.
And that’s where Tesla, a dividend-free hypergrowth legend, paired with an Ultra yield blue-chip like BTI, MPLX, MO, or TRP, can help you to maximize your returns and your income and maybe even get a free electric Volvo for your family’s safety, of course;)
Editor’s Note: This article discusses one or more securities that do not trade on a major U.S. exchange. Please be aware of the risks associated with these stocks.
Analyst’s Disclosure: I/we have no stock, option or similar derivative position in any of the companies mentioned, and no plans to initiate any such positions within the next 72 hours. I wrote this article myself, and it expresses my own opinions. I am not receiving compensation for it (other than from Seeking Alpha). I have no business relationship with any company whose stock is mentioned in this article.
Seeking Alpha’s Disclosure: Past performance is no guarantee of future results. No recommendation or advice is being given as to whether any investment is suitable for a particular investor. Any views or opinions expressed above may not reflect those of Seeking Alpha as a whole. Seeking Alpha is not a licensed securities dealer, broker or US investment adviser or investment bank. Our analysts are third party authors that include both professional investors and individual investors who may not be licensed or certified by any institute or regulatory body.
—————————————————————————————-
 Dividend Kings helps you determine the best safe dividend stocks to buy via our Automated Investment Decision Tool, Zen Research Terminal, Daily Blue-Chip Deal Videos, and so much more!
Membership also includes
- Access to our 13 model portfolios
- my $2.5 million family hedge fund
- 50% discount to iREIT (our REIT-focused sister service)
- real-time chatroom support
- numerous valuable investing tools
Click here for a two-week free trial so we can help you achieve better long-term total returns and your financial dreams.

