Summary:
- TGT makes the grade for me within my 30-stock portfolio. WMT does not.
- TGT’s solid combination of yield, valuation, and stability is favored compared to WMT’s excessive valuation and very low dividend yield.
- This article reviews in detail the metrics (proprietary and otherwise) I use for all YARP stock analysis.

J Studios
Earnings season has been a blast, eh? I’m just kidding. It is my least favorite season. And I have to deal with it four times every year. It’s not that I don’t want to hear from the companies whose stocks I own. But I recall a time, a couple of decades ago, when quarterly earnings were more of a polite, measured assessment of a company’s long-term progress. Now, they are an event, with financial TV counting down the seconds until announcements from certain high-profile stocks.
This gamification of earnings reports simply adds a lot of wasted emotion to the long-term investing process. Because the more interest in the stock market increases, the more that all companies end up in the crosshairs of “investors” who really are speculators, given the number of double-digit percentage price changes I see every quarter, even after reports from very staid businesses.
The whole expectations game by brokerage analysts just feeds the frenzy. But frankly, it is no one’s fault. It is the market doing what it does in this age of 24/7 information, social media influences and the willingness of the market at large to reward stocks that were supposed to earn $5 a share, see estimates drop to $4 a share, come in at $4.02 a share and see the stock rally. Or the opposite, simply because someone saw something they didn’t like, and can move the stock.
This is a fact of modern investment markets, so I’ll stop the complaining there. Because a while back, I devised a way to battle back against the silliness. Not of earnings, but of the real impact on our wealth when a stock “bombs” earnings, even if the report is solid.
To demonstrate that earnings sensitivity factor I’ve developed as part of my broader Yield At a Reasonable Price (YARP) approach to selecting and managing my stock portfolio, I’ll compare two of the biggest traditional retailers, who compete head-to-head and who are announcing earnings for the latest quarter on consecutive days next week. Walmart (NYSE:WMT) goes on Tuesday, November 19 and Target (NYSE:TGT) on Wednesday, November 20. Both report prior to the market open, which is probably a relief to anyone who prefers not to dissect those reports at the same time as Nvidia (NVDA) reports after the close on 11/20.
My conclusion is that Target is the better choice currently, but that comes with an explanation. I am viewing these two giants through the lens of the process I created and honed over decades, which seeks first to identify solid, profitable businesses (about 50 on my watchlist) and own about 30 of them at any point in time. Importantly, once a stock makes the cut, I put a specific set of rules around it, such as forcing myself to hold at least a 1% position, and not owning (at cost) more than a 5% weighting in any stock.
My Yield At a Reasonable Price (YARP) approach is partly about finding profitable names I judge have low “blowup risk” while I own them, and part of exploiting what I see as a reality of modern markets: stocks just don’t sit still. Their prices fluctuate more than before, and they are more prone to going on “runs” up and down which might last weeks or a few months, only to see the stock give back too much of it for my taste.
This prompts my slogan, “I own stocks, but I also rent them.” In fact, every stock position has elements of both. It is not uncommon for me have a stock I have held for years, but have owned at 1%, 5% and in between at different points in that holding period. So a stock might average being a 2.5% holding over a period of years, as an example. That’s the context with which to understand the comparison of TGT and WMT I’ll dive into now.
Walmart: YARP analysis summary
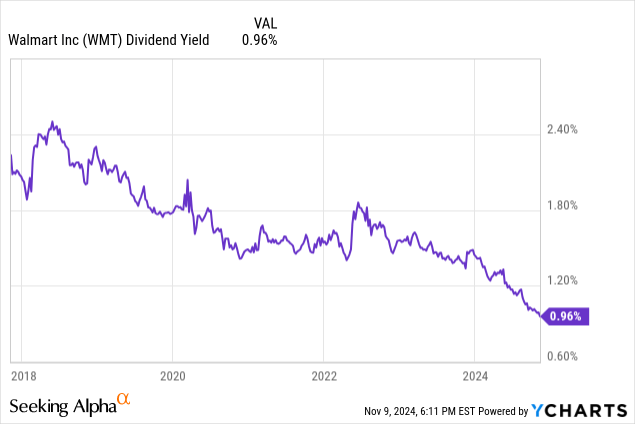
I’ll steal some of my own thunder and say that this contest was over practically before it started. I would love to own WMT, but if I did, it could not be via the YARP approach. The dividend yield is both too small and wildly overvalued on a long-term basis. As I do with all stocks I analyze, here’s a 7-year dividend yield history. Where is WMT on that spectrum? At the very bottom. Under 1% yield, which is as low as it has been over that time.
That’s naturally due to its strong price appreciation. So while I might be holding it if I bought it a while back, it is no longer a new buy candidate. If I did choose to try to get access to it, it would be outside of my YARP dividend account, perhaps in a sector or industry ETF that has it among the larger holdings. The stock is a member of the Dow Jones Industrial Average, but it is not a big enough holding there to have an ETF like DIA act as a surrogate for owning Walmart.
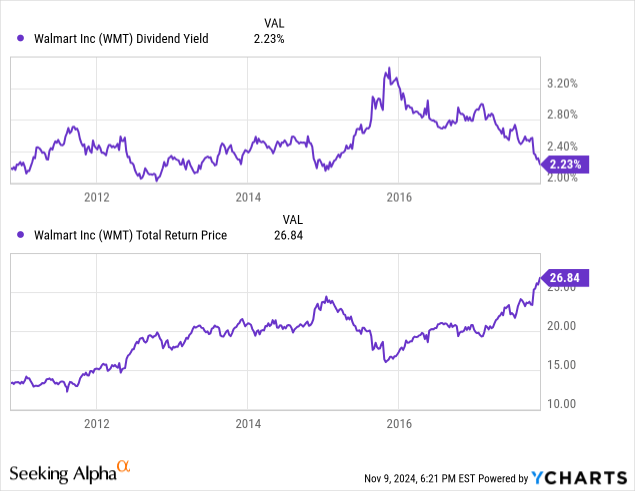
We can see pretty clearly from this chart below that the ideal time to zero in on WMT was back in 2016. Its yield was steadily coming off a long-term high watermark at that point, and the stock could have been had at nearly a 3% yield. The stock has nearly quadrupled since that point, along with the rest of the big cap space. This helps us understand just how far into this market cycle we are.
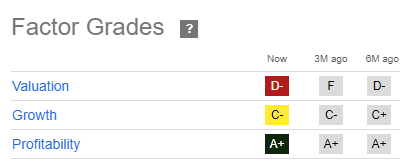
These are the Seeking Alpha factor grades I key in on, with profitability being the dominant one. Of course, I want companies that grow and are fairly valued. However, since I rotate my position sizes up and down more frequently than “traditional” buy and hold types, those longer-term evaluations of a stock’s attractiveness are not nearly as critical to me. Sort of like debating how much fire insurance you should carry in the coming years when your house is on fire right now.
And when I look at these grades for WMT, I can check the profitability box. That’s no big surprise, given how well-managed and well-positioned this revolutionary retail staple business is. WMT is a great business, but not a great stock right now. That it is slightly more attractively valued (D- versus F a few months ago) is of no significance to me.
Seeking Alpha
Dividend safety was the “death knell” for my potential consideration of WMT for now. I am friendly to Dow 30 stocks, but not when the dividend safety grade is B-. I prefer a grade of B or better in this measurement. I do track some stocks with that level of safety or lower, and I use other sources as well as Seeking Alpha’s system to assess the possibility that a dividend is vulnerable to cut or elimination. But again, this is a long-term issue in most cases, and the stock price typically signals that there’s a problem maintaining the dividend payout.
This is another reason why the “anchor tenant” in my toolbox of investment strategy is technical analysis. Stocks that have become dividend “issuers” don’t keep rising in price unabated. Price is a signal for a lot of things, from speculative appetite from market participants to worrying about a threat to the dividend or the overall business’s competitiveness. The market usually sniffs it out. That’s why I always say:
“The market tells us a story, we just need to listen.”

Seeking Alpha
WMT’s dividend yield within its sector (all SA factor grades are judged within the stock’s sector, not the broader market) is putrid. We know that from its 0.98% yield as I write this. So while this is an iconic company that will survive as far as the investor’s eye can see, it is not at all on my yield at a reasonable price radar. WMT has very little yield, and it is not priced reasonably at all.
Walmart’s best hope: continued “animal spirits”
Importantly, that does not mean it cannot continue to rise in price indefinitely. Expensive as it is on all of the measures I care about, animal spirits are an ever-present wildcard. That’s why I think of stock investing like this: any stock can go up in value at any time, for any reason. The difference between any investment and any other investment is how much major risk of loss is attached.
I conclude that this “reward/risk trade-off” is far better for TGT than WMT. So I’ll stop dissing the latter and move on to the former!
Target: YARP analysis summary
Since I not only follow TGT on my 50-stock watchlist for potential inclusion in the Sungarden YARP Portfolio‘s stock section, it is also one of the 30 stocks I own, I’ll expand from the set of analytics I used for WMT, and take my TGT case straight from the stock research deck I share live and provide 24/7 access to for subscribers of the new Seeking Alpha investing group I lead.
In addition to the trademarked Yield At a Reasonable Price (YARP) approach, my intellectual property extends to a set of ratings I created and track. They flow into one of two bottom-line scores. “Fitness” is the degree to which a stock fits the characteristics I want in my 30-stock basket at any time. I take the Seeking Alpha quant factor grades I have the most confidence in, weight them myself, and produce that score, which ranges from 5 to 0, with 5 being the best fit.
A score of more than 3 is typically what I seek, but with so many stocks overvalued and many others not growing as well as the mega cap leaders are, Fitness Scores above 3 are not as common as they would be in a depressed stock market.
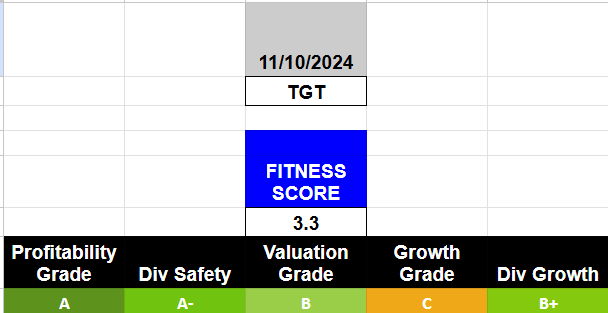
Target’s Fitness Score is 3.3, which currently ranks in the top 15% of my watchlist universe. That does not guarantee a spot in the 30-stock portfolio, but it challenges me to have a very strong case for it to be excluded. Remember, numbers tell us a lot of the story, sometimes all we need to know. But there are plenty of situations where they don’t, and my job as the group leader is to be the one constantly challenging my own assumptions. That’s been the key to my own investment survival, first running “other people’s money” for 30 years, then more recently providing research to DIY investors since I sold my investment firm in 2020.
Sungarden Investment Publishing
Quickly reviewing the sub-scores that are the ingredients Seeking Alpha provides me to do my own thing, profitability is solid at an A grade, and dividend safety checks in at a nice A-. Valuation is reasonable, even excellent when I consider that many stocks rate in the C or D range. So a valuation grade of B just adds to the attractiveness in what, I believe, is an overvalued stock market at the margin.
The growth grade is at least average at a C, and dividend growth, while less of a priority for me than safety, is also superior to most stocks. So add it all up, and TGT currently fits the bill for me.
Now that I’ve made the case to myself that TGT should “hit the board” and be at least a 1% position in the Sungarden YARP Portfolio, let’s see if I can justify it being more than that. Remember, 1% to 5% at cost is my self-limited range.
Below is the “guts” of the decision process. And while one day I might be convinced to “fire” myself and let my own systematic approach make the calls for me, I know better than to go “all in” in markets like this. Perhaps there’s a case for aggressive investors to drop the human judgement and experience component. But when it comes to risk management and with my personal semi-retirement portfolio on the line, I am happy to use these investing aids to power the process I’ve been evolving since the 1990s.
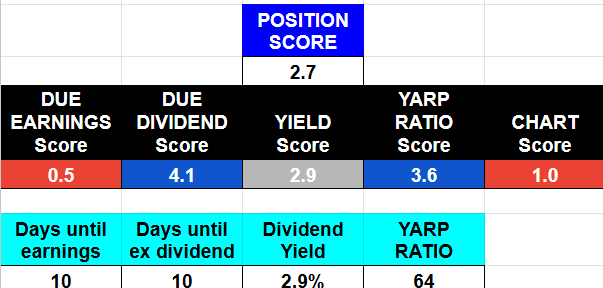
Target has earnings coming up in about a week. That’s bad news for my process. It results in “demerits” and that’s why the sub-score of DUE (days until earnings) is very low and gets a red highlight in my research deck. Maybe earnings will spike TGT’s stock price. But maybe the market will take it to the woodshed. My take: I’ll typically keep a 1-2% position into earnings, maybe 3% at most. But not 4% or 5%. I’ve seen too many earnings “bombs,” even when the company is doing just fine. I led this article off with a statement about earnings being my least favorite season. I mean it! I never believe I’m smarter than the market when it comes to what the earnings will be, and more importantly, what the reaction will be to them.
TGT is a very quirky and rare example in one respect. This quarter, it announces earnings and goes ex-dividend on the same date, November 20. I rarely see that. Usually, there’s a 3-4 week gap between them. That allows me to stay “light” position-wise through earnings and then load up between that report and the ex-date. Not possible here. So they essentially cancel each other out.
Seeking Alpha
TGT’s dividend yield is a shade under 3%, not bad for a stock in a sector other than Utilities or REITs. As noted earlier, the dividend appears solid. In addition, my YARP Ratio is at 64, which means that the stock is in the 64th percentile of its past 7-year dividend yield range. That’s not optimal, but certainly above average in terms of “yield at a reasonable price” using just that single metric. So it is also automatically coded in blue. My color scale for all of this is, from best to worst, green-blue-grey-yellow-red.
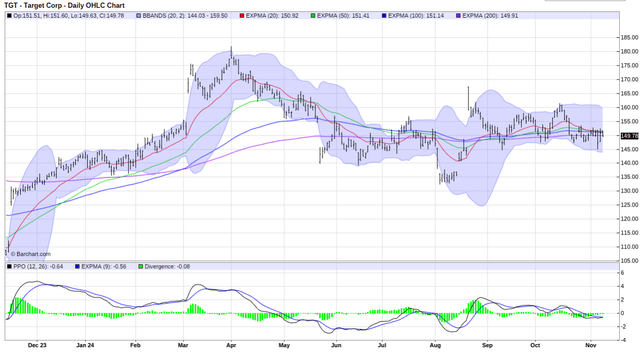
Finally, since I don’t go anywhere without a technical chart assessment, here’s that. The research sheet has an automated analysis I created using third-party data and making it my own, similar to what I did with the Fitness Score. But I still don’t make a move without eyeballing the chart. So here it is, with my take below.
Barchart
I could show you the weekly instead of the daily as I did above, but the result is the same: nothing interesting. Nothing bad, either. Very flat and neutral.
So I conclude from all of this exactly what you probably surmised by reading to this point. I like Target’s stock enough to have it in the portfolio. But it’s a lower-end position until something causes its attractiveness within my system, both individually and relative to other stocks, as well as income and growth ETF holdings I have, improves. Maybe that’s post-earnings, we’ll see. But I’m satisfied with where I am on TGT.
Perspective on analyzing stocks in modern markets
So TGT is a yes for me, and is currently in my portfolio, albeit at a low weighting for now. Let’s see what things look like as the next ex-dividend date approaches, and more significantly, if the stock and market continue to bust to higher levels. WMT is a no, likely until its price more than halves, given that paltry sub-1% dividend yield.
There’s not a world of difference between a 1% position and a 0% position. Or is there? I have 3 tiers, if you will.
1. Not in portfolio.
2. In portfolio, small size.
But I’m constantly looking at those 1%-ers to see if they should be lifted. I don’t do that as actively with stocks outside the Sungarden YARP portfolio.
3. In portfolio larger size (which is always an ongoing decision process for me).
A 1% position can drop 10%, and it is the same impact as a 10% position dropping 1%. Think about that as a way to “invest” without clinging so much to “stock picks.” Process and position size add a whole new dimension to what many self-directed investors are able to do. But Wall Street tends not to focus on that. So I will.
Analyst’s Disclosure: I/we have a beneficial long position in the shares of TGT either through stock ownership, options, or other derivatives. I wrote this article myself, and it expresses my own opinions. I am not receiving compensation for it (other than from Seeking Alpha). I have no business relationship with any company whose stock is mentioned in this article.
Seeking Alpha’s Disclosure: Past performance is no guarantee of future results. No recommendation or advice is being given as to whether any investment is suitable for a particular investor. Any views or opinions expressed above may not reflect those of Seeking Alpha as a whole. Seeking Alpha is not a licensed securities dealer, broker or US investment adviser or investment bank. Our analysts are third party authors that include both professional investors and individual investors who may not be licensed or certified by any institute or regulatory body.
By Rob Isbitts and Sungarden Investment Publishing
A community dedicated to navigating modern markets with consistency, discipline and humility
Full Access $1,500/year
Legacy pricing of $975 for first 35 subscribers, a savings of 35%
-
Direct access to Rob and his live YARP portfolio, featuring a trademarked stock selection process he developed as a private portfolio and fund manager, and his decades of technical analysis experience.
-
24/7 access to Sungarden’s investment research deck
-
Bottom-line analysis of stocks, ETFs, and option strategies
-
Trade alerts and rationale, delivered in real-time
-
Proprietary educational content
-
You won’t get: sales pitches, outlandish claims, greed-driven speculation

