Summary:
- Wall Street investors are questioning if the AI stock market craze is close to a major correction, particularly with Nvidia’s soaring market capitalization.
- Technical indicators suggest Nvidia may be facing a significant pullback in the second half of 2024, similar to patterns experienced by other tech stocks over the years.
- Booms do turn to bust. That’s the way nature and stock market speculation work. Nvidia’s valuation looks to be unsustainable.
RapidEye/iStock via Getty Images
What if the AI craze in the stock market is ending? What if the standout winner for this boom phase has topped and is ready to fall back to earth? These are the questions Wall Street titans to small retail investors ask themselves daily.
With NVIDIA (NASDAQ:NVDA) reaching an unheard of equity market capitalization above $3.3 trillion in June, in the highly competitive and extremely cyclical semiconductor business, the idea of “risk” should not be lost on investors. I remain quite sure, one day Nvidia will fall from grace, and come crashing back to earth. The stock’s valuation will act like the Greek tragedy lesson of Icarus, where flying too high toward the sun does have consequences.
Anyway, I have written on Nvidia’s boom valuation and psychology several times since last summer, and the share quote keeps rising ever higher, with nothing but air now underpinning shares (hopes of instant AI riches actually). My last mention was an article in June here on the short Nvidia proposition for IRAs and 401-Ks, few investors know about. The Graniteshares 2x Short NVDA Daily ETF (NVD) is a simple way to hedge possible downside in any AI bust.
Well, the day of reckoning I have cautioned was approaching could be close at hand. After a year and a half of amazing and regular technical strength, with ultra-bullish momentum indications generally confirming the trend, the most serious cracks in the bull run since late 2022 have started to appear.
And, if price and buying momentum does not pick up next week, a very large correction or even crash in price could be late 2024’s reality. Why do I say such things?
Technical Chart Breaking Down?
I want to go through and explain three charts of Nvidia’s current trading action. The first is a standard Renko creation. Renko charts track the volume it takes to move price a set amount, with time values less meaningful. The one drawback is this chart can look different drawn a few months before or after a big move (either up or down), as the box sizes depend on prices outlined over the whole period graphed.
But, from today’s perspective, we can see the selloff since late June (black boxes) has been the most consequential for raw price change since the massive rally began in October 2022. The open question is, will this selloff continue?
StockCharts.com – NVIDIA, Basic Renko Chart, Since October 2022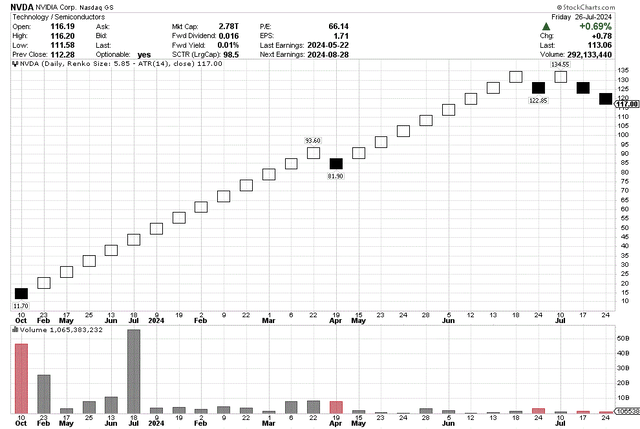
More evidence of trouble exists in the popular momentum indicators and calculations I like to track. I would say the outstanding momentum trend, using a combination of strength in the Accumulation/Distribution Line, Negative Volume Index, and On Balance Volume, over the eight months between last October and June, was one of the strongest runs for a mega-cap blue chip since Apple (AAPL) or Tesla (TSLA) in late 2020 and early 2021.
Yet, the ADL, NVI, and OBV indicators have been rolling over since peaking in the middle of June. For reference, the last time all three were trading below their 50-day moving averages was September 2024, marked with a blue arrow below (on a 12-month chart of daily price and volume changes). Such a reversal could become reality this week or next.
StockCharts.com – NVIDIA, 12 Months of Daily Price & Volume Changes, Author Reference Point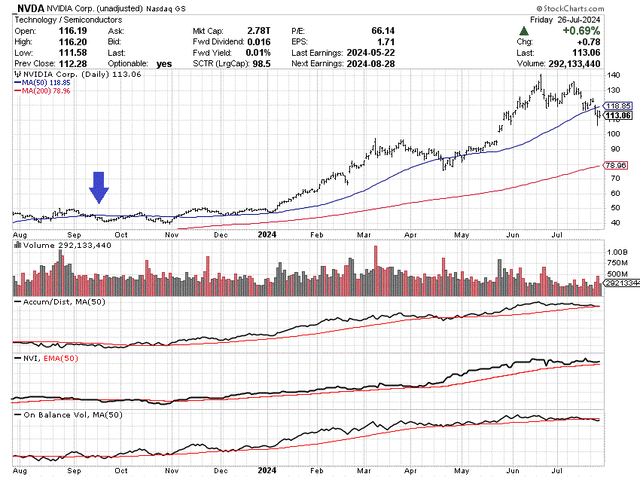
Perhaps most worrisome for Nvidia bulls is the imbalance of selling in July, parked alongside a rare absence of buyers is highlighted in the materially negative 20-day Chaikin Money Flow, 14-day Ease of Movement, and 13-day Force Index numbers.
The last time all three of these indicators were negative was right at the April bottom, just before the latest earnings release and 10:1 stock split announcement. What I am saying is – if you are bullish and long Nvidia, you have to be hoping for another round of good news to reverse price out of its slump.
However, the shockingly bad, flashing red indicator of the day is the Ease of Movement calculation (circled in gold below). Basically, price has declined -20% over two weeks on exceptionally light volume, the weakest trading volume since October 2021 (days before Nvidia’s previous major peak in price). Where have all the buyers gone? Stock market crashes involve either horrible operating news, or a situation where buyers go on strike. The plunging EMV readout is buying interest has been completely exhausted, and peak altitude for the share quote may have been reached in June. Now Icarus will proceed to crash into the ground?
StockCharts.com – NVIDIA, 12 Months of Daily Price & Volume Changes, Author Reference Point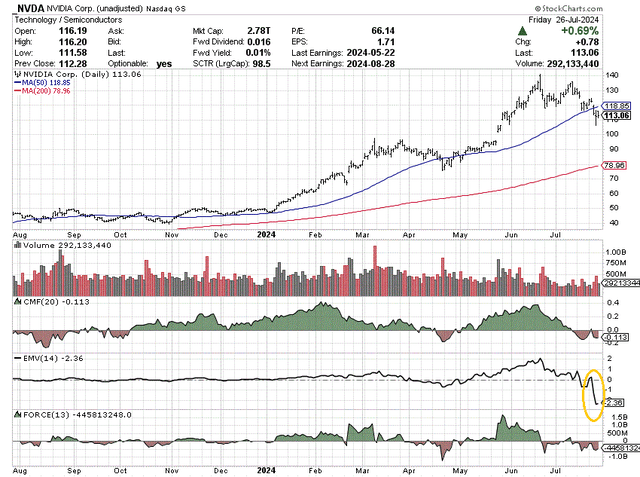
Don’t believe me? The last boom peak for Nvidia in late 2021 witnessed the same breakdown in the EMV indicator to all-time lows (at that time). On the chart below, you can easily see the EMV pattern parallels to July 2024 in the bearish selloffs of December 2021 and January 2022 (circled in gold). To summarize – a vacuum of buyers right after an unusual spike in the share quote is very problematic for price months down the road.
StockCharts.com – NVIDIA, Daily Price & Volume Changes, July 2021-October 2022, Author Reference Points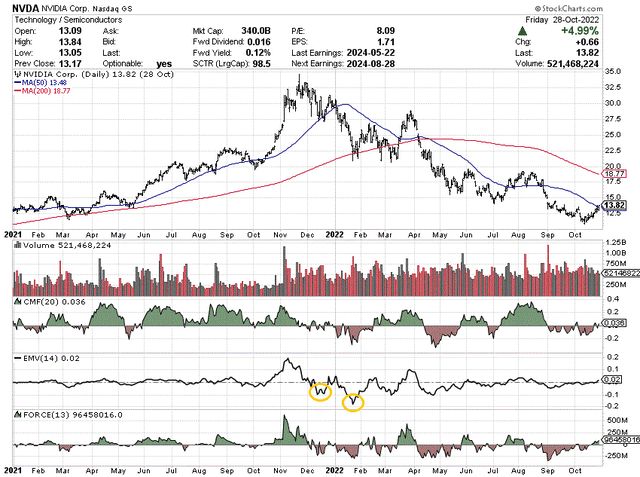
The “cannot miss” AI investment psychology of today is not new or novel. Three years ago, overenthusiasm created by a shortage of high-end gaming chips during the pandemic, alongside extra demand from the surge in crypto-mining usage was the “unique” Nvidia-product story you had to own.
Well, that move eventually turned to bust, as regular semiconductor supply/demand forces rebalanced, slashing company income levels for several quarters (on reduced demand, inventory adjustments, and lower chip pricing). Nvidia’s stock proceeded to fall from $34 to $11 (split-adjusted), generating a -70% loss for those unfortunate to buy near the November 2021 top. Is history about to repeat?
Final Thoughts
The wickedly bearish Ease of Movement drop over the last week for Nvidia is similar to drops in this indicator for Advanced Micro Devices (AMD) and Meta Platforms (META) since the spring, which I have highlighted in articles here-AMD and here-META. It’s kind of the godfather “kiss of death” blueprint in other topping chart patterns found in my research over the years.
The valuation setup backing each share is an “F” grade from Seeking Alpha’s Quant sorting tool, comparing different fundamental analysis metrics to Nvidia’s past 5-year trading history and current readings by peers and competitors.
Seeking Alpha Table – NVIDIA, Quant Valuation Grade, July 26th, 2024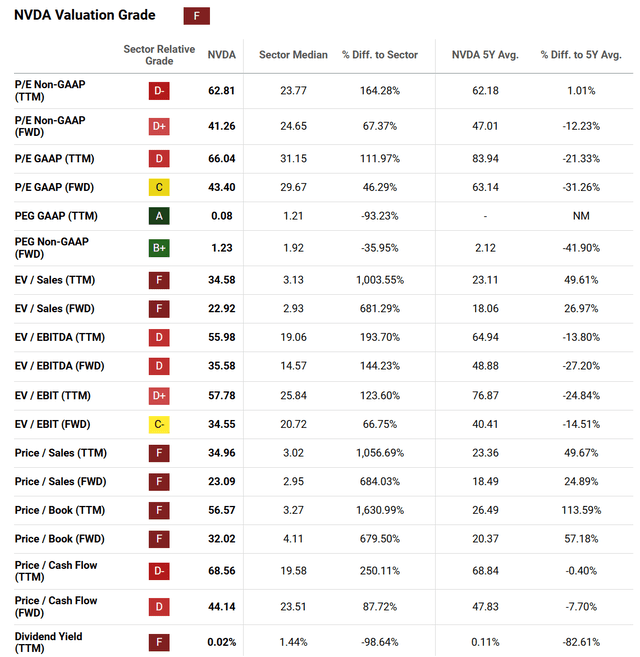
Plus, if earnings and profit margins are peaking in 2024, an adjusted score in 12 months looking back to today might be an “F-” grade! With competition for AI chip inventions mushrooming on a weekly basis from every corner of the semiconductor world, Nvidia could absolutely experience nice sales growth years into the future, but also a collapse in profitability levels.
YCharts – NVIDIA, Final After-Tax Profit Margin, Since 2000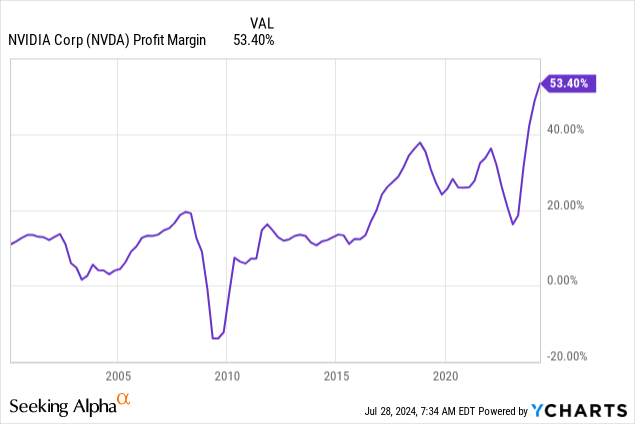
That’s how competition and the profit incentive work in capitalism. I warned Tesla investors two years ago about how competition would eventually drive its stock lower, as predictable economic forces played out. Nvidia will face the same issues over time.
Another negative is CEO Jensen Huang has decided to cut and run, selling shares almost daily in July. Sure, the number of shares sold vs. what he owns is relatively minor. Nevertheless, he seems to be quite happy cashing in share prices above $110.
Nasdaq.com – NVIDIA, Insider Trading Activity, Middle of July 2024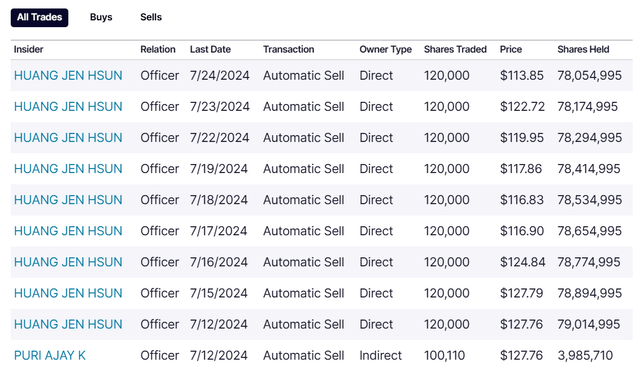
My conclusion is Nvidia bulls desperately need oversized buying volumes to show up in coming trading days, or the rout could move into overdrive. Large corrections and crashes involve emotional trading, where many long investors give up at the same moment. Eventually, we could experience this phenomenon at Nvidia. The only real question is when, in my opinion. Remember all booms turn to bust – you cannot escape it.
Thanks for reading. Please consider this article a first step in your due diligence process. Consulting with a registered and experienced investment advisor is recommended before making any trade.
Analyst’s Disclosure: I/we have a beneficial short position in the shares of NVDA either through stock ownership, options, or other derivatives. I wrote this article myself, and it expresses my own opinions. I am not receiving compensation for it (other than from Seeking Alpha). I have no business relationship with any company whose stock is mentioned in this article.
I am long NVD as a short trade on NVDA.
This writing is for educational and informational purposes only. All opinions expressed herein are not investment recommendations and are not meant to be relied upon in investment decisions. The author is not acting in an investment advisor capacity and is not a registered investment advisor. The author recommends investors consult a qualified investment advisor before making any trade. Any projections, market outlooks, or estimates herein are forward-looking statements based upon certain assumptions that should not be construed as indicative of actual events that will occur. This article is not an investment research report, but an opinion written at a point in time. The author's opinions expressed herein address only a small cross-section of data related to an investment in securities mentioned. Any analysis presented is based on incomplete information and is limited in scope and accuracy. The information and data in this article are obtained from sources believed to be reliable, but their accuracy and completeness are not guaranteed. The author expressly disclaims all liability for errors and omissions in the service and for the use or interpretation by others of information contained herein. Any and all opinions, estimates, and conclusions are based on the author's best judgment at the time of publication and are subject to change without notice. The author undertakes no obligation to correct, update or revise the information in this document or to otherwise provide any additional materials. Past performance is no guarantee of future returns.
Seeking Alpha’s Disclosure: Past performance is no guarantee of future results. No recommendation or advice is being given as to whether any investment is suitable for a particular investor. Any views or opinions expressed above may not reflect those of Seeking Alpha as a whole. Seeking Alpha is not a licensed securities dealer, broker or US investment adviser or investment bank. Our analysts are third party authors that include both professional investors and individual investors who may not be licensed or certified by any institute or regulatory body.
