
Summary:
- Long-term investors who buy great companies at fair to great prices never have to worry about bubbles.
- Those who overpay and momentum chase are speculating they won’t be caught without a bathing suit when the tide goes out.
- Nvidia Corporation has a 95% market share in $10,000 AI Superchips and is up 100% YTD. Momentum chasers are gambling that “there is no price too high” for this hyper-growth Ultra.
- Nvidia is trading at 66X earnings, twice its historical market-determined fair value. It’s priced for 45% long-term growth. 22% is actually expected. Nvidia is 72% overvalued, making the S&P in March 2000 look cheap by comparison.
- Nvidia is twice as volatile as the stock market, and its average bear market is a 54% crash; its median bear market is a 58% collapse. With an average recession potentially going to cause Nvidia to miss earnings for the first time in 3.5 years, it’s time for speculators to take profits before the music stops. Nvidia’s 6-year return potential is 130%, but this article shows you the prices at which Nvidia’s 6-year return potential becomes 300% to 500%.
LumerB
This article was published on Dividend Kings on Tuesday, May 16th.
—————————————————————————————
Fair value is the price at which you can buy a company and fully participate in its future growth.
There is no more fundamental or important concept for long-term investors.
Ritholtz Wealth Management 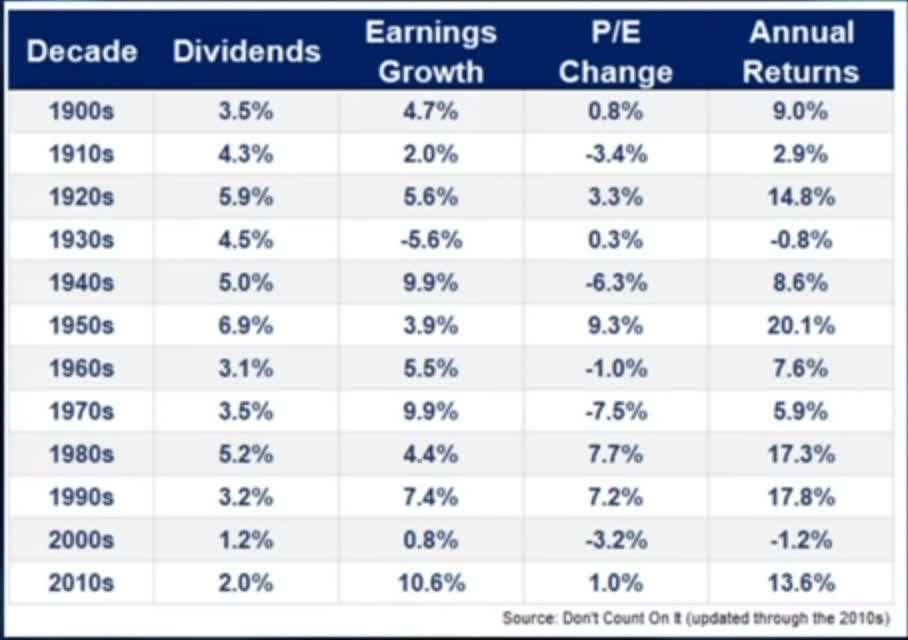
Three things and three things alone determine 97% of long-term returns. Yield, growth, and valuation changes.
I value a company based on its historical market-determined fair value.
Why? Because that’s what Ben Graham said to do at the end of his career when changes in accounting and the economy made traditional book value valuation inappropriate for many companies.
And why let the market decide a company’s intrinsic value? Because as Graham famously said in the long-term, the market is a “voting machine” that correctly “weighs the substance of a company.”
FAST Graphs, FactSet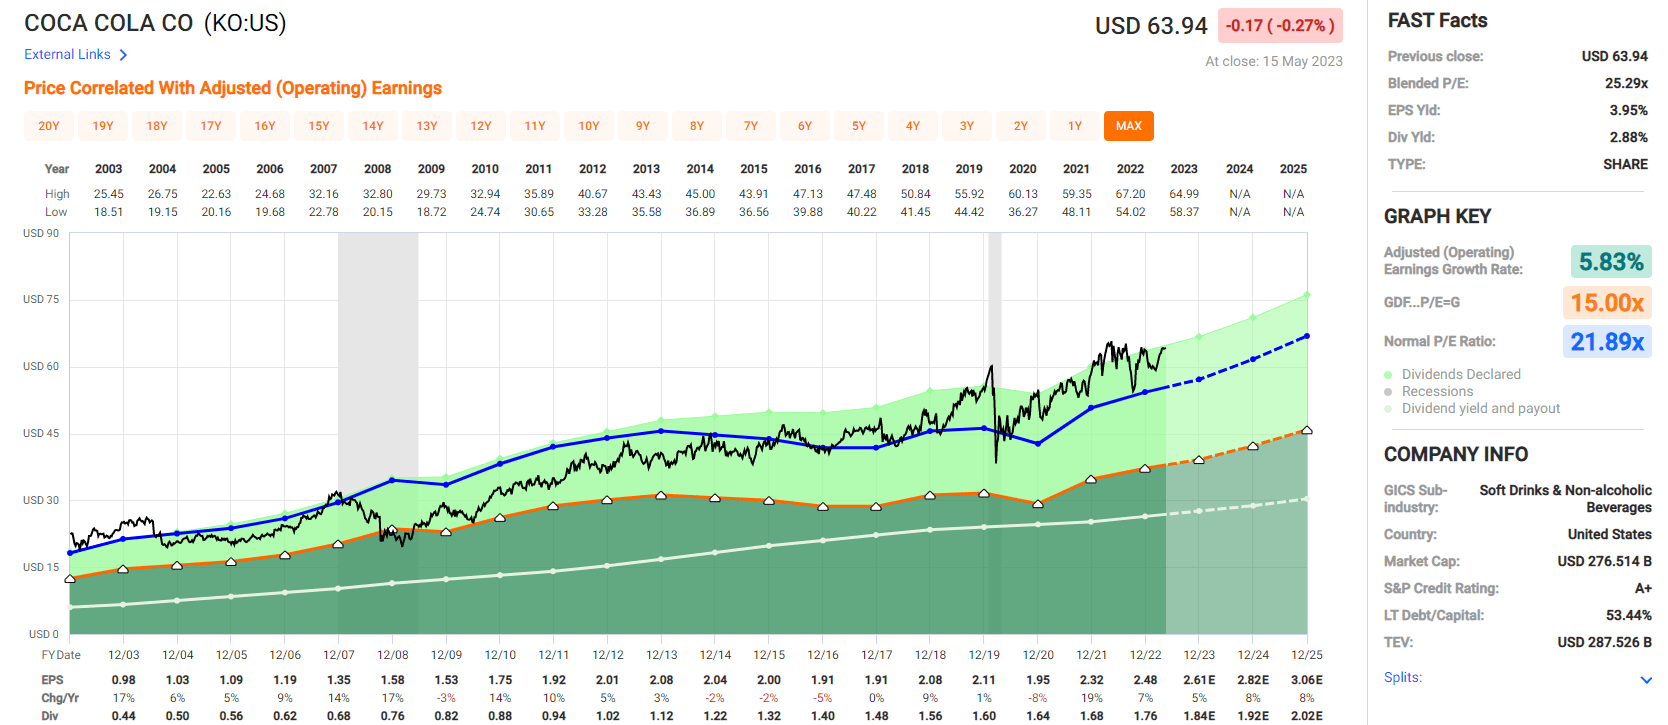
What is The Coca-Cola Company’s (KO) brand, moat, management quality, dividend-friendly corporate culture and 60-year dividend growth streak, and 103-year overall dividend track record worth? About 22X earnings.
If you pay 22X earnings for Coke, then there is a 91% to 97% chance that in 30 years, your total returns will have equaled yield + the growth rate over that time.
Why? Because over 20 years, billions of global investors have cumulatively bought and sold Coke, and despite bear markets and bubbles that ran for years, it ultimately keeps coming back to about 22 times earnings.
This is the basics of sound fundamental value investing. Buffett’s “wonderful companies at fair prices.”
Brand, moat, management, dividend safety, cash flow stability, risk management, the risk profile, the good, bad, and ugly, all weighed by every investor together, providing a reasonable estimate for long-term intrinsic value.
The Dangers Of Overpaying For Even God’s Own Company
During the tech bubble, the S&P 500 (SP500) hit a forward P/E of 25, 50% historically overvalued. And there were stocks trading at even more absurd valuations.
Michael Batnick 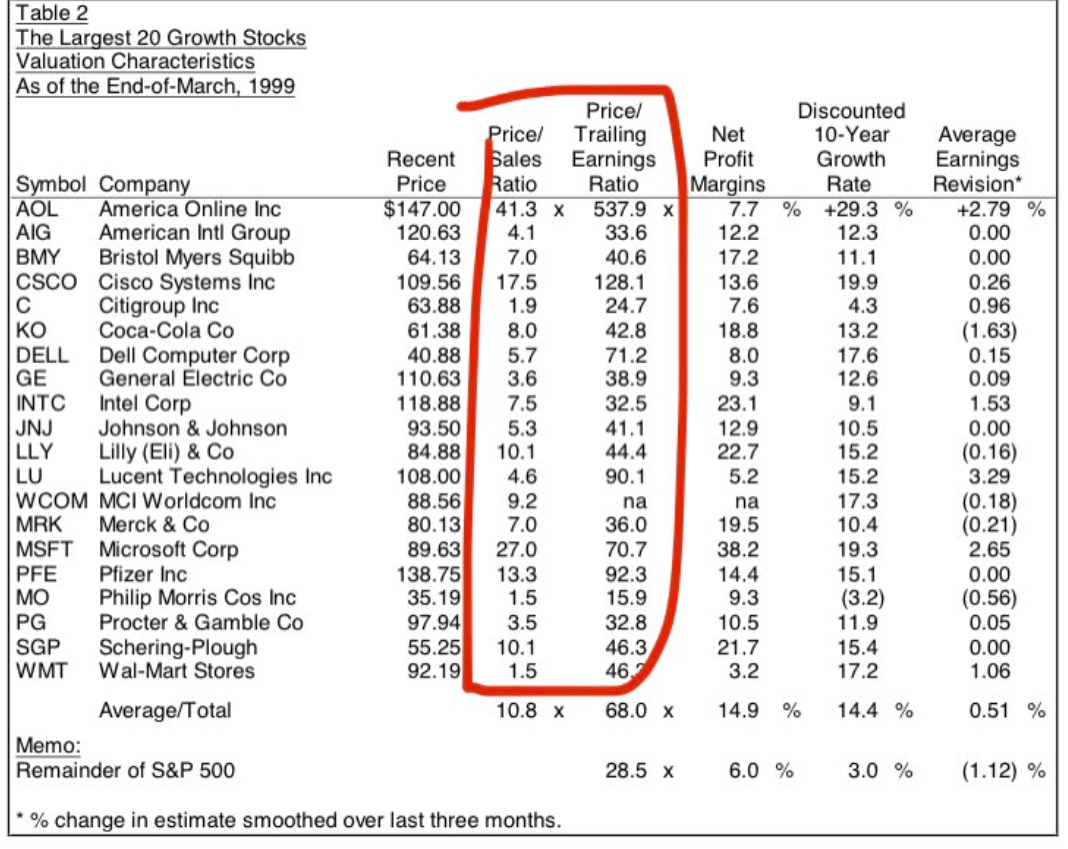
46X for Walmart Inc. (WMT), and 92X for Pfizer Inc. (PFE)? I get why the tech mania caused Cisco Systems (CSCO) to trade at 128X, but retail and pharma? Or how about Coke? What was the peak P/E of Coke in the most extreme stock market bubble in U.S. history?
YCharts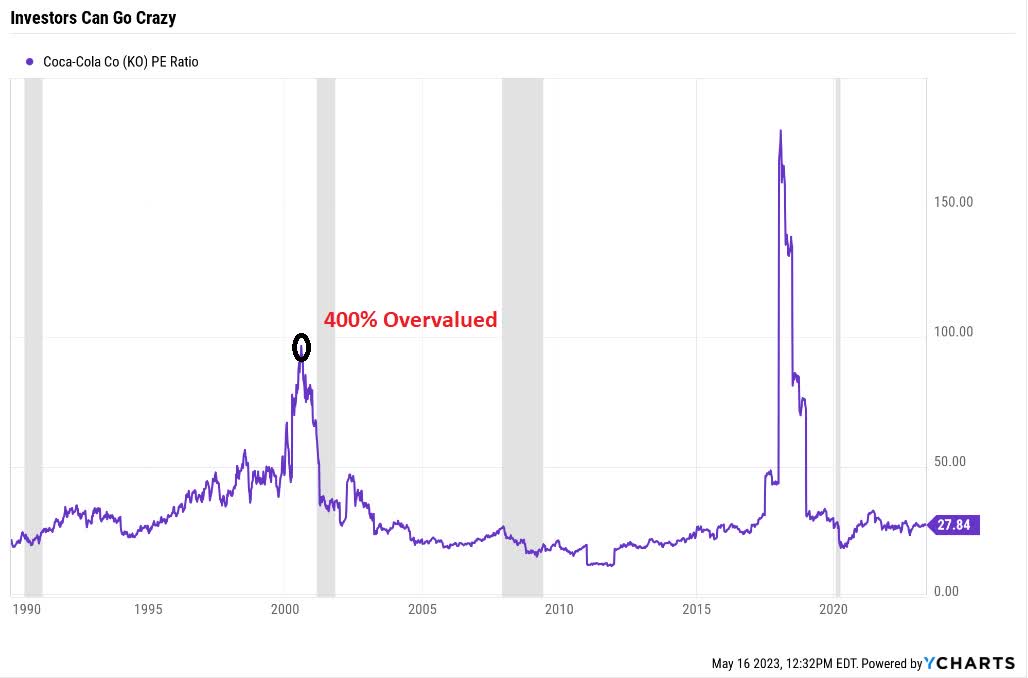
How about almost 100X earnings, a 400% historical premium?
Coke’s Peak Declines Since 1985
Portfolio Visualizer Premium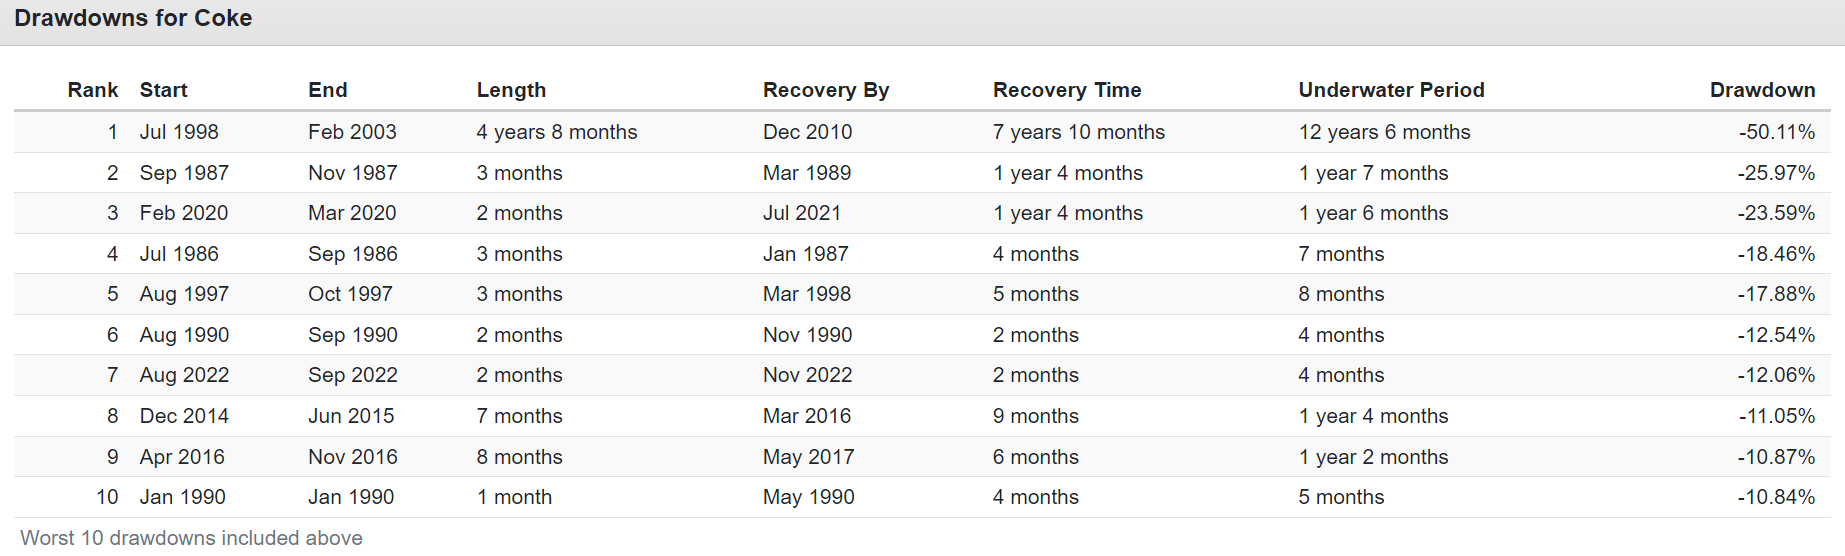
Could you have ever imagined someone buying Coke and then not making a penny in profit for 12.5 years? When you pay almost 100X earnings for a company that historically grows 5% and never faster than 13%, it’s no surprise that Coke was cruising for a bruising in 2000.
And of course, a lot of the tech bubble’s biggest darlings did even worse.
Walmart’s Lost 12 Years
Portfolio Visualizer Premium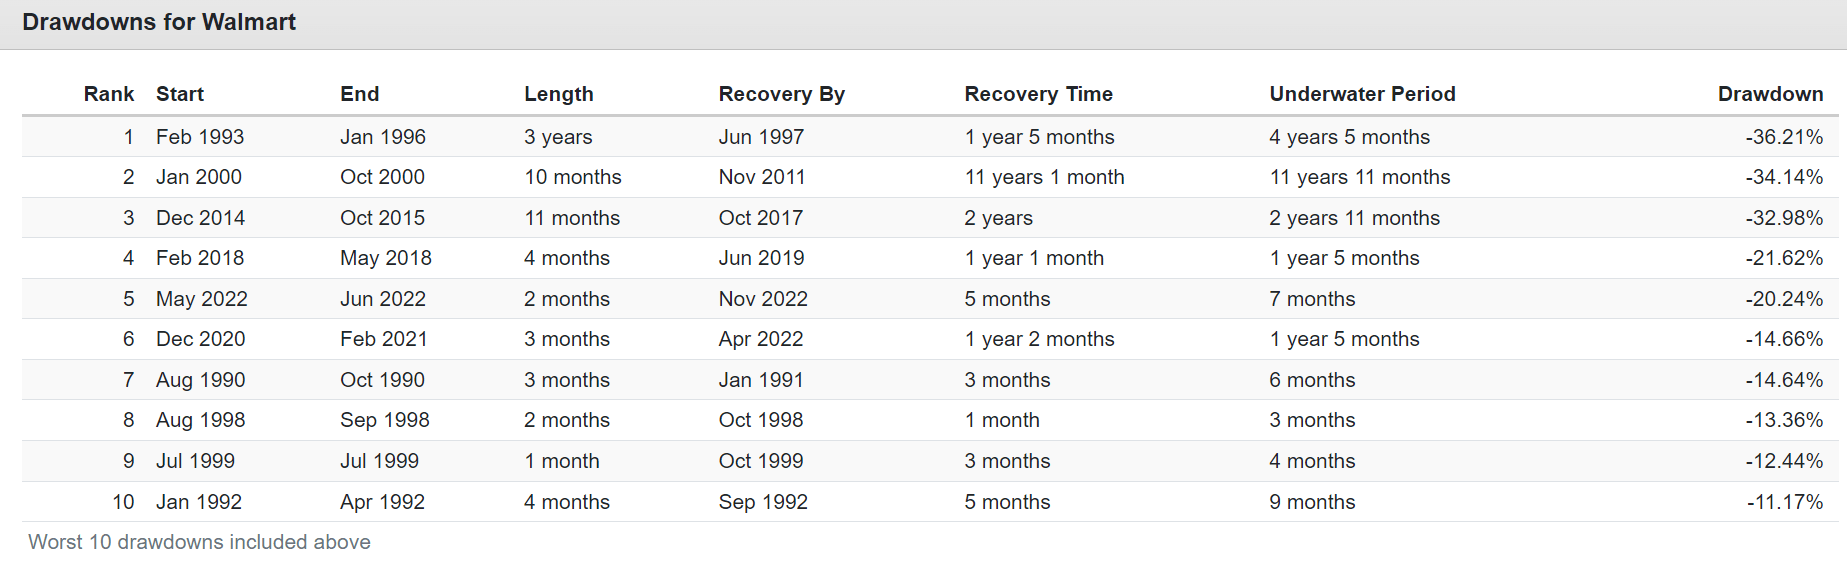
Pfizer’s Lost 13.5 Years
Portfolio Visualizer Premium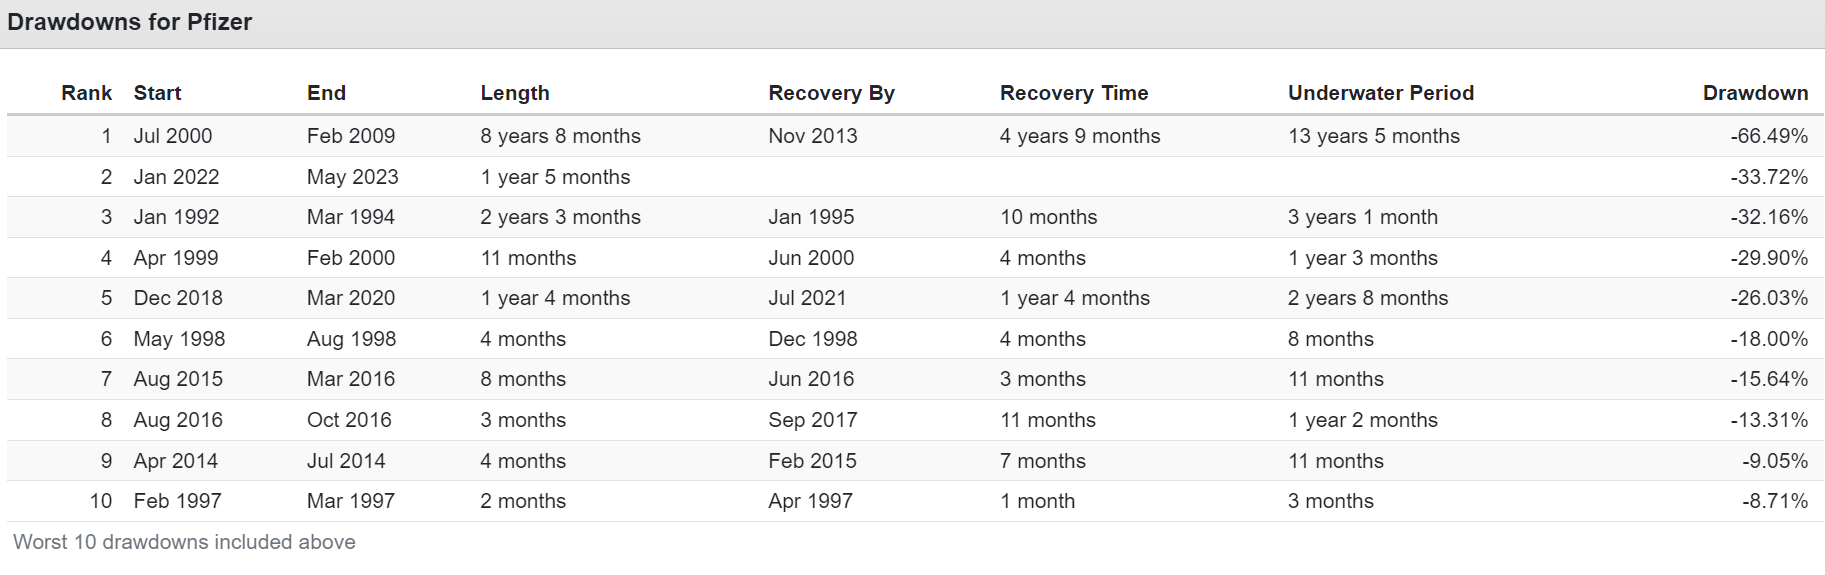
Cisco’s Lost 21.5 Years
Portfolio Visualizer Premium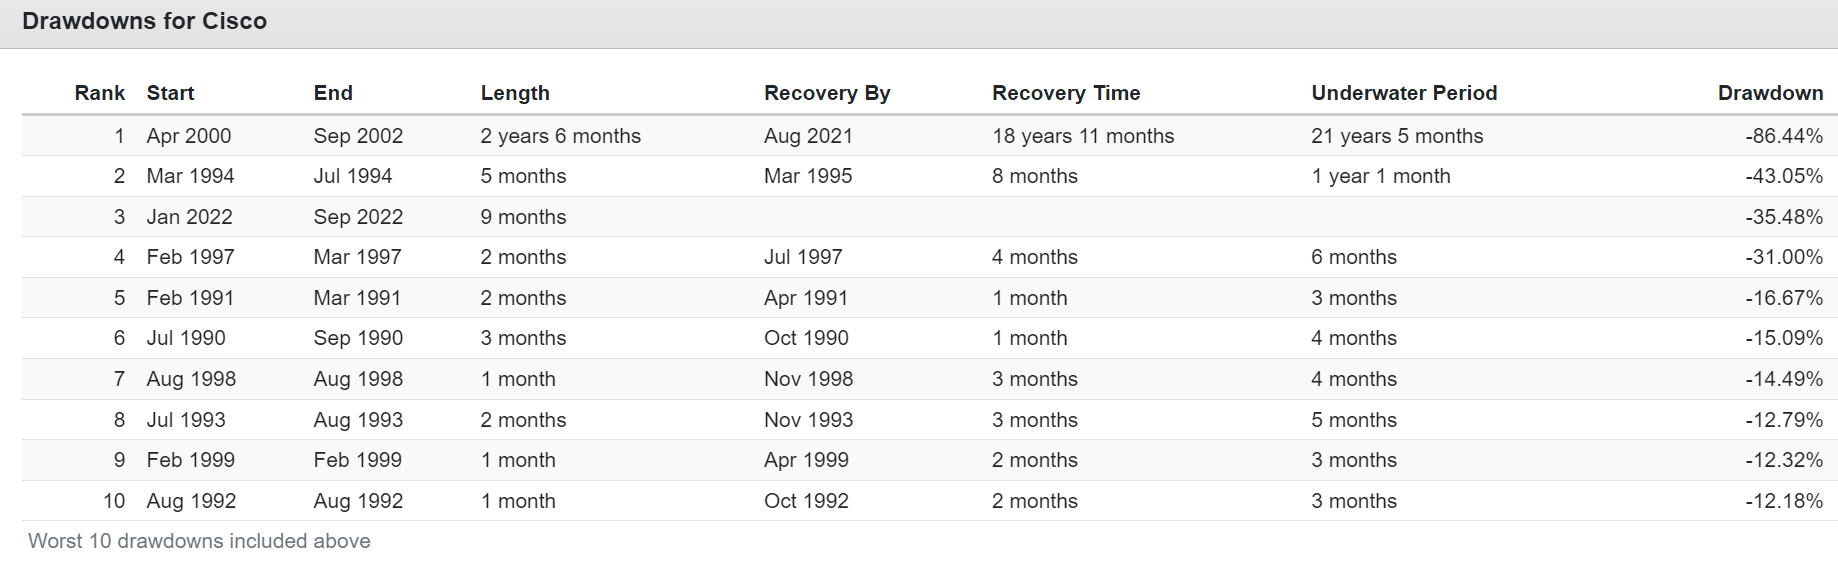
Or how about world-beaters like Microsoft Corporation (MSFT), the world’s 2nd most valuable company?
Microsoft Lost 14.5 Years
Portfolio Visualizer Premium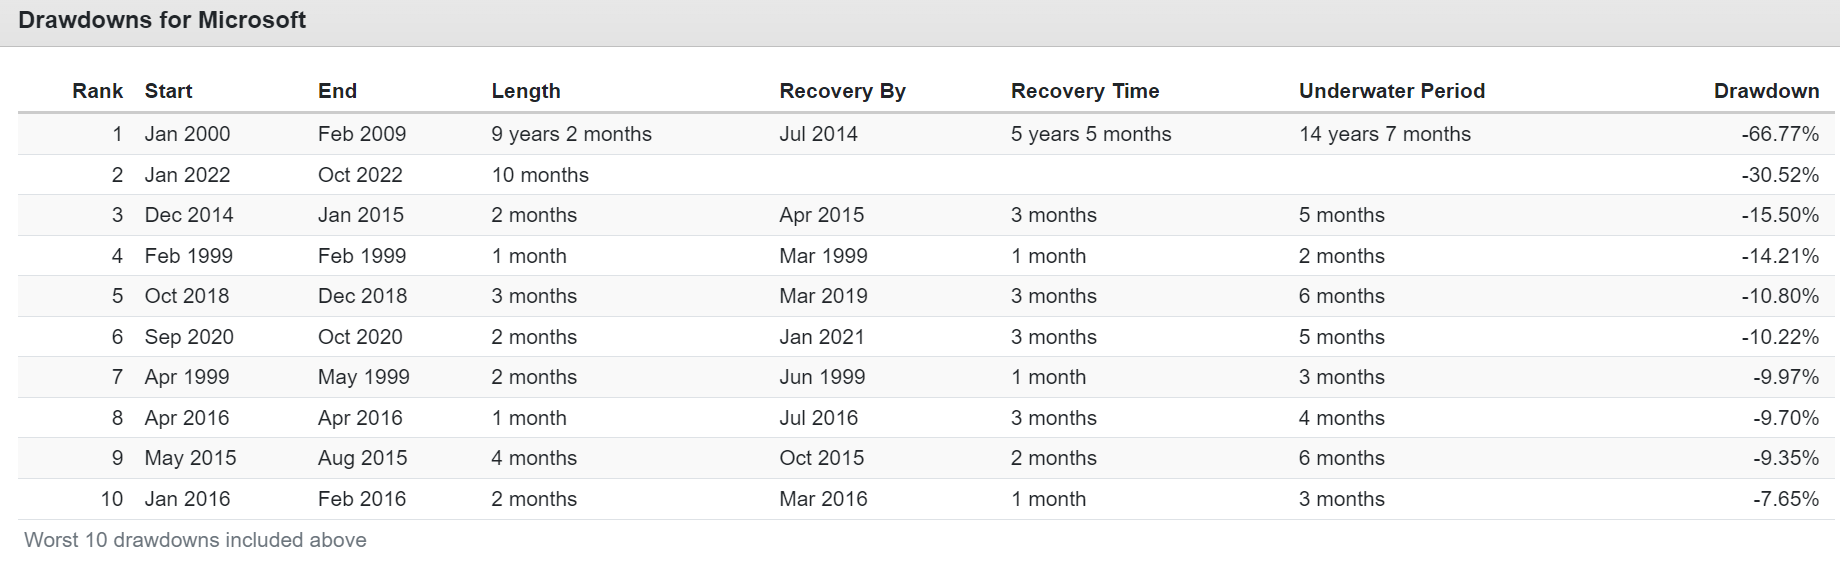
Or how about the first stock I ever bought? Network Appliance, now NetApp, Inc. (NTAP).
I paid 400X earnings for NTAP, watched it run to 1700X, and felt like a genius. “What will I do with my trillions?” I asked my mother right at the peak of the tech bubble.
Of course, I didn’t know what a P/E ratio was back then. And no one paying 1700X earnings for NTAP did either, nor cared.
YCharts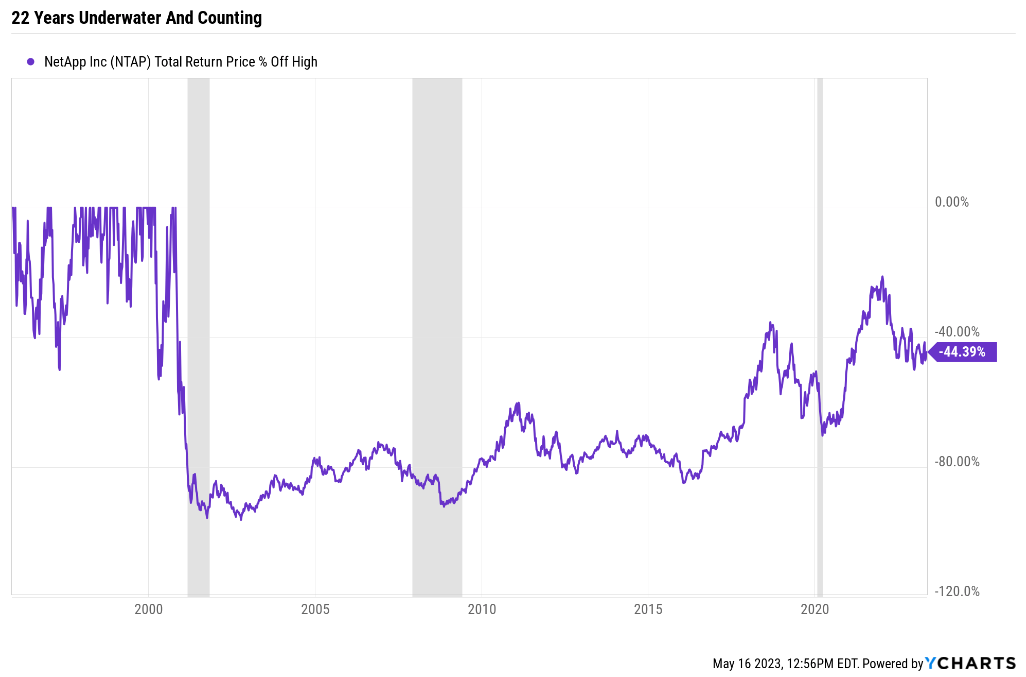
Twenty-two years later, NTAP, including dividends, is still down 44%. Despite these annual growth rates:
- Sales growth: 12%
- EPS growth: 19%
- Dividend growth 17%.
Objectively great results and terrible returns.
Why do I bring up such examples of crazy valuations?
NVIDIA Is In A Crazy Bubble
“The Triumph Of Hope Over Experience” – Oscar Wilde
FAST Graphs, FactSet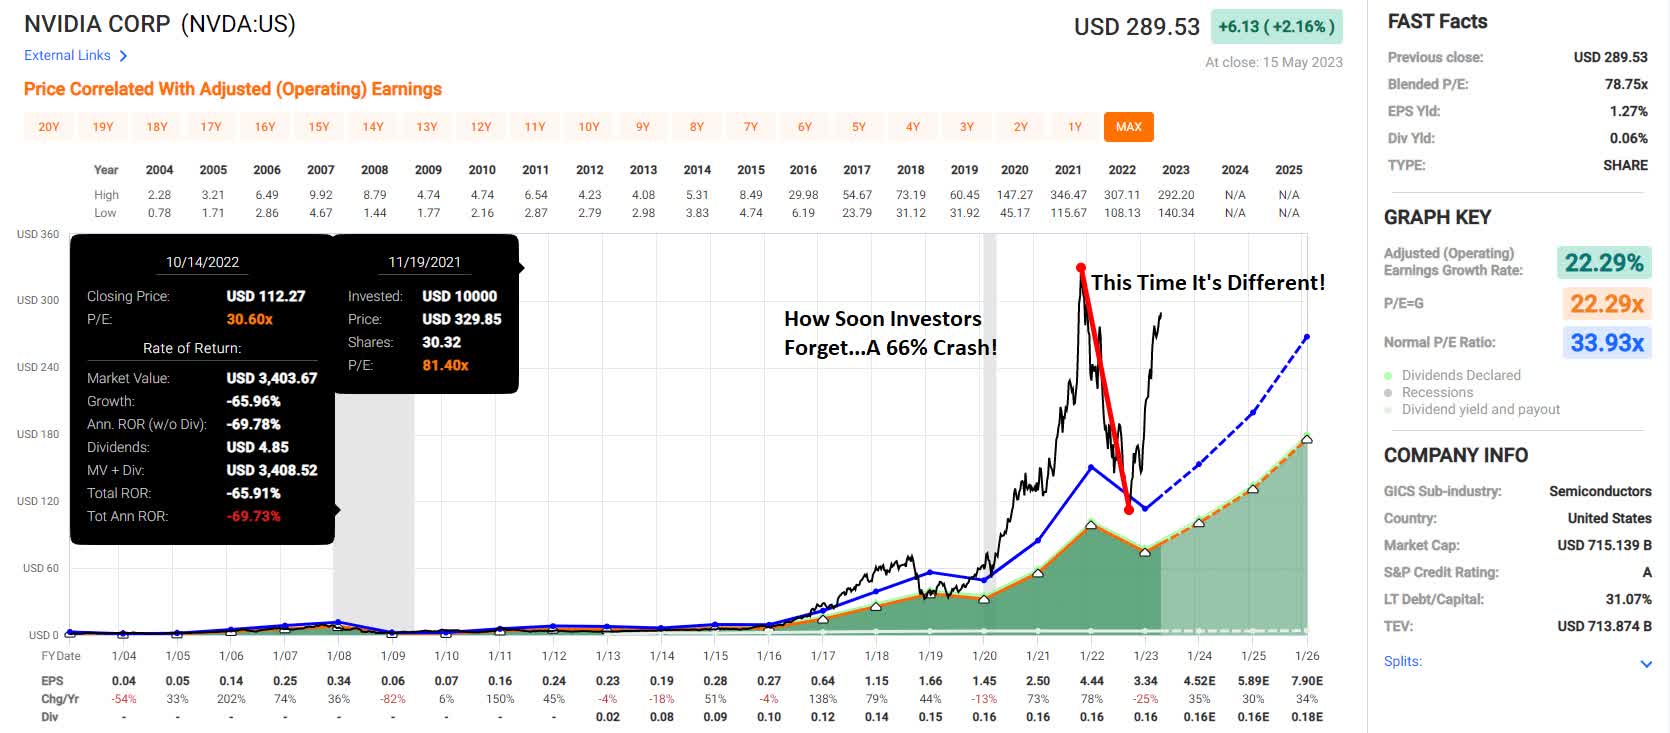
Let us walk through and debunk the “this time is different” arguments for why Nvidia Corporation (NASDAQ:NVDA) at 66X forward earnings somehow makes sense.
The four most dangerous words in investing are: ‘this time it’s different.'” – Sir John Templeton.
CNBC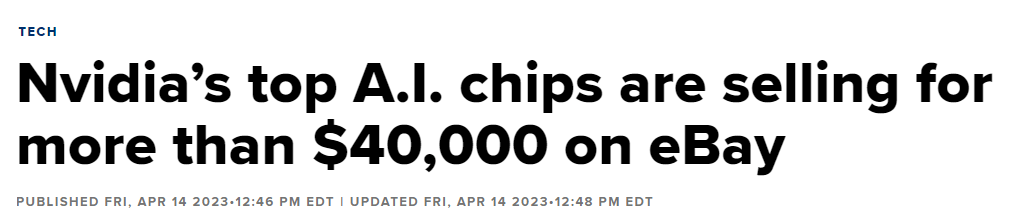
Nvidia’s AI chips can fetch up to $40,000! The price of a new car! There is no price too high for such wide moatiness!
Expect that a handful of 3rd party buyers don’t set the price for what Nvidia gets.
- Nvidia sells the A100 for $10,000.
Ok, that’s still amazing. One hundred chips for $1 million?! No price is too high!
Let’s not forget that in our capitalist world, any company that can sell 100 computer chips for $1 million is going to attract an army of competitors.
Today Nvidia has a 95% market share in cutting-edge AI chips. Let’s say it can maintain a 90% market share, like ASML Holding N.V. (ASML). Or even 80%, still world domination.
OK, so how fast can Nvidia grow as the global king of AI chips? 30% per year? 40%? 50%?
At its current P/E of 67, its historical PEG ratio implies it’s priced for about 45% annual growth.
So how fast do the 50 analysts who cover Nvidia for a living expect it to grow long-term?
FactSet Research Terminal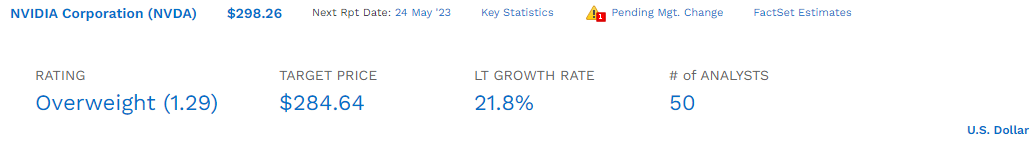
22% median long-term growth consensus…just like the last 20 years.
What does a 95% market share in $10,000 dollar cutting edge chips mean? That Nvidia might overcome the law of large numbers for another decade or even two.
That’s if Nvidia maintains its technological dominance and near-monopoly on AI chips.
But what have hundreds of millions of growth investors over 20 years determined is a fair price for Nvidia growing at 22%? About 34X earnings.
So what makes it worth twice that much today? Just one thing.
The belief of bulls is that someone will pay $300 or more within a year.
Nvidia 12-Month Price Targets
FactSet Research Terminal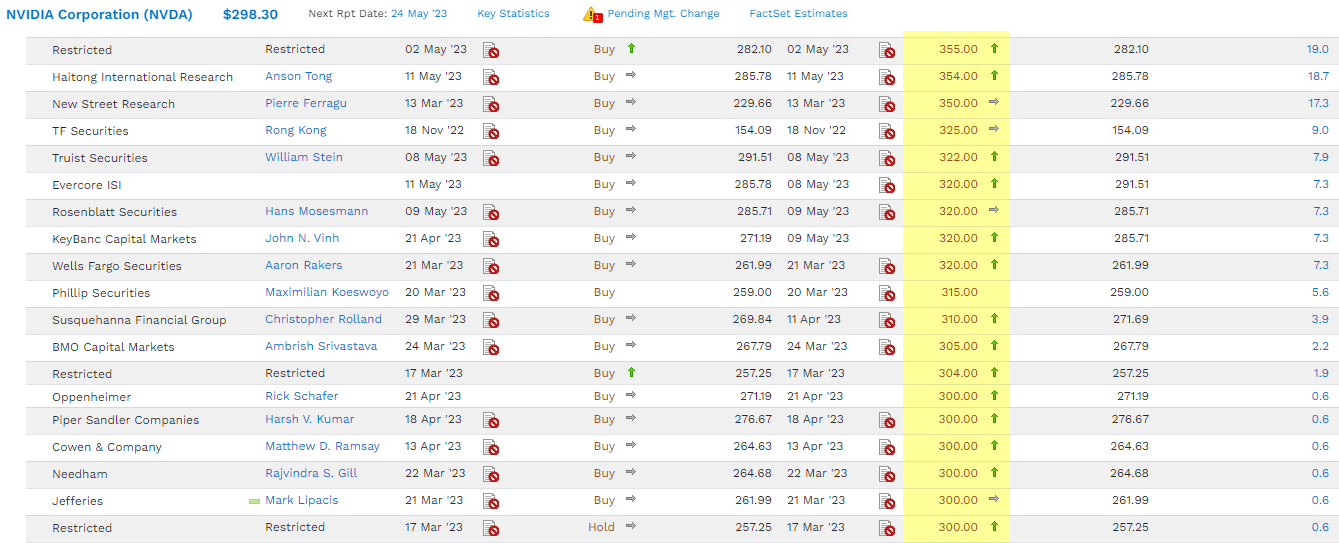
It’s the greater fool theory. Paying 66X earnings for a company worth 34X historically when growing at the same rate is logical if I can find some greater fool to pay 100X.
No one questions Nvidia’s quality as a company.
Fundamental Summary:
- Quality score: 95% very low risk 13/13 Ultra SWAN
- Dividend safety: 92% (1.4% severe recession risk)
- S&P long-term risk management: 91st percentile (very low risk, exceptional risk management)
- Credit rating: A stable (0.66% 30-year bankruptcy risk)
- yield: 0.05%
- growth: 21.8%
- long-term total return potential (from fair value): 21.9%
- historical market-determined fair value: $172.10
- Current price: $296.79
- discount: -72% vs 50% S&P tech bubble peak
- DK rating: potential trim/sell.
FAST Graphs, FactSet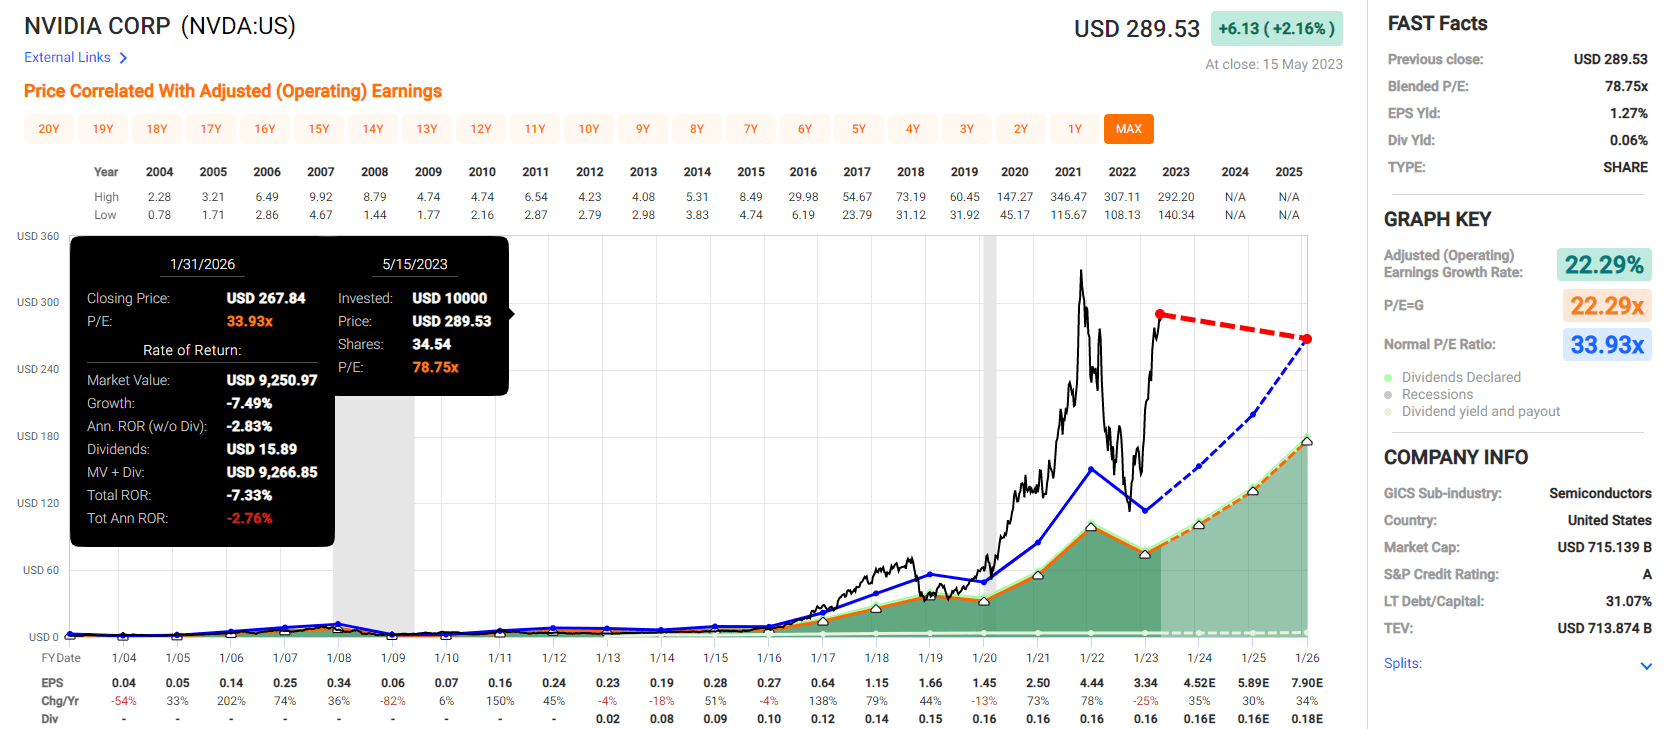
Nvidia is growing like a weed. No one denies this. But the next three years of hyper-growth are priced in.
Nvidia 2029 Consensus Total Return Potential
FAST Graphs, FactSet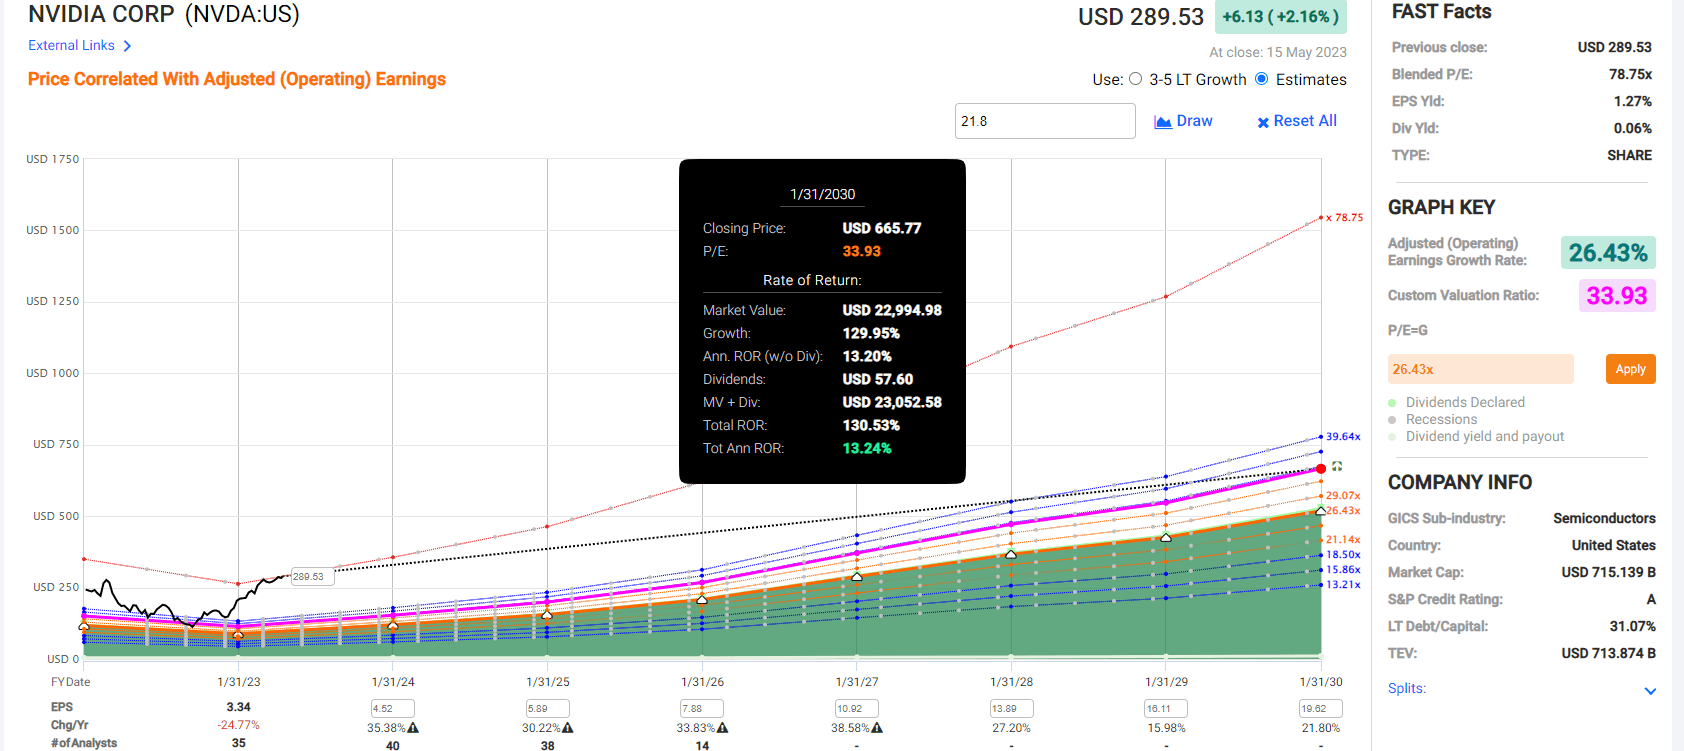
If Nvidia grows as expected, investors could still make 130% returns in the next six years, double the S&P consensus.
But between now and 2029 you’ll likely have to face something like this.
Peak Declines Since 1999
Portfolio Visualizer Premium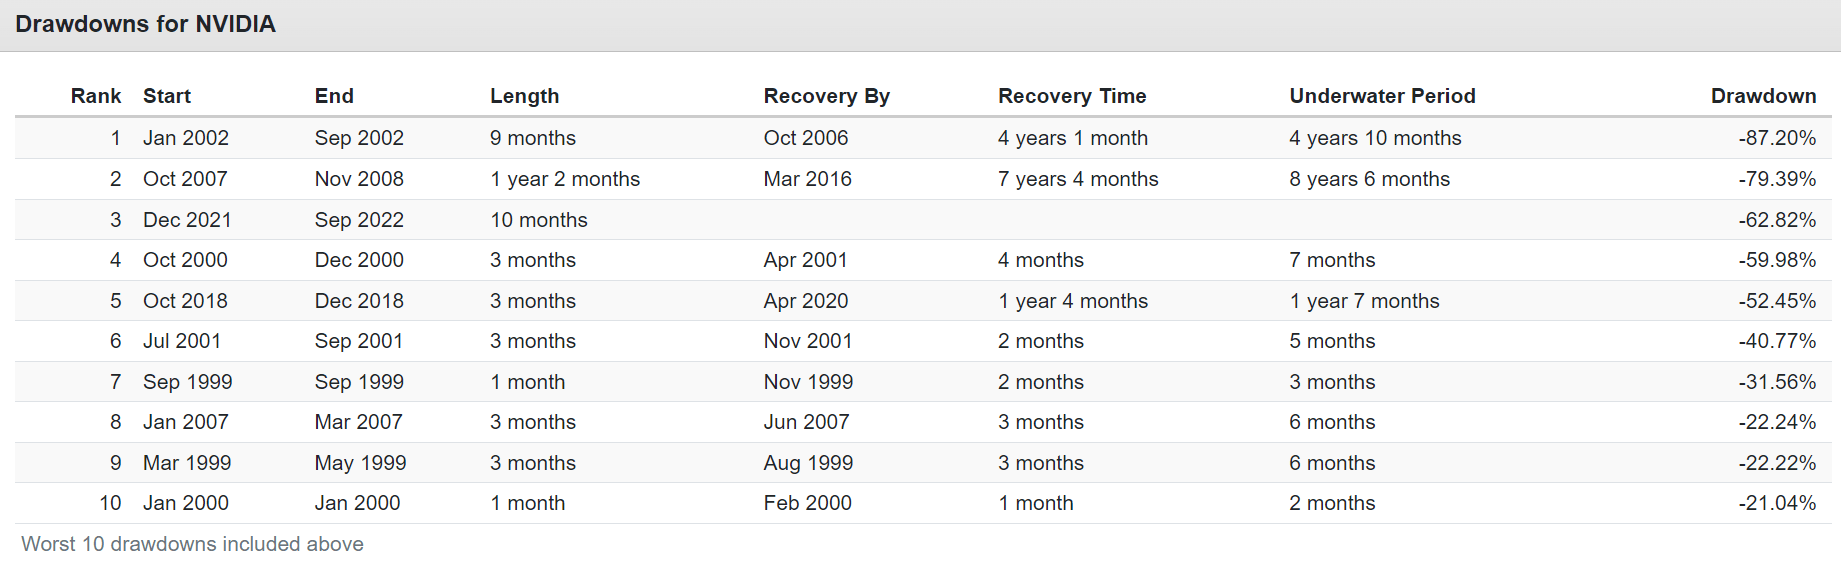
Nvidia is still in a 63% bear market.
And it’s suffered far worse in the past, including bear markets that took 8.5 years for investors to break even.
But even such summary charts don’t quite get across the horrors of this hyper-volatile, hyper-growth Ultra SWAN.
- quality and safety have nothing to do with valuation
- which many investors learn very painfully.
Nvidia ‘s historical beta (volatility relative to S&P) is 2.02.
You can expect Nvidia to fall about twice as much if the market falls.
Here’s what that looks like in terms of monthly returns.
NVDIA In The 2022 Bear Market
Portfolio Visualizer Premium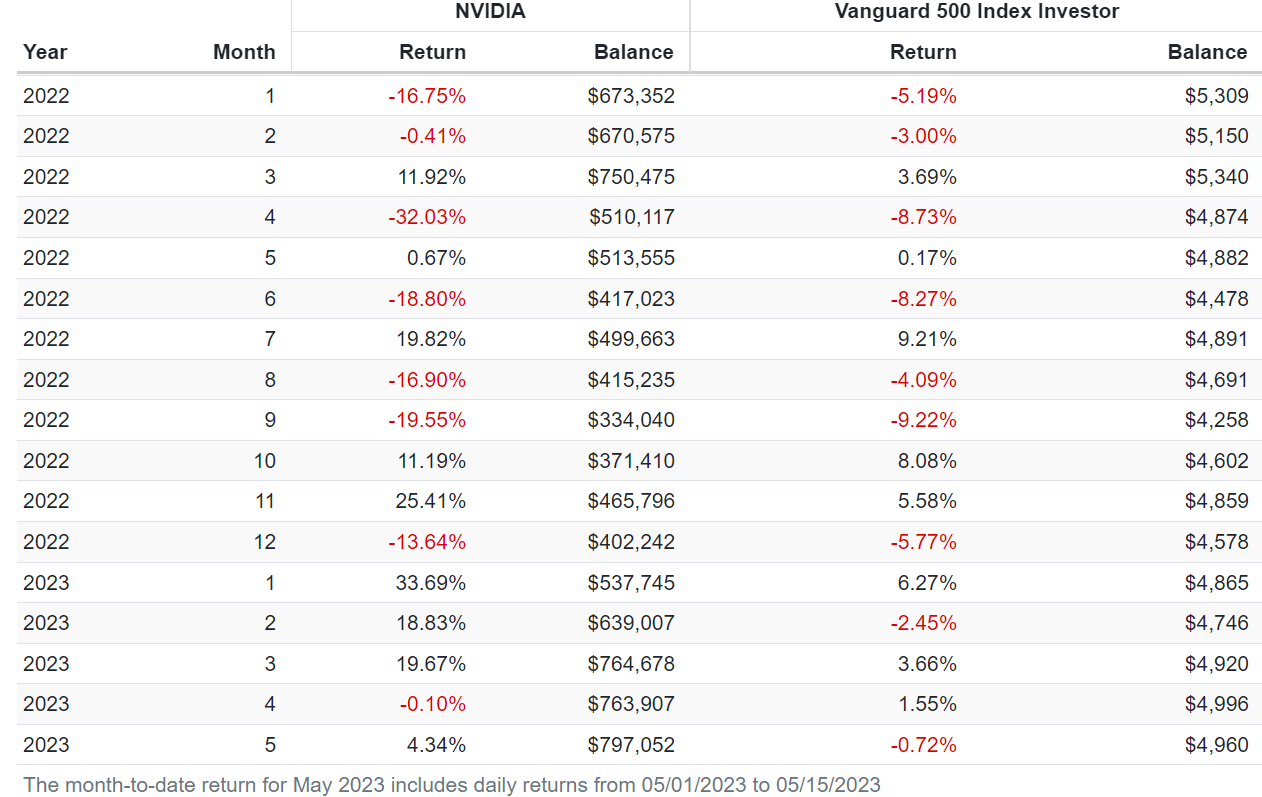
Down 33% in April 2022.
Nvidia In The 2018 Bear Market
Portfolio Visualizer Premium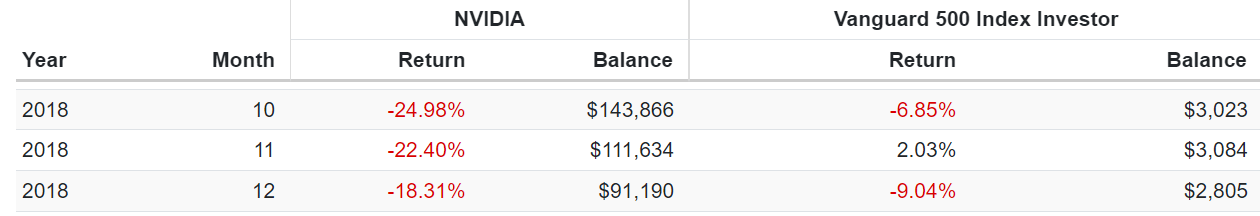
A 52% decline in three months when the market’s peak decline was 21%.
Nvidia In The 2011 Debt Ceiling Crisis
Portfolio Visualizer Premium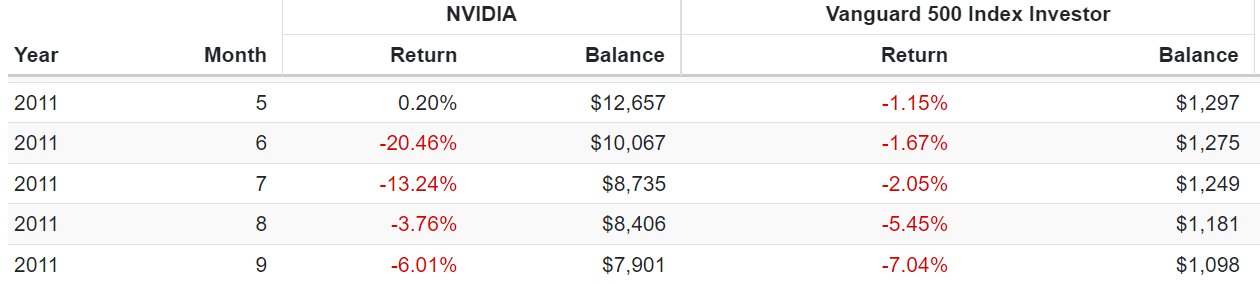
A “mere” 38% decline in the 2011 debt ceiling crisis. The one Goldman and S&P thinks is likely to be repeated…in the next two weeks.
Nvidia In The Great Financial Crisis
Portfolio Visualizer Premium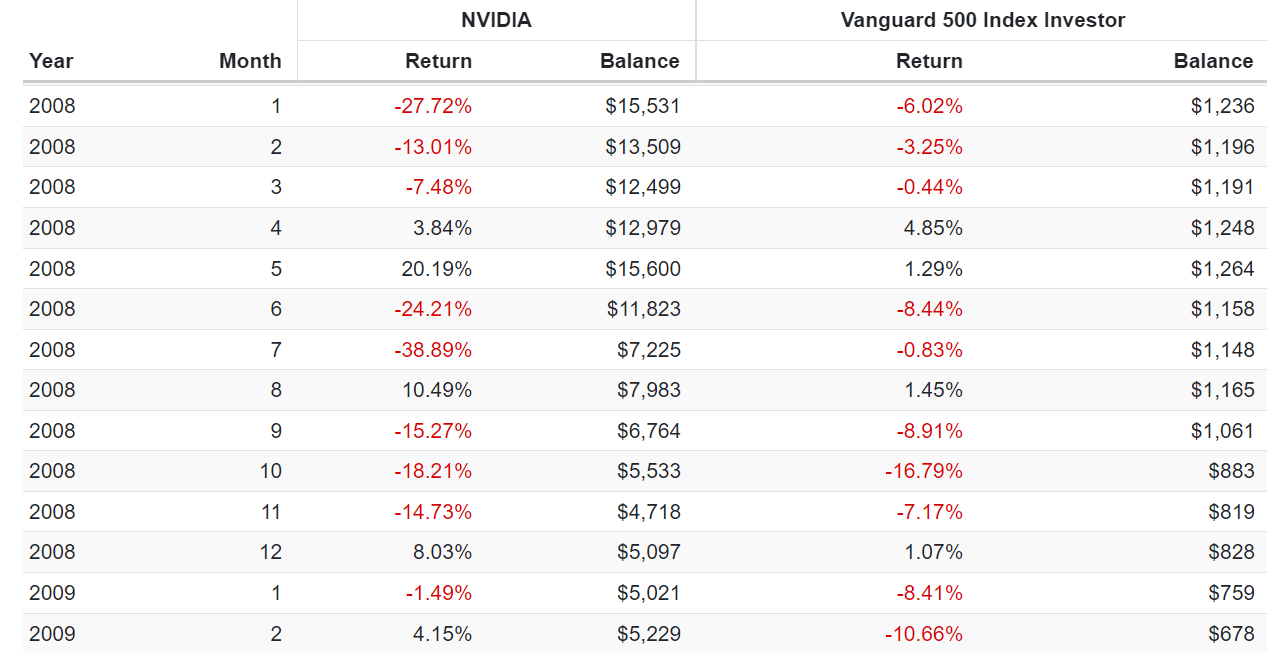
A 39% decline in July 2008, and that’s after a 24% decline in June.
That’s a 54% decline in two months.
Nvidia In The Tech Crash
Portfolio Visualizer Premium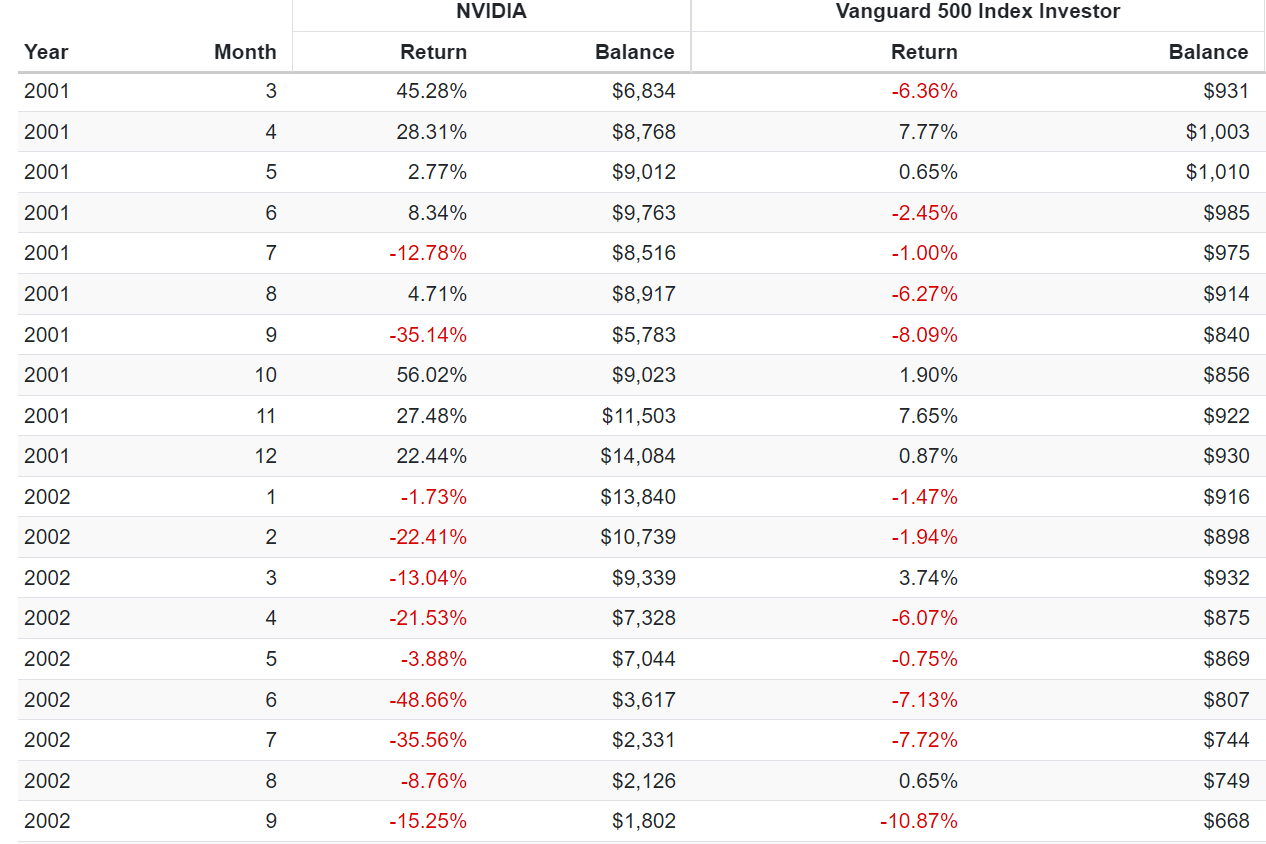
A 49% decline in June 2002 and an 83% decline in 2002, and that’s after rallying 100% in the final two months of the year.
In fact, Nvidia fell 87% in 9 months in 2002.
| Bear Market | NVIDIA | 60/40 | S&P |
| 2022 Stagflation | -63% | -21% | -28% |
| Pandemic Crash | -2% | -13% | -34% |
| 2018 Recession Scare | -52% | -9% | -21% |
| 2011 Debt Ceiling Crisis | -38% | -16% | -22% |
| Great Recession | -79% | -44% | -58% |
| Tech Crash | -87% | -22% | -50% |
| Average | -54% | -21% | -34% |
| Median | -58% | -19% | -31% |
(Source: Portfolio Visualizer Premium/)
The average bear market for Nvidia is a 54% crash, and the median is almost 60%.
Am I saying that everyone who owns Nvidia should immediately sell? No.
Who SHOULDN’T Be Selling Nvidia Right Now
If you have owned Nvidia for years and have hundreds or even thousands of % profits, then paying taxes might not make sense for you.
Not when Nvidia can more than double in the next six years.
FAST Graphs, FactSet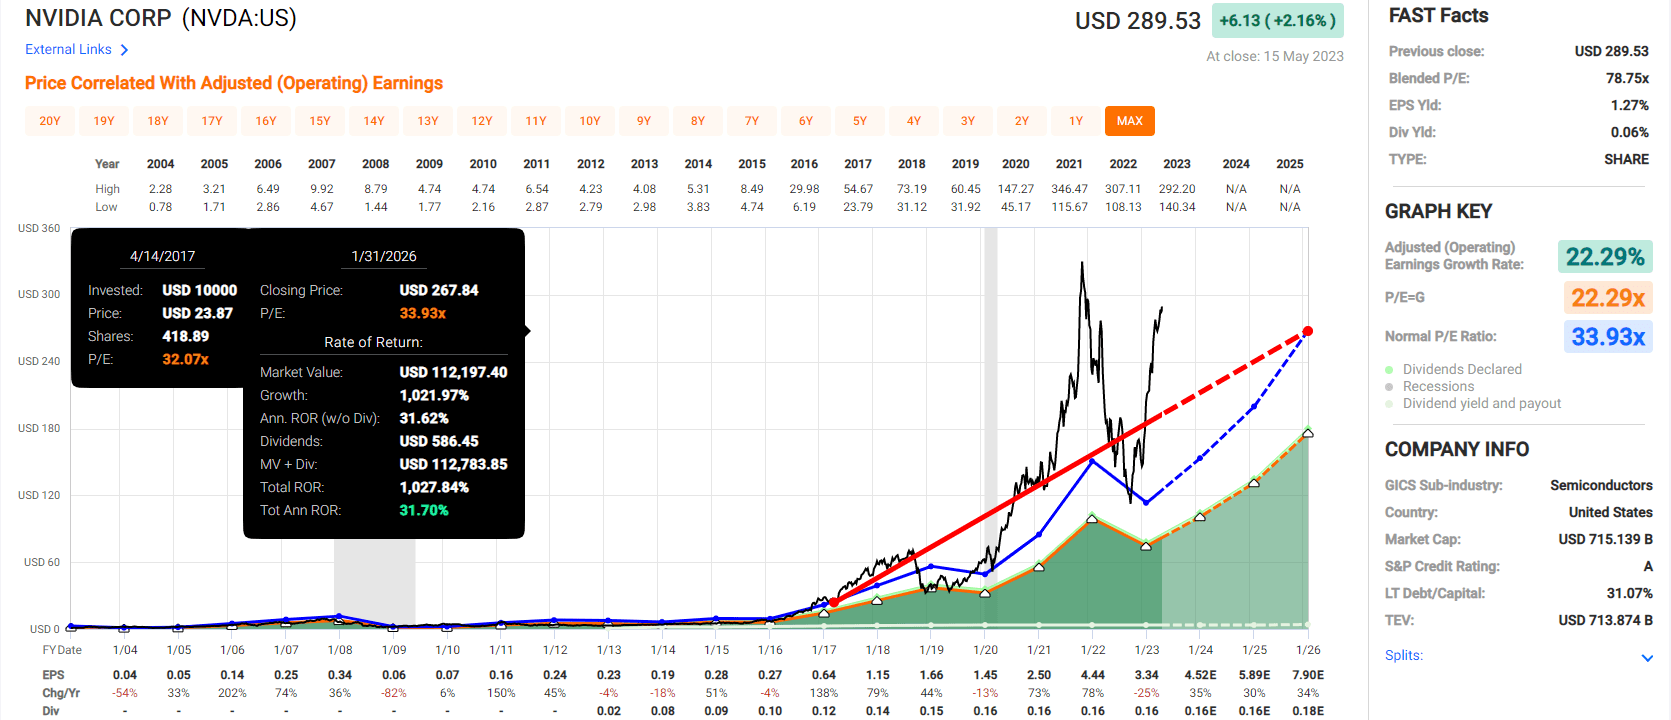
If you bought Nvidia at fair value, you’ve potentially locked in 22% long-term returns, more than double the S&P 500 consensus.
So sit back, relax, and ignore my warning. You’ll be just fine.
Index Investors Can Ignore Bubbles…Just Be Aware Of What’s Fueling Them
Daily Shot 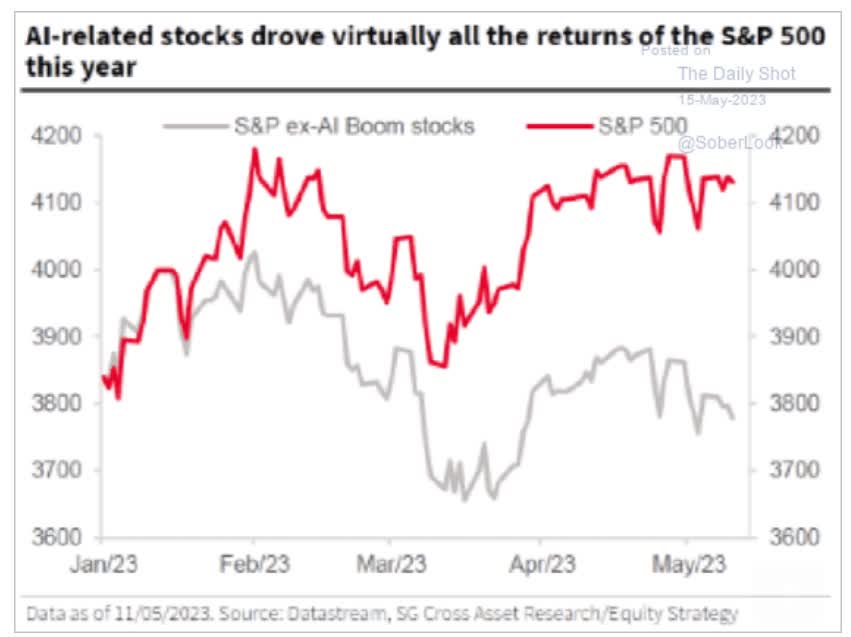
AI big tech stocks, and none more so than Nvidia , are responsible for the entire market rally this year.
388 ETFs own Nvidia , including SCHG, my favorite growth ETF.
- By the year’s end, I’ll own about $5,300 worth of Nvidia in this ETF.
Who SHOULD Sell Nvidia Immediately…
If you bought Nvidia at the October lows…congrats, you nailed the bottom and bought at fair value.
If you want to buy and hold forever, go ahead, that’s reasonable and prudent.
If you bought Nvidia above the October lows, you overpaid.
And if you’ve been chasing it higher into earnings? For the love of god, sell before earnings!
Why Nvidia Could Crash Next Week (Wed After The Bell)
Wed, May 24th, after the bell, Nvidia reports earnings. And potentially faces a reckoning that could become a house of horrors for anyone chasing it into earnings.
Seeking Alpha 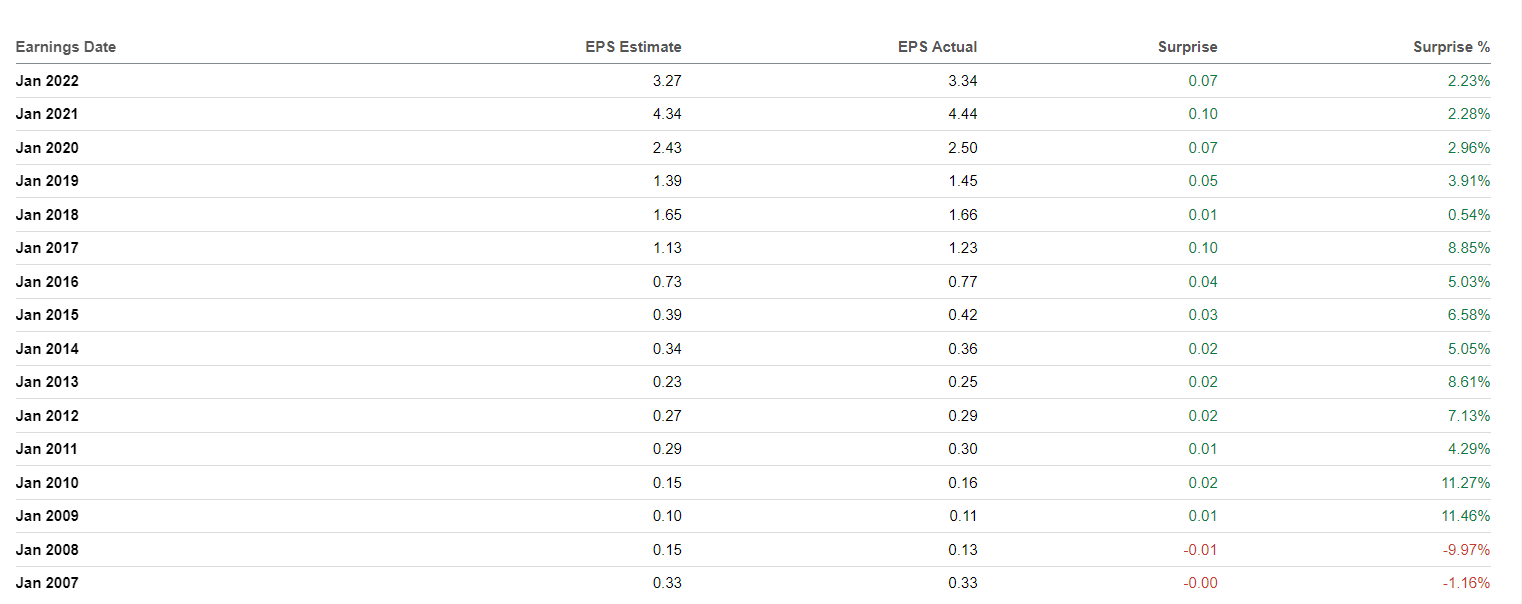
Nvidia hasn’t missed earnings estimates in 3.5 years.
Neither had Apple Inc. (AAPL) for 27 consecutive quarters when I YOLOed into Apple options ahead of earnings.
- I made $75,000 on the day before earnings
- and lost $150,000 when Apple missed earnings for the first time in 8 years.
Even more dangerous? Nvidia estimates have been rising steadily for most of the year.
FactSet Research Terminal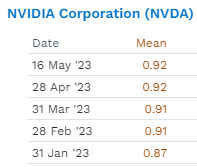
This is a stock trading at a 72% historical premium. It’s priced as if God himself is running it and will never set a foot wrong again.
Why Nvidia Is At High Risk Of Missing Earnings And Or Giving Poor Guidance
Chips are a cyclical industry.
$10,000 AI super chips are an especially cyclical industry.
Guess what might happen if we have a recession? Chip demand falls.
Guess what happens to $10,000 super chip demand if we have a recession that’s twice as severe as economists were recently expecting?
Bank of America’s CEO, Brian Moynihan, just said he thinks the recession will be worse than the consensus and last longer.
He thinks a 1.5% GDP contraction starts in July and ends in Q1 2024.
That doesn’t sound too bad; what’s the big panic over Nvidia?
Daily Shot 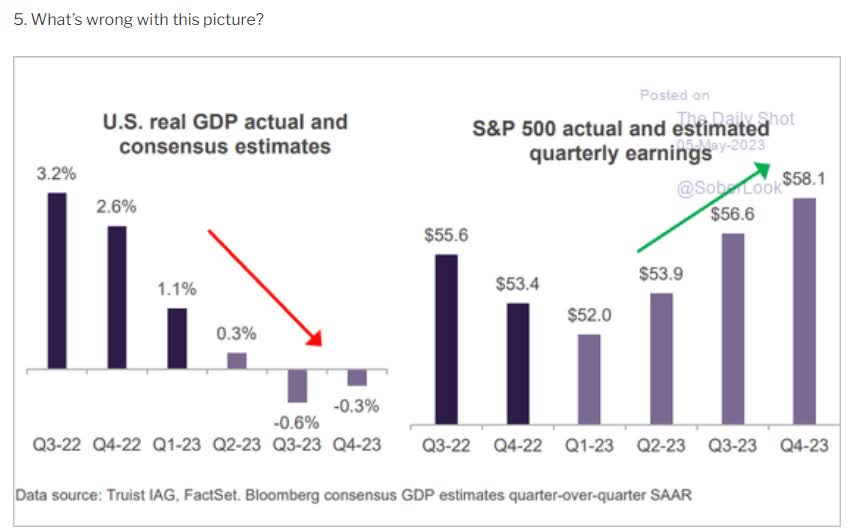
The consensus is a 0.9% contraction lasting six months.
But Moody’s and the Federal reserve have some bad news.
According to Moody’s in October, the U.S. government is likely to begin austerity budget cuts.
- part of the GOP House’s efforts to cut the deficit.
In October, the government will shut down unless a new fiscal 2024 spending package is passed.
According to Moody’s Speaker McCarthy’s debt ceiling proposal, if enacted, would cut 0.7% off 2024’s growth.
Assuming a 50/50 compromise, a 0.4% GDP growth headwind begins in October.
- 2023 recession now up to -1.3% growth.
In October, 43 million Americans with student loans will have to start making payments again for the first time in 3 years.
According to the Federal Reserve, the average student loan payment is $250 per month, and they will have to reduce their spending by $238 per month, on average.
What is the effect on the economy when $129 billion in less annual spending occurs (for any reason)? A 0.5% reduction in GDP growth.
- The 2023 recession is now up to a -1.8% peak decline.
The average recession since WWII is a 1.4% peak contraction, and the recessions last nine months.
In the average recession, the Fed cuts interest rates by 5%. But the Fed, through dozens of speakers in the last two weeks, is adamant. No cuts. In fact, the Boston Fed president says he opposes cuts even in a recession unless inflation is coming down fast enough.
In the average recession, Congress cuts taxes and increases spending to put money into people’s hands to spend.
This time, Congress will cut spending and effectively increase taxes (those student loan payments will reduce consumer spending).
Oh, and let’s not forget the regional bank crisis. The average recession doesn’t have a banking crisis constricting credit to consumers.
Daily Shot 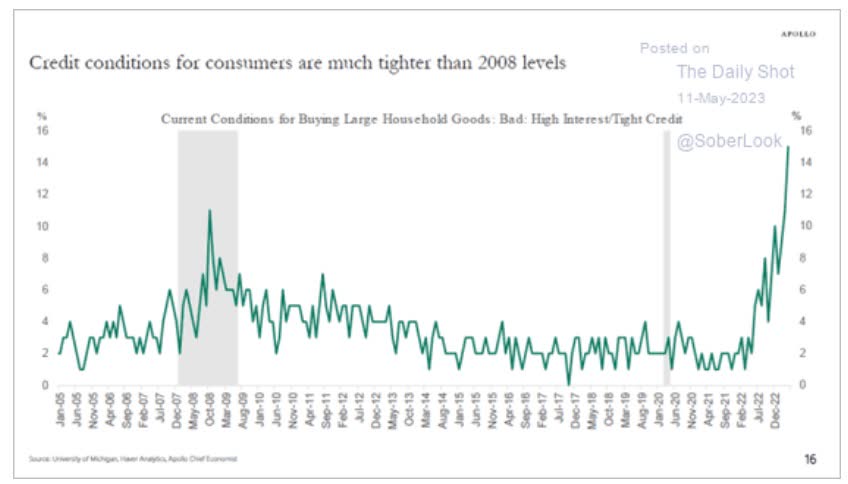
This time consumer credit is tightening at twice the rate of the Great Recession, the fastest rate in recorded history.
70% of the U.S. economy is being driven by consumer spending.
Daily Shot 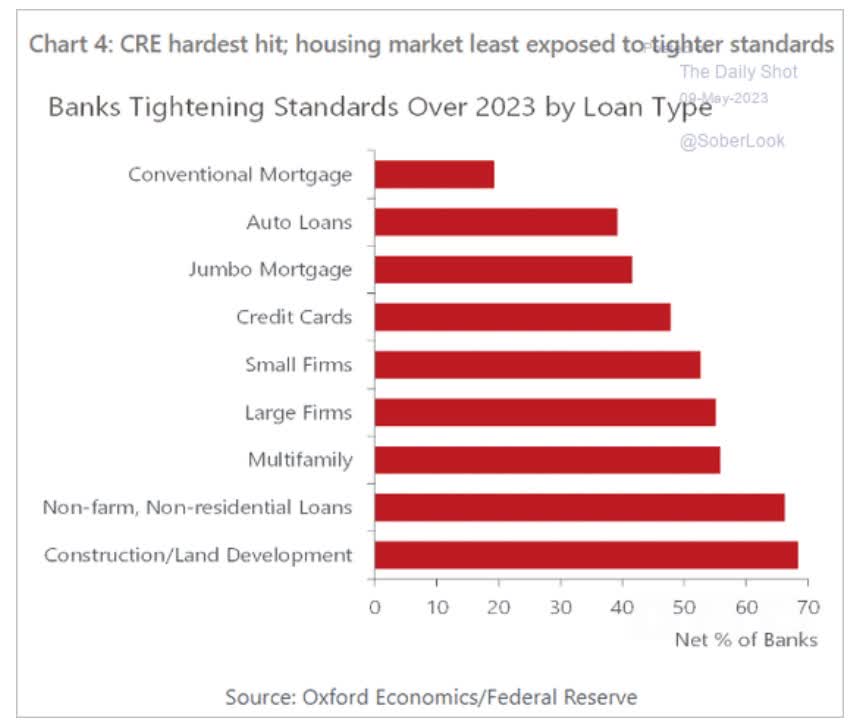
Credit is tightening across the economy for consumers and businesses. For some sectors, like commercial real estate, it’s an outright depression.
Daily Shot Daily Shot 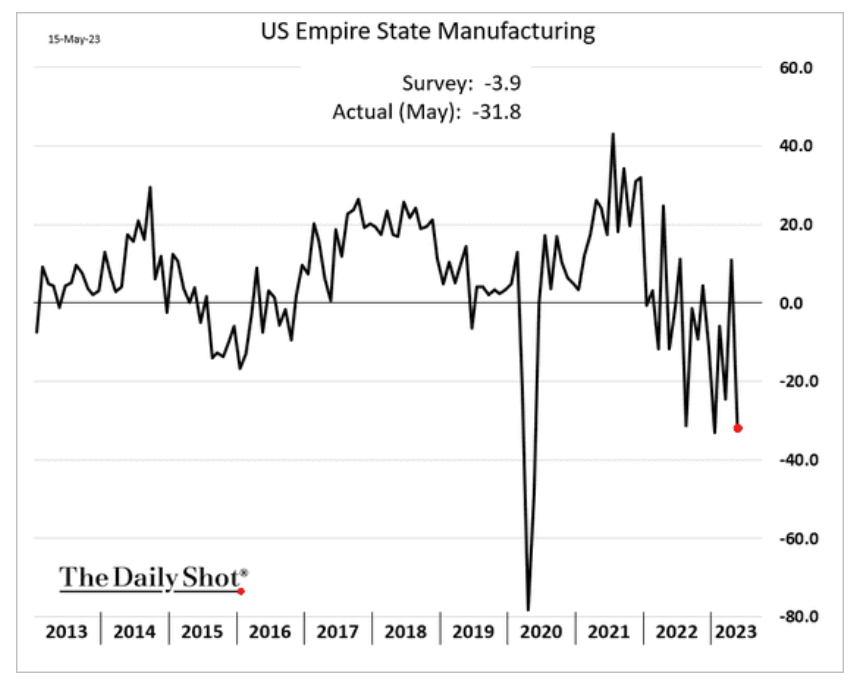
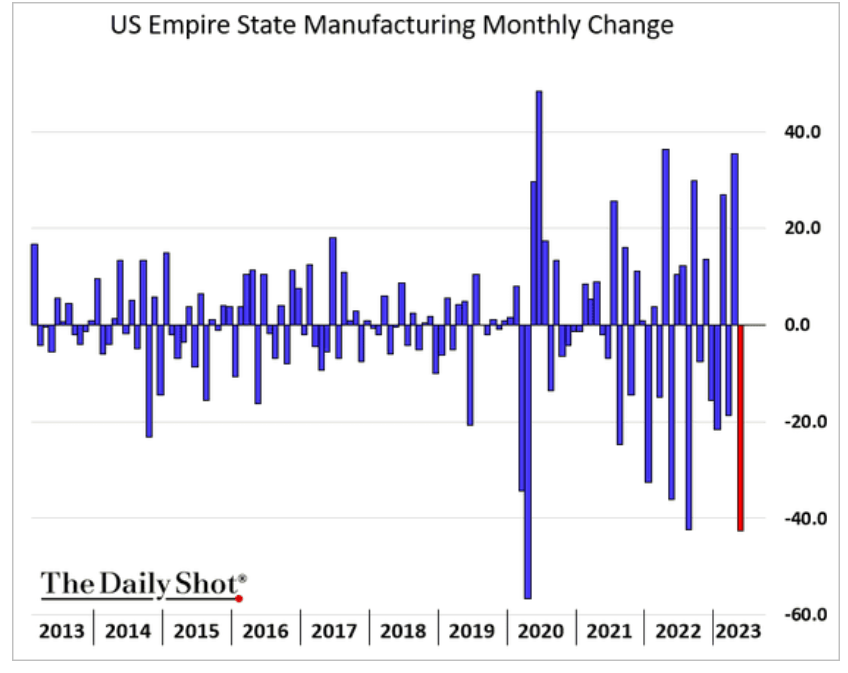
The only time N.Y. manufacturing was declining at a faster was during the Pandemic Lockdown.
Daily Shot 
So let’s summarize:
- recession is likely five weeks away
- the recession is likely to be about 2X worse than economists were previously expecting
- and last 3 to six months longer
- consumer credit is tightening
- key industries are in severe contraction, literally Pandemic/depression levels.
And Nvidia ‘s earnings estimates have been rising all year.
Investors are so used to them beating expectations every time, as they have for 3.5 consecutive years, that the idea of Nvidia missing estimates and or giving weak guidance is as unthinkable as the U.S. defaulting on its debt.
The Debt Ceiling Is Still Looming
Treasury, Goldman, Moody’s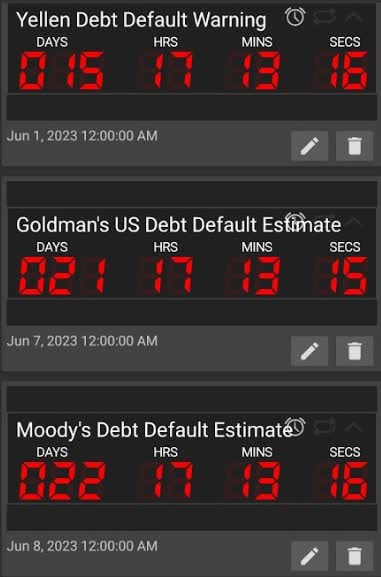
The last time we had a debt crisis where we came within days of breaching the X-date was in 2011.
| Bear Market | NVIDIA |
| 2022 Stagflation | -63% |
| Pandemic Crash | -2% |
| 2018 Recession Scare | -52% |
| 2011 Debt Ceiling Crisis | -38% |
| Great Recession | -79% |
| Tech Crash | -87% |
| July 1998 to October 1998 | NA |
| 1990 Recession (May To October) | NA |
| 1987 Black Monday Period | NA |
| Average | -54% |
| Median | -58% |
(Source: Portfolio Visualizer Premium.)
Moody’s estimates a 10% chance we go past the X-date, called a breach.
- someone won’t get paid
- Treasury will pay bondholders first
- but screw everyone else.
Joint Economic Committee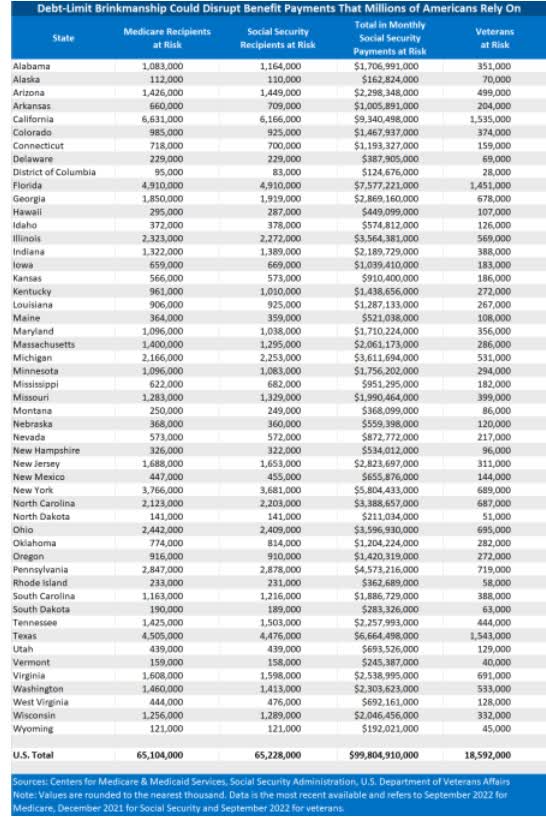
Social Security provides 66 million Americans with $100 billion a month.
In total, 80 million Americans, including retired Federal workers and disabled veterans, get monthly money from the US Treasury.
If we breach, that will stop, or so Secretary of the Treasury Yellen tells us.
Statista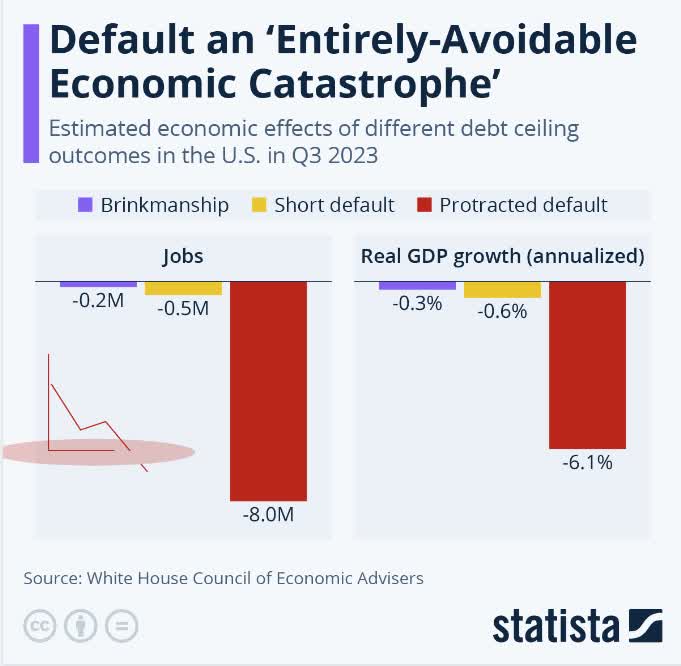
If we default for three months, there simply won’t be enough tax revenues (which will be falling rapidly) to avoid defaulting on U.S. bonds.
Since the 1944 Bretton Woods conference, U.S. treasuries being “risk-free” is the basis for the global financial system.
Within three months of default, the Joint Economic Committee estimates that 8 million Americans would lose their jobs as the economy contracts 50% more than during the Great Recession.
Stocks?
S&P Bear Market Bottom Scenarios
| Earnings Decline | S&P Trough Earnings | Historical Trough PE Of 14 (13 to 15 range) | Decline From Current Level | Peak Decline From Record Highs |
| 0% (consensus, mild recession) | 228 | 3194 | 22.5% | -33.7% |
| 5% (Morgan Stanley’s Mike Wilson) | 217 | 3034 | 26.3% | -37.0% |
| 10% | 205 | 2875 | 30.2% | -40.4% |
| 13% (Average since WWII), Moody’s 2-month default scenario | 198 | 2779 | 32.5% | -42.3% |
| 15% | 194 | 2715 | 34.1% | -43.7% |
| 20% | 183 | 2555 | 38.0% | -47.0% |
| 25% | 171 | 2395 | 41.8% | -50.3% |
| 30% (3-month Default scenario) | 160 | 2236 | 45.7% | -53.6% |
(Source: JEC, Bloomberg, FactSet.)
Stocks would fall approximately 45% in the next 3.5 months, according to JEC’s model.
And Nvidia’s beta is 2.02, meaning even if it were fairly valued, it would likely crash far further.
And today, it’s 72% historically overvalued, priced for 45% long-term growth.
What is the growth consensus range from all 50 analysts? Oppenheimer thinks NVDA will grow 10% long-term, the lowest forecast.
The most bullish is Deutsche Bank at 40.1%.
In other words, there is no bullish case in which NVDA, a hyper-volatile hyper-growth stock is worth 66X earnings.
And now the economic data points to a recession likely beginning in July, and being slightly above average in severity but two times worse than economists were previously expecting.
NVDA is priced for perfection and selling out all of its $10,000 A100 chips.
It’s priced as if the economy were booming, and nothing on the horizon could derail the cyclical demand for chips, never mind $10,000 super chips.
Bottom Line: If You’ve Overpaid For Nvidia Recently, Sell Now, Before Earnings
I can’t tell you with 100% certainty that any company will miss earnings and crash.
But I can tell you that all of the data right now says that Nvidia is at EXTREME risk of missing expectations and issuing disappointing guidance.
A stock priced for 45% long-term growth, something no analyst thinks is possible, is priced for smooth sailing through a booming economy with no major risk factors that could cause even a mild recession, much less the 1.8% GDP decline that could be starting in five weeks.
The slightest gust of economic wind could topple Nvidia’s speculative house of cards.
And just in case you don’t realize how hyper-volatile this stock is, even when not in a bubble, here’s a 3rd reminder.
| Bear Market | NVIDIA |
| 2022 Stagflation | -63% |
| Pandemic Crash | -2% |
| 2018 Recession Scare | -52% |
| 2011 Debt Ceiling Crisis | -38% |
| Great Recession | -79% |
| Tech Crash | -87% |
| July 1998 to October 1998 | NA |
| 1990 Recession (May To October) | NA |
| 1987 Black Monday Period | NA |
| Average | -54% |
| Median | -58% |
(Source: Portfolio Visualizer Premium.)
Remember who should and shouldn’t be considering selling or trimming Nvidia right now.
- Long-term investors who bought at fair value years ago are fine…hold.
- Index fund investors who own one of 388 ETFs can’t do anything unless they sell those ETFs
But millions of people have been momentum-chasing Nvidia this year, using the greater fool theory to practice the “triumph of hope over experience.”
“The Triumph Of Hope Over Experience” – Oscar Wilde
FAST Graphs, FactSet
But there is another reason for this detailed warning about Nvidia.
In bear markets, stocks return to their rightful owners” – JPMorgan.
The same terrifying bear markets that haunt the dreams of Nvidia traders who don’t get out in time to let smart long-term investors achieve life-changing returns.
Nvidia‘s Best Bull Markets Off Bear Market Lows
| Time Frame (Years) | Annual Returns | Total Returns |
| 1 | 751% | 751% |
| 3 | 140% | 1284% |
| 5 | 89% | 2340% |
| 7 | 81% | 6381% |
| 10 | 57% | 9222% |
| 15 | 34% | 7611% |
(Source: Portfolio Visualizer Premium.)
Don’t fear the bear market; embrace it!
When the music stops, in terms of liquidity, things will be complicated. But as long as the music is playing, you’ve got to get up and dance.” – Chuck Prince, Ex-Citigroup CEO, July 2007 (emphasis added).
Don’t be blind to the obvious risks that are all around us and converging on a likely economic hurricane.
The economic music is faltering, and Nvidia’s glorious symphony could be about to end in spectacular fashion on earnings night.
YCharts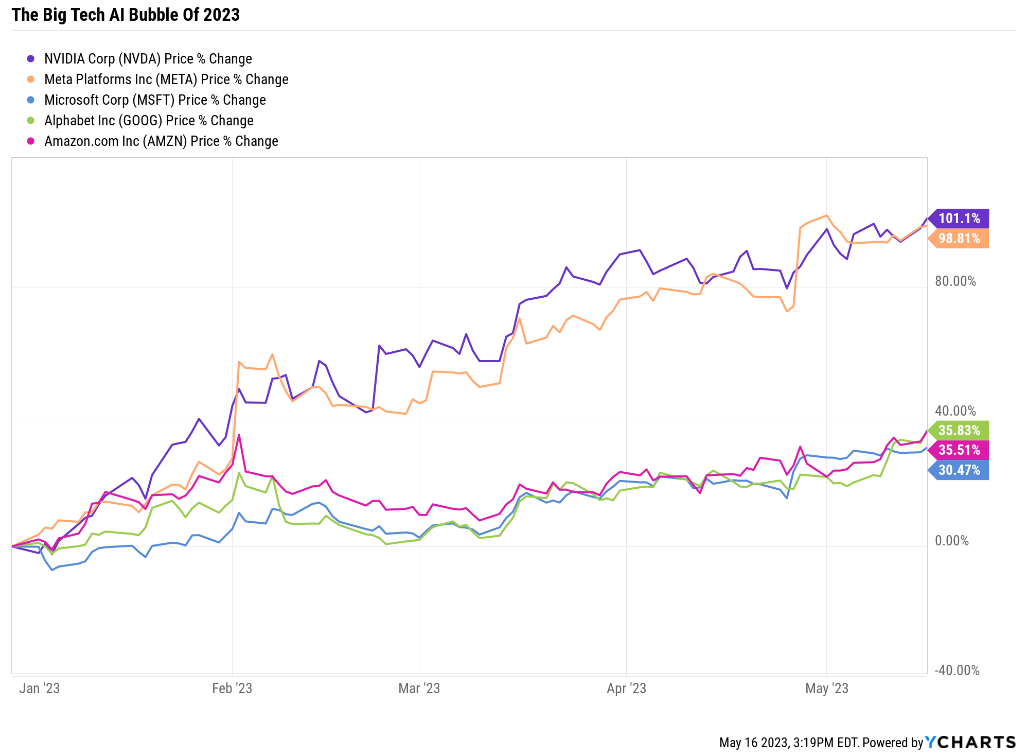
Momentum traders chasing Nvidia into earnings, you’ve been warned. You’re picking up pennies in front of a steamroller that’s accelerating.
But Nvidia fans looking for a reasonable price? Rejoice!
Nvidia ‘s Valuation Matrix
| Rating | Margin Of Safety For Very Low-Risk 13/13 Ultra SWAN | 2023 Fair Value Price | 2024 Fair Value Price | 12-Month Forward Fair Value |
| Potentially Reasonable Buy | 0% | $152.01 | $204.26 | $172.10 |
| Potentially Good Buy | 5% | $144.41 | $194.05 | $163.50 |
| Potentially Strong Buy | 15% | $129.21 | $173.62 | $146.29 |
| Potentially Very Strong Buy | 25% | $108.30 | $153.19 | $129.08 |
| Potentially Ultra-Value Buy | 35% | $98.80 | $132.77 | $111.87 |
| Currently | $294.86 | -93.98% | -44.36% | -71.33% |
| Upside To Fair Value (Including Dividends) | -48.39% | -30.67% | -41.58% |
NVDA is just a 42% decline by year’s end from becoming a reasonable buy.
Nvidia‘s 2029 Consensus Return Potential From Its Fair Value Of $172.
FAST Graphs, FactSet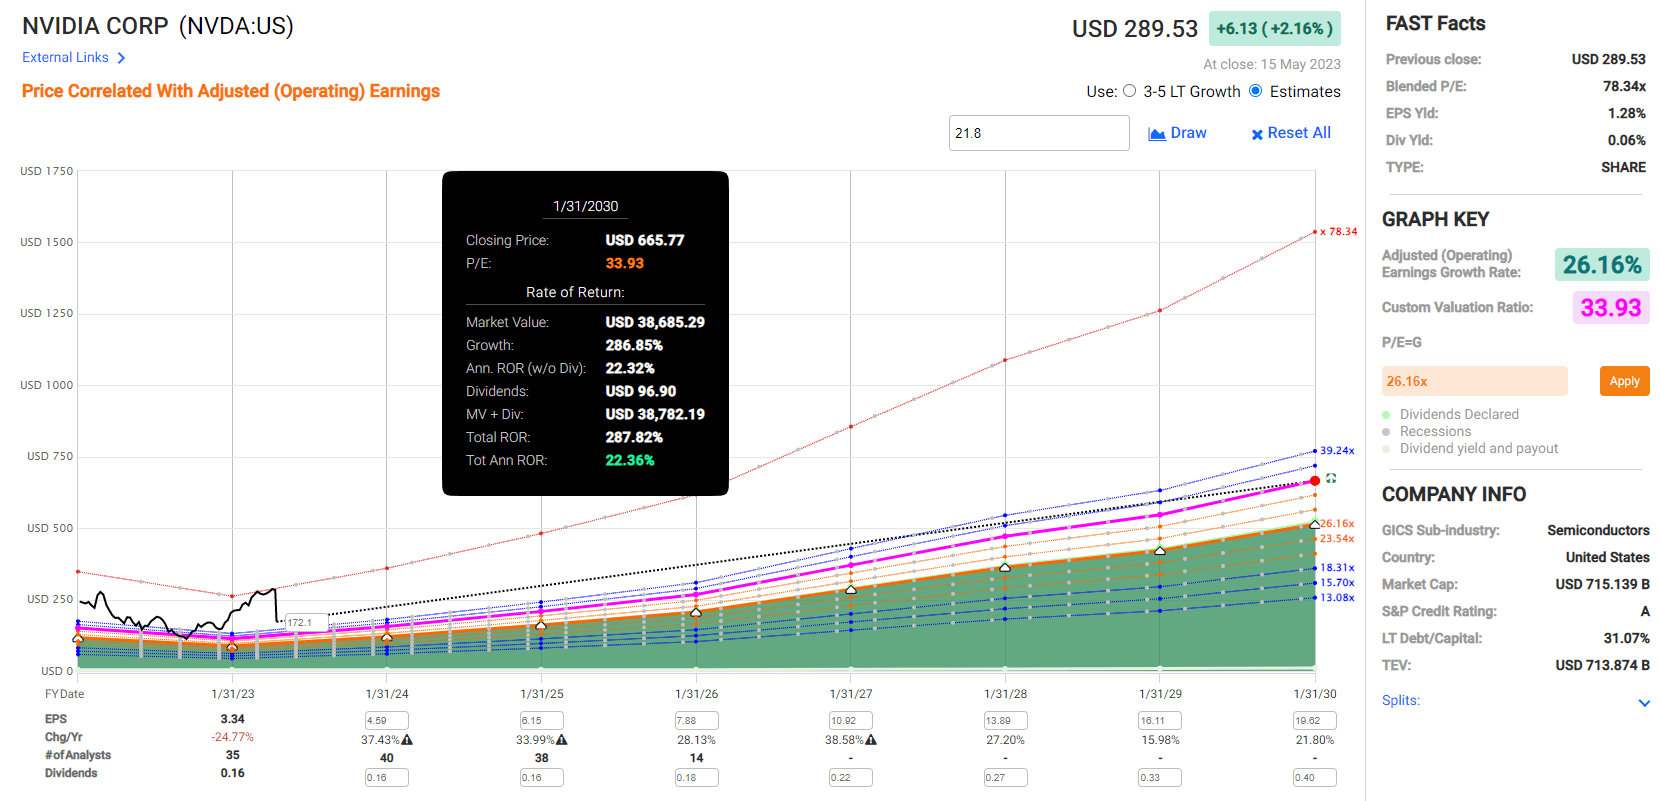
Nvidia‘s 2029 Consensus Return Potential From Its Good Buy Price Of $163.5
FAST Graphs, FactSet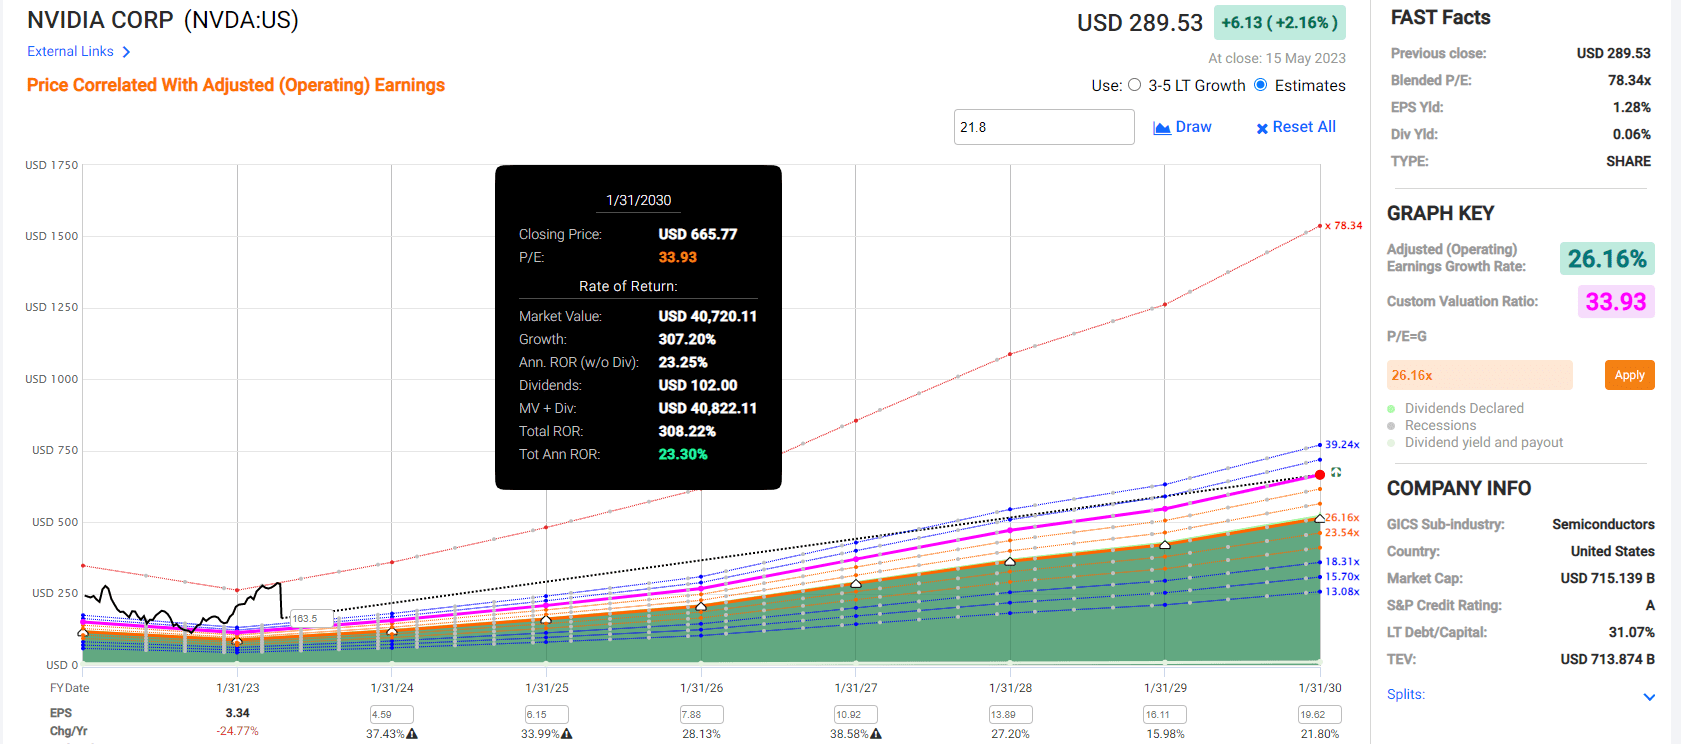
Nvidia‘s 2029 Consensus Return Potential From Its Strong Buy Price Of $146.29
FAST Graphs, FactSet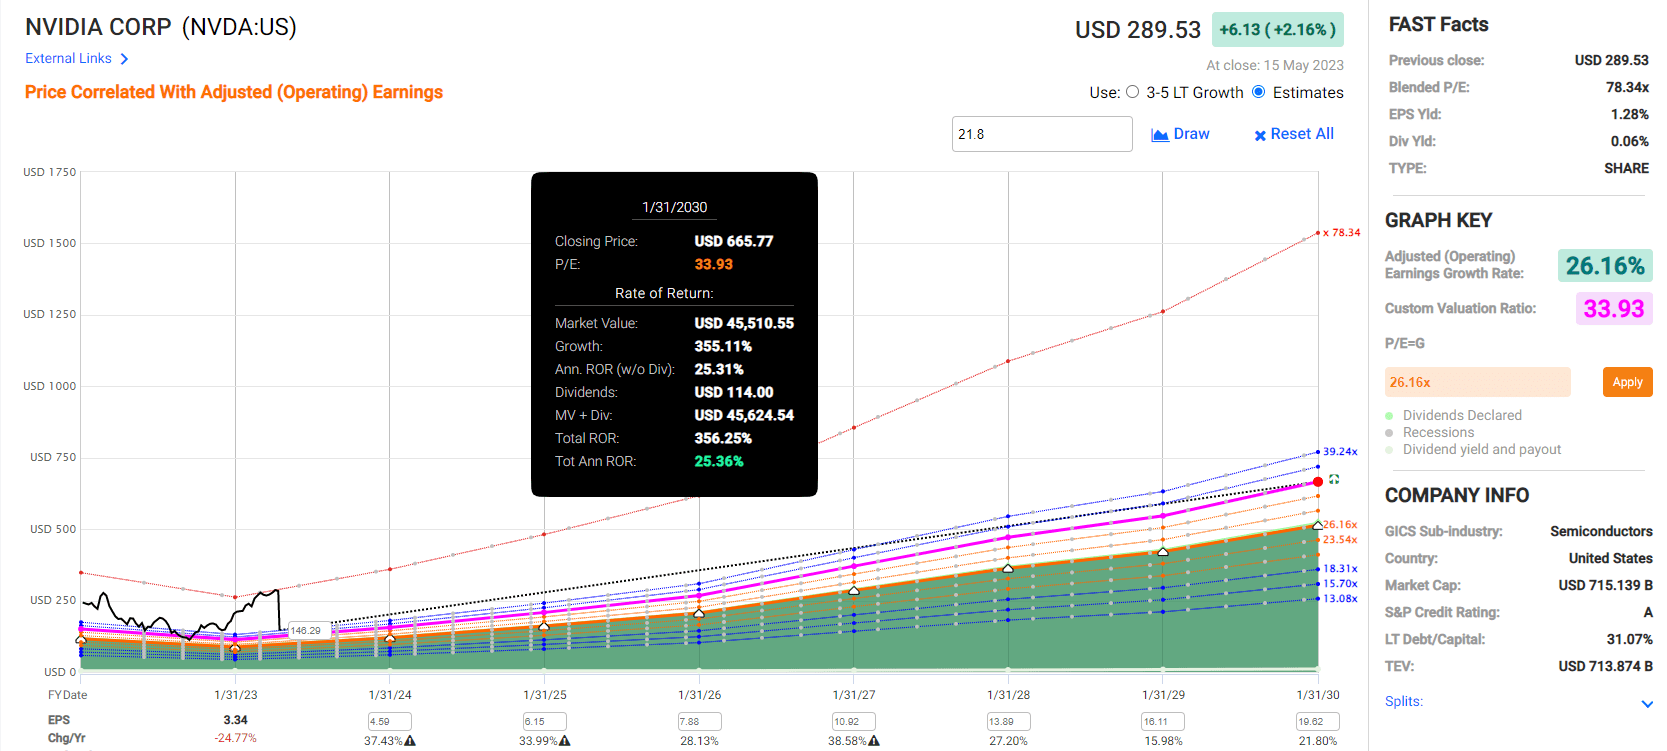
Nvidia‘s 2029 Consensus Return Potential From Its Very Strong Buy Price Of $129.08
FAST Graphs, FactSet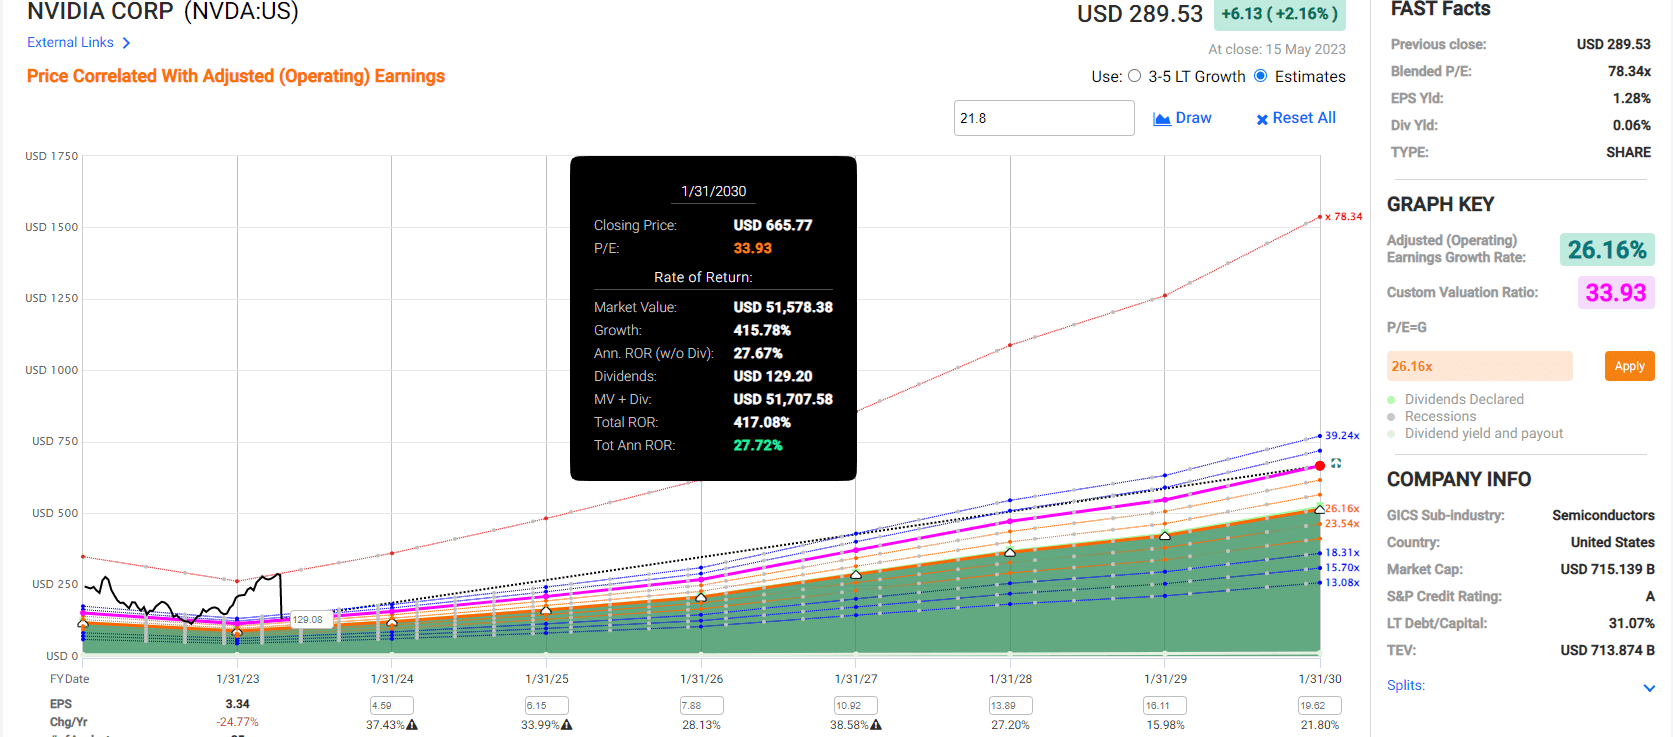
Nvidia‘s 2029 Consensus Return Potential From Its Very Strong Buy Price Of $111.87
FAST Graphs, FactSet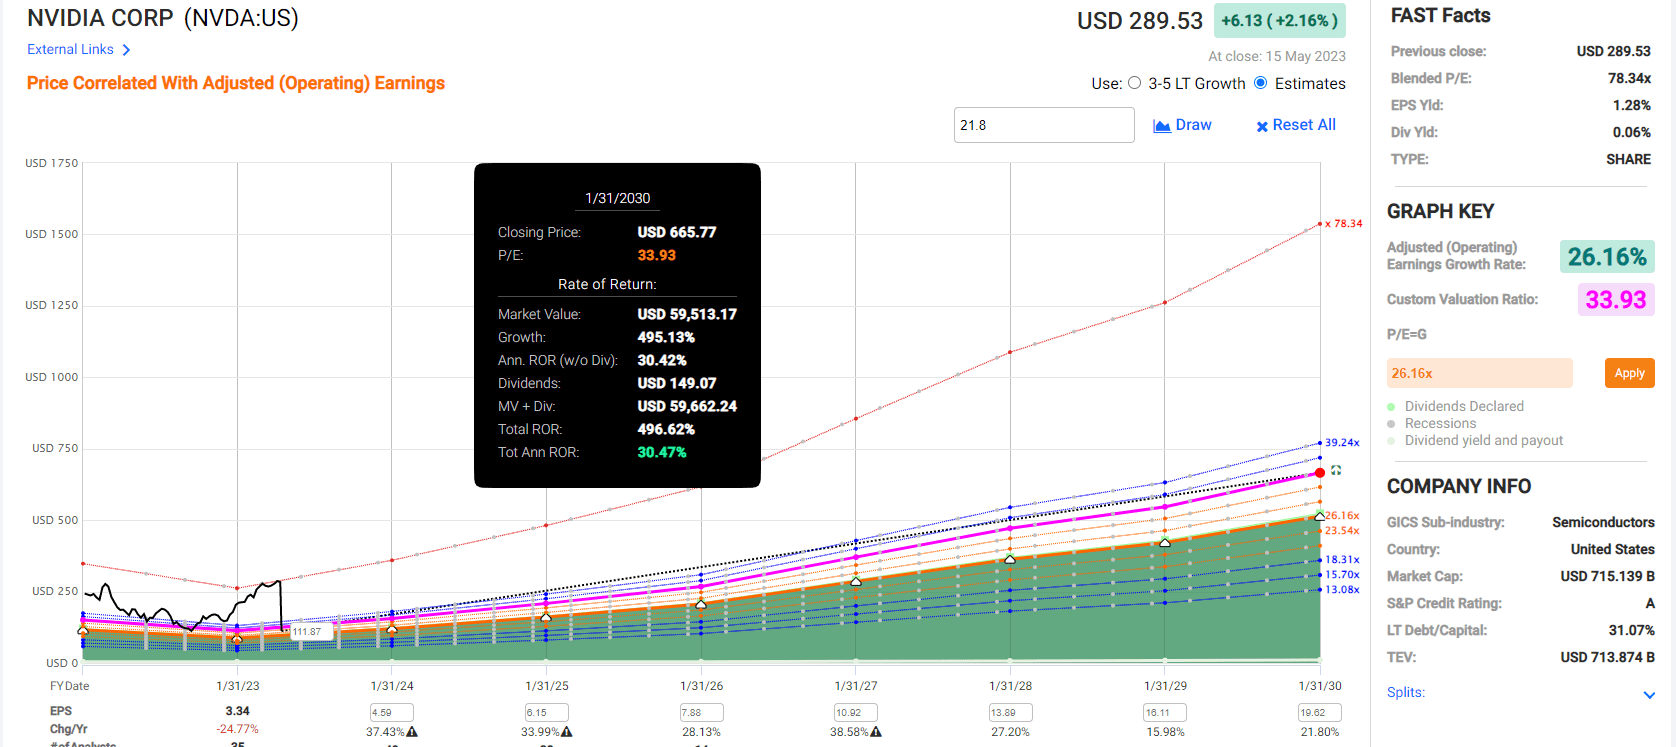
Only when the tide goes out do you see whose been swimming naked”. – Warren Buffett.
Today’s momentum-chasing, speculative NVDA bulls are as naked as the day they were born.
When it’s time to start pounding the podium, hitting the desk, banging the gavel, hammering your fist, thumping the podium, hammering the lectern, filling the hauler, loading the mini-van, packing the dump truck, cramming the super plane, jamming the oil tanker, overloading the cargo plane, packing the cruise ship and backing up the train on Nvidia, believe me, I’ll let you know. 😉
Analyst’s Disclosure: I/we have no stock, option or similar derivative position in any of the companies mentioned, and no plans to initiate any such positions within the next 72 hours. I wrote this article myself, and it expresses my own opinions. I am not receiving compensation for it (other than from Seeking Alpha). I have no business relationship with any company whose stock is mentioned in this article.
Seeking Alpha’s Disclosure: Past performance is no guarantee of future results. No recommendation or advice is being given as to whether any investment is suitable for a particular investor. Any views or opinions expressed above may not reflect those of Seeking Alpha as a whole. Seeking Alpha is not a licensed securities dealer, broker or US investment adviser or investment bank. Our analysts are third party authors that include both professional investors and individual investors who may not be licensed or certified by any institute or regulatory body.
—————————————————————————————-

Dividend Kings helps you determine the best safe dividend stocks to buy via our Automated Investment Decision Tool, Zen Research Terminal, Correction Planning Tool, and Daily Blue-Chip Deal Videos.
Membership also includes
-
Access to our 13 model portfolios (all of which are beating the market in this correction)
-
my correction watchlist
- my $2.5 million family hedge fund
-
50% discount to iREIT (our REIT-focused sister service)
-
real-time chatroom support
-
real-time email notifications of all my retirement portfolio buys
-
numerous valuable investing tools
Click here for a two-week free trial, so we can help you achieve better long-term total returns and your financial dreams.