Summary:
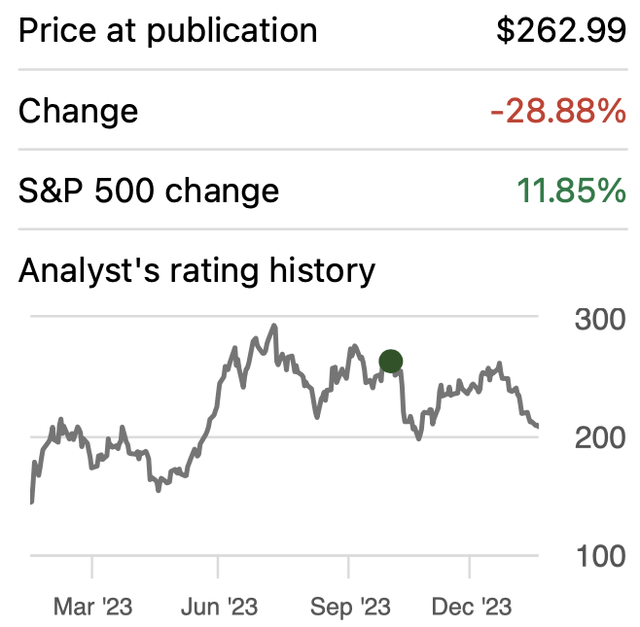
- Despite recent stock declines of 28.88%, attributed to falling margins and a subsequent 10% drop post-Q4 2023 earnings, I maintain a strong buy rating on Tesla, Inc. shares.
- The current dip in stock price renders Tesla undervalued, presenting an opportune moment for investment.
- Tesla’s charging network anticipates a 36% growth, while potential in the insurance and solar sectors indicates promising revenue streams.
- Financially, Tesla displays robust metrics with decreasing debt, surging cash reserves, and growing free cash flow.
- Valuation models project significant upside potential for Tesla, estimating a fair price per share of $311.12 to $358.89, offering considerable returns, despite risks including sales projections, CEO Elon Musk’s controversial conduct, and competition from Chinese car companies. Tesla’s commitment to price cuts and profitability aligns with its long-term vision of democratizing electric vehicles.
Spencer Platt
Thesis
In my previous article, I discussed many possible outcomes for Tesla, Inc. (NASDAQ:TSLA). Since that article, the stock has tanked by 28.88% because of the fall in margins.
After the Q4 2023 earnings release, TSLA stock tanked around 10% fueled by a miss on revenue and Tesla’s warning of a slowdown this year. Nevertheless, I will maintain my strong buy rating on Tesla stock, and I will demonstrate why this fall in stock price has made Tesla’s stock undervalued.
Overview
Tesla’s charging network ranks second in the U.S. with 33,000 locations, mainly comprising level 3 chargers, positioning the company as a dominant player in the electric vehicle (“EV”) charging market. This segment is projected to experience a substantial 36% growth rate, reflecting the increasing demand for electric vehicles nationwide.
Author’s Calculations based on many sources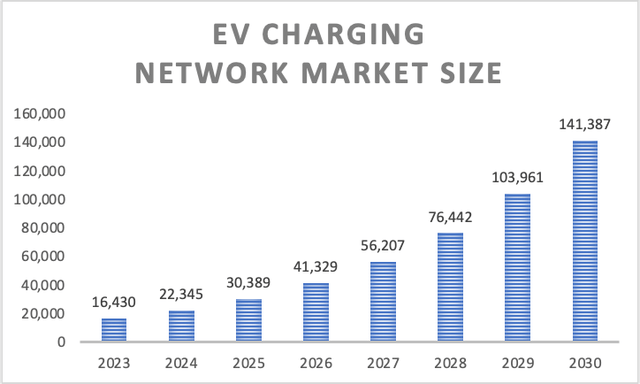
In terms of Tesla’s potential revenue streams, its insurance venture holds significant promise, with forecasts going as far as suggesting it could contribute up to 30% of the company’s profits. Despite initial challenges, such as website crashes upon launch and the reliance on safety scores derived from vehicle data to determine premiums, some people speculate that Tesla’s insurance business could bring around $250 billion in revenue at some point. Currently, the worldwide car insurance market is expected to grow at a CAGR of around 7.38%.
Furthermore, Tesla’s involvement in the solar business, offering products like solar panels, solar roofs, string inverters, and batteries, is expected to witness a global growth rate of 6.9% through 2029.
Author’s Calculations based on Fortune Business insights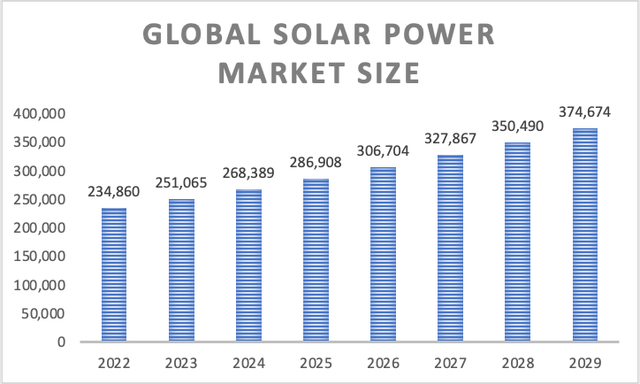
Financials
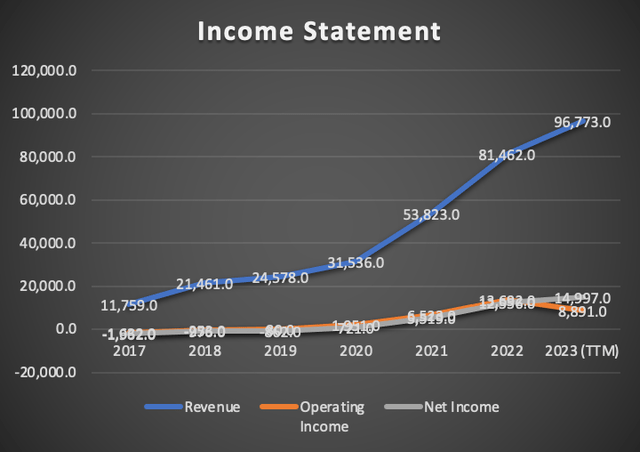
Tesla’s revenue has exhibited remarkable growth, averaging an annual pace of 120.5%. However, this growth has unmistakably begun to decelerate. If we examine the growth rates from 2021 to 2023, we observe an annual growth rate of approximately 27%. Since my previous article was released in Q2 2023, revenue has increased by 2.12%. Operating income plummeted by 29.7%, driven by price cuts. Nevertheless, net income surged by 23.1%, buoyed by a tax benefit of around $5.75 billion in Q4 2023.
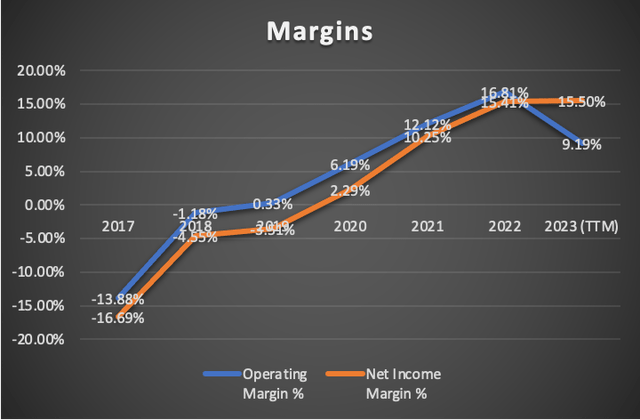
The operating margin, understandably, is lower than in Q2 2023 when my previous article was published, standing at around 9.19%, down from the previous 13.46%. However, aided by the substantial tax benefit, the net income margin ascended from 12.97% to 15.5%.
Nevertheless, what you can see is that even though Tesla has been slashing prices, the operating margin has grown as well as the net income margin.
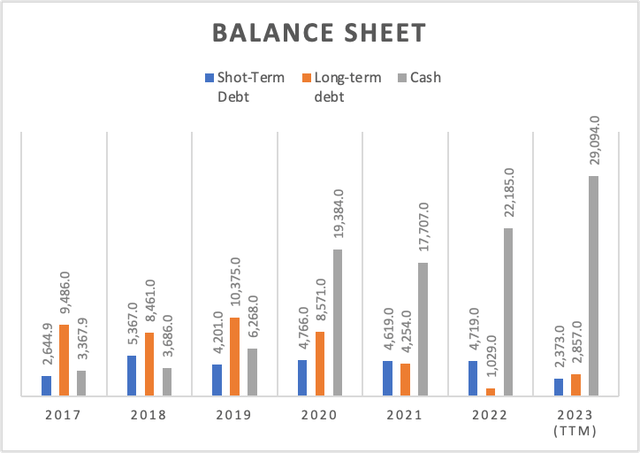
Tesla boasts excellent financial health. Total debt has been declining at an annual rate of -9.5%, while cash reserves have surged by an impressive 127.3% annually-an uncommon feat in the capital-intensive industry. Cash reserves have grown by 26%, whereas total debt decreased by approximately 10% from Q2 2023 to Q4 2023.
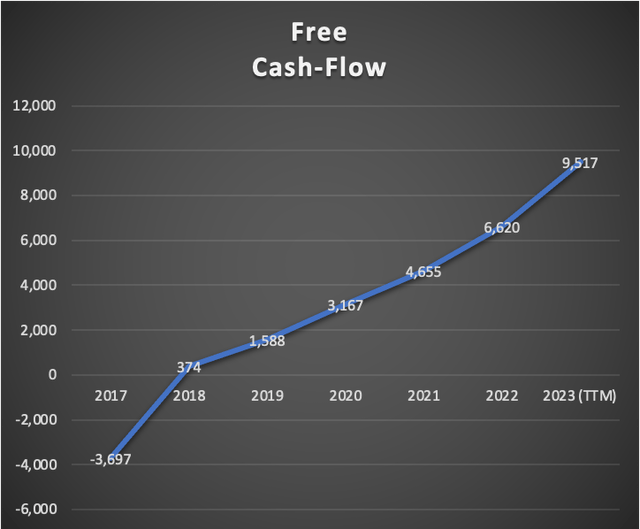
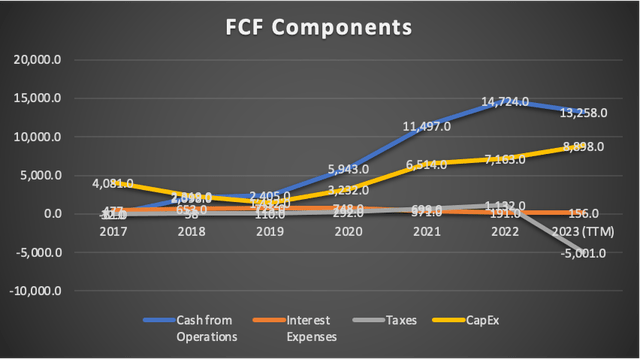
Furthermore, free cash flow (“FCF”) has seen consistent growth at an annual pace of 59.6% since 2017. In my previous article, this metric stood at $5.1 billion, but has since soared to $9.5 billion, marking an 86% increase. However, it’s important to note that this surge was largely attributed to the substantial $5.7 billion tax benefit.
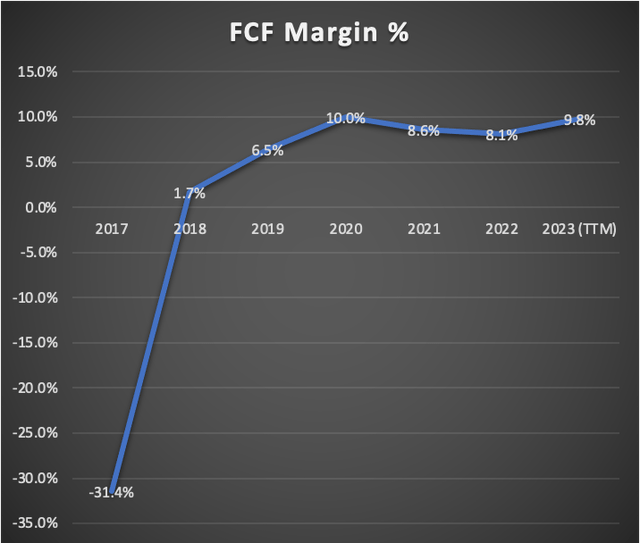
The free cash flow margin has naturally increased from 5.5% to 9.8%, aligning more closely with the margins recorded since 2020.
In summary, Tesla stands as a robust company, boasting ample cash reserves and minimal debt. This positions Tesla advantageously against competitors, affording the company the luxury to adjust car prices without the looming risk of defaulting on substantial debt obligations.
Valuation
This valuation will encompass two models. The first model will be derived from the estimates available at Seeking Alpha, focusing on both revenue and EPS. The second model will be based on my estimates of potential sales behavior resulting from price cuts, drawn from historical data.
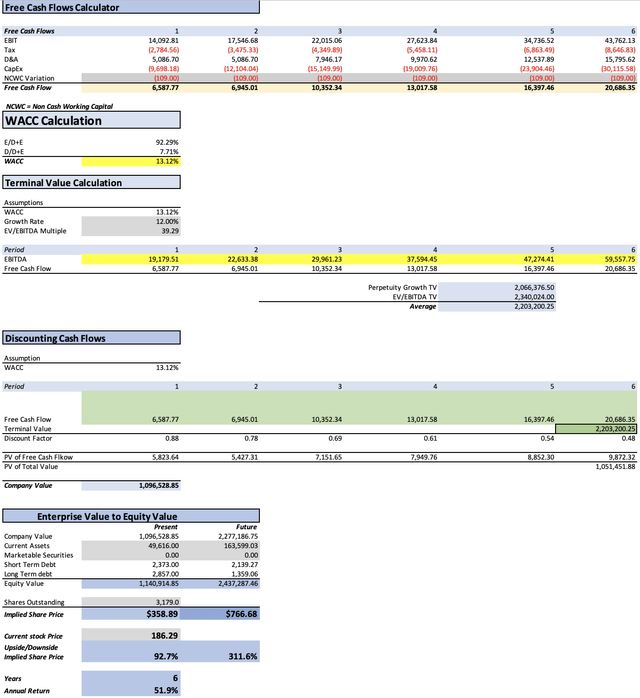
It’s important to note that the calculation of depreciation and amortization (D&A), interest expenses, and prospective capital expenditures relies on margins associated with revenue. This may be the sole assumption within this context, as Tesla maintains the flexibility to adjust its capital expenditures and interest expenses, potentially increasing long-term debt. Moreover, the WACC will be calculated from this table.
| TABLE OF ASSUMPTIONS | |
| (Current data) | |
| Assumptions Part 1 | |
| Equity Value | 62,634.00 |
| Debt Value | 5,230.00 |
| Cost of Debt | 2.98% |
| Tax Rate | 25.00% |
| 10y Treasury | 4.176% |
| Beta | 1.55 |
| Market Return | 10.50% |
| Cost of Equity | 13.98% |
| Assumptions Part 2 | |
| CapEx | 8,898.00 |
| Capex Margin | 9.19% |
| Net Income | 14,997.00 |
| Interest | 156.00 |
| Tax | -5,001.00 |
| D&A | 4,667.00 |
| EBITDA | 14,819.00 |
| D&A Margin | 4.82% |
| Interest Expense Margin | 0.16% |
| Revenue | 96,773.0 |
Analysts’ Estimates
As mentioned earlier, the first model will be based on available estimates for Tesla. These estimates can be found on Seeking Alpha under the “Earnings” tab for the Tesla stock ticker.
The estimates presented in the table below indicate that Tesla’s EPS is projected to increase by 206.18% by 2030. Furthermore, they suggest that Tesla will achieve approximately $334.8 billion in revenue by 2030. The projections also indicate that the net income margin is expected to remain around 10% through 2030. However, my projections only extend to 2029, as per available data.
It’s important to note that while the projections on Seeking Alpha extend to 2032, I have omitted 2031 and 2032 due to insufficient analyst support for those years. Additionally, following the release of Q4 2023 earnings, the EPS consensus for those years has been withdrawn.
| EPS Estimate | Revenue Estimate | Net Income | Net Income Margin | |
| 3.4 | 2024 | 109,830 | 10,808.60 | 9.84% |
| 4.9 | 2025 | 140,140 | 15,577.10 | 11.12% |
| 5.78 | 2026 | 160,340 | 18,374.62 | 11.46% |
| 6.46 | 2027 | 193,730 | 20,536.34 | 10.60% |
| 7.42 | 2028 | 233,070 | 23,588.18 | 10.12% |
| 9.37 | 2029 | 288,350 | 29,787.23 | 10.33% |
| 10.41 | 2030 | 334,830 | 33,093.39 | 9.88% |
| Revenue | Net Income | Plus Taxes | Plus D&A | Plus Interest | |
| 2024 | $109,830.0 | $10,808.60 | $13,510.75 | $18,807.44 | $18,984.49 |
| 2025 | $140,140.0 | $15,577.10 | $19,471.38 | $24,768.07 | $24,945.11 |
| 2026 | $160,340.0 | $18,374.62 | $22,968.28 | $30,700.87 | $30,959.35 |
| 2027 | $193,730.0 | $20,536.34 | $25,670.43 | $35,013.30 | $35,325.60 |
| 2028 | $233,070.0 | $23,588.18 | $29,485.23 | $40,725.32 | $41,101.03 |
| 2029 | $288,350.0 | $29,787.23 | $37,234.04 | $51,140.08 | $51,604.91 |
| ^Final EBITA^ |
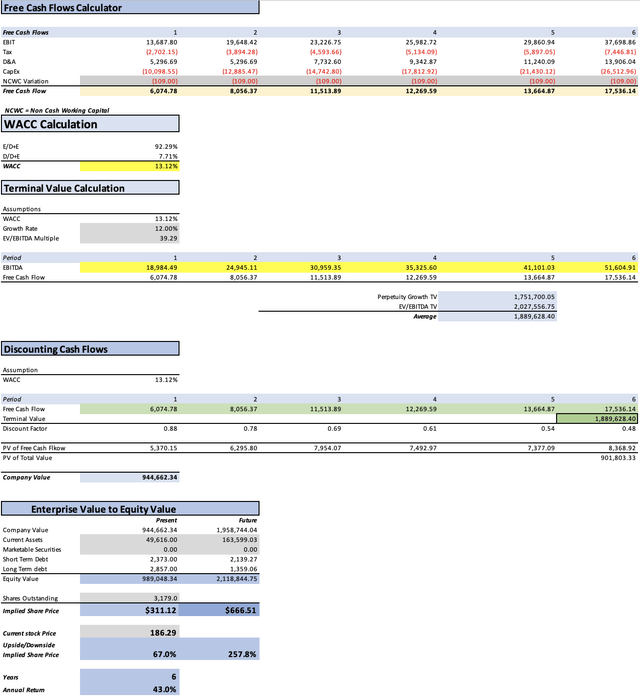
According to the available estimates, Tesla is anticipated to be fairly priced at $311.12, indicating an upside of 67%. Moreover, if the components of equity continue to grow at the same pace observed from 2017 to 2023, the future price of the stock could reach approximately $666.51. This projection implies annual returns of around 43% through 2029.
My Estimates
The second model comprises my estimates. As illustrated in the table, it outlines the anticipated sales of Tesla, influenced by price reductions. According to my projections, these cuts could amount to around 5.3% annually, aiming to align with Tesla’s goal of offering $25,000 vehicles.
It’s noteworthy that the average price cuts observed from 2019 to 2022, averaging 7.7%, resulted in an average sales growth of 50.2%.
| Average Sales Price (In USD) | Units Sold (Thousands of cars) | Change in price % | Change in Units Sold % | |
| 2019 | 55.0 | 367.2 | -17.3% | 50.4% |
| 2020 | 48.0 | 499.0 | -12.7% | 35.9% |
| 2021 | 61.0 | 935.5 | 27.0% | 87.5% |
| 2022 | 58.0 | 1,313.86 | -4.9% | 40.4% |
| 2023 | 40.2 | 1,800.00 | -30.6% | 37.0% |
| 2024 | 38.1 | 2,421.00 | -5.3% | 34.5% |
| 2025 | 36.1 | 3,256.25 | -5.3% | 34.5% |
| 2026 | 34.1 | 4,379.65 | -5.3% | 34.5% |
| 2027 | 32.3 | 5,890.63 | -5.3% | 34.5% |
| 2028 | 30.6 | 7,922.90 | -5.3% | 34.5% |
| 2029 | 29.0 | 10,656.29 | -5.3% | 34.5% |
| 2030 | 27.4 | 14,332.72 | -5.3% | 34.5% |
| -7.7% | 50.2% |
Additionally, Tesla surpassed estimates by delivering 1.8 million cars, selling approximately 15,581 more vehicles than projected. Looking ahead to the 2024 outlook, which currently remains unavailable and is anticipated to be disclosed in the next earnings release (Q1 2024), as communicated by Vaibhav Taneja, Tesla’s CFO.
Taneja said then that Tesla was focused on “growing our volumes in a very cost-efficient manner,” and would provide 2024 guidance on the next earnings call.
To project the other two segments, I will continue using the percentage of revenue they represented in Q2 2023. Then, I will project them based on their respective market CAGR, which is 7.38% for services (excluding the charging network & others) and 6.9% for solar.
| Sales of Vehicles | Service & Other | Solar | |
| 2023 | $72,432.0 | $7,243.0 | $5,112.0 |
| 2024 | $92,233.4 | $7,777.5 | $5,464.7 |
| 2025 | $117,448.0 | $8,351.5 | $5,841.8 |
| 2026 | $149,555.8 | $8,967.9 | $6,244.9 |
| 2027 | $190,441.2 | $9,629.7 | $6,675.8 |
| 2028 | $242,503.8 | $10,340.4 | $7,136.4 |
| 2029 | $308,799.1 | $11,103.5 | $7,628.8 |
| 85% of Revenues | 8.5% of Revenues | 6% of Revenues |
| Revenue | Net Income | Plus Taxes | Plus D&A | Plus Interest | |
| 2024 | $105,475.6 | $11,138.23 | $13,922.78 | $19,009.48 | $19,179.51 |
| 2025 | $131,641.3 | $13,901.32 | $17,376.65 | $22,463.35 | $22,633.38 |
| 2026 | $164,768.5 | $17,399.56 | $21,749.45 | $29,695.62 | $29,961.23 |
| 2027 | $206,746.6 | $21,832.45 | $27,290.56 | $37,261.17 | $37,594.45 |
| 2028 | $259,980.5 | $27,453.94 | $34,317.43 | $46,855.32 | $47,274.41 |
| 2029 | $327,531.4 | $34,587.32 | $43,234.15 | $59,029.76 | $59,557.75 |
| ^Final EBITA^ |
This model presents more optimistic outcomes compared to the previous one, indicating a fair price per share of approximately $358.89, translating to a 92.7% upside from the current stock price of $186.29. Furthermore, the projected future price for 2029 is approximately $766.68, suggesting annual returns of around 51.9%.
Margins
The narration regarding “falling margins” is incomplete. Tesla’s recent drop in margins occurred rapidly due to the immediate effects of price cuts. However, considering historical data (available in the financials section of this article), it becomes evident that Tesla has actually increased its operating margin over time. Therefore, it is incorrect to assume that Tesla’s operating margins will suddenly plummet to 1-3% and remain at that level indefinitely.
Electrek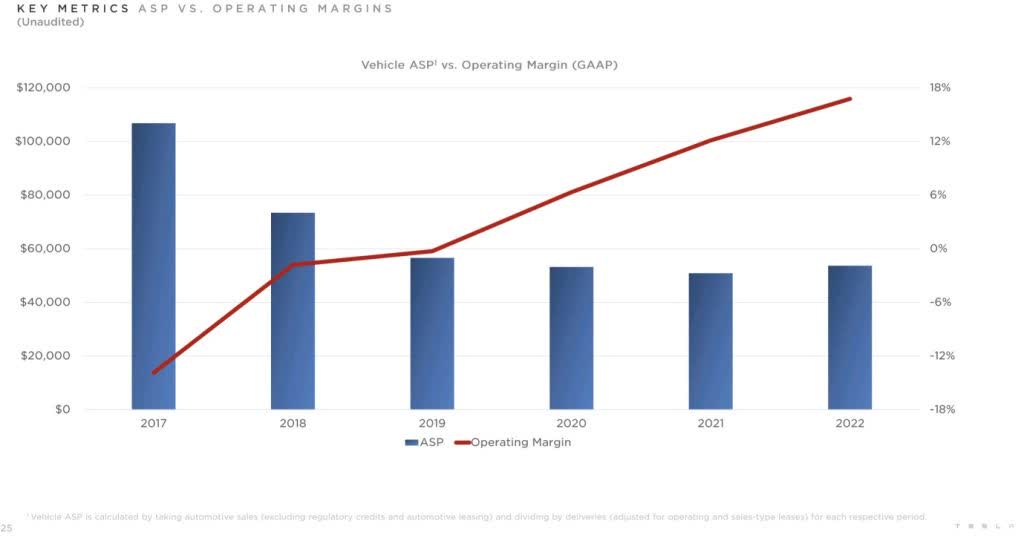
What about BYD
BYD Company Limited (OTCPK:BYDDF) is closely comparable to Tesla for two main reasons: 1) cheaper cars; and 2) government support and Chinese preference for national products.
Observing BYD’s operating margins, it’s apparent that its operating margin is around 5.18%, with a net income margin of approximately 4.9%. This illustrates the first reason behind BYD’s affordability: the company is willing to sacrifice earnings. Additionally, BYD, along with most of its EV counterparts in China, enjoys backing from the Chinese Government through subsidies, stock purchases, and access to cheap credit. An important distinction is that BYD manufactures its own batteries, a practice Tesla does not currently undertake. However, Tesla is developing a lithium refinery in Texas set to be operational by 2025, potentially enabling Tesla to match BYD’s pricing in the future. Consequently, both brands may converge in pricing, with consumers likely favoring Tesla due to its luxury brand perception, a distinction BYD lacks as Chinese products are often associated with inferior quality.
Tesla boasts one of the largest charging networks globally, and with numerous players already saturating the market, there’s little incentive for new entrants. Consequently, BYD has opted to collaborate with Shell plc (SHEL) & many other EV charging networks instead of developing its own charging infrastructure, leaving this market firmly within Tesla’s grasp. Remember that partnerships can be broken.
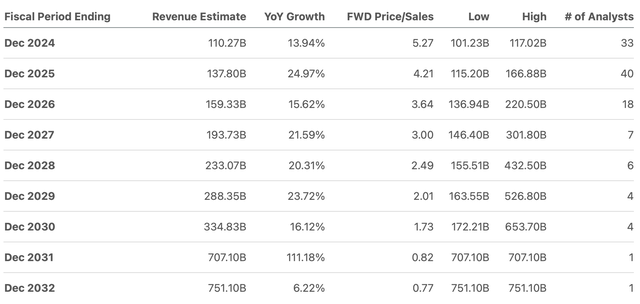
Looking at estimates for BYD, it’s clear they’re projected to generate significantly less revenue than Tesla by 2030, with Tesla forecasted to reach around $330 billion in revenue. BYD’s revenue is estimated to grow at a CAGR of around 20% through 2030, while Tesla is expected to grow at around 35%. Therefore, the expectation that BYD will bankrupt Tesla is unfounded. Moreover, Tesla remains a hotbed of innovation.
BYD Revenue Estimates (Seeking Alpha) Tesla Revenue Estimates (Seeking Alpha)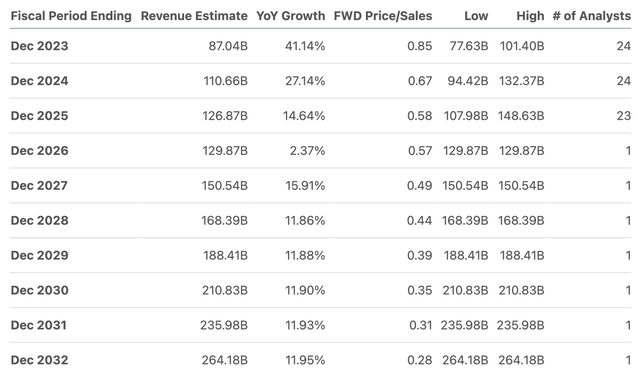
Risks to Thesis
The primary risk associated with my estimates is the possibility that Tesla may not achieve the anticipated sales volume. Essentially, Tesla is striving to emulate Toyota Motor Corporation (TM).
I believe we should have greater confidence in Tesla, given its track record of avoiding bankruptcy on multiple occasions. This should reassure investors of Tesla’s adeptness at reducing prices while maintaining profitability.
Another risk pertains to CEO Elon Musk’s somewhat controversial behavior. Instances of this have led to issues in Europe, where the company is grappling with trade unions. Such tensions are particularly concerning in Europe, a key consumer market globally.
Additionally, there’s the risk posed by Chinese car companies, as the Chinese state has demonstrated its willingness to support domestic companies through various means, such as providing cheaper credit or purchasing their stock. Unlike Tesla, these companies have government backing to mitigate the risks of bankruptcy.
I don’t perceive price cuts as a significant risk, as this aligns with Musk’s primary objective of selling $25,000 in electric cars and potentially expanding into buses and trucks. Investors who believed that Tesla would maintain prices around $70,000 may not have been paying attention.
Conclusion
In conclusion, despite Tesla’s recent 28.88% stock decline attributed to the immediate effect of price cuts which caused margins to drop and a subsequent 10% drop post-Q4 2023 earnings release, I maintain a strong buy rating on the company. The dip in stock price has rendered Tesla undervalued, presenting an opportune moment for investment. Tesla’s charging network, which operates in a market expected to deliver 36% growth, and its potential in the insurance and solar sectors indicate promising revenue streams. Financially, Tesla exhibits robust metrics with decreasing debt, surging cash reserves, and growing free cash flow. Valuation models suggest significant upside potential, with estimates projecting a fair price per share of $311.12 to $358.89, offering considerable returns. Risks include Tesla’s sales projections, Elon Musk’s controversial conduct, and competition from Chinese car companies, yet Tesla’s commitment to price cuts and profitability aligns with its long-term vision of democratizing electric vehicles.
Editor’s Note: This article discusses one or more securities that do not trade on a major U.S. exchange. Please be aware of the risks associated with these stocks.
Analyst’s Disclosure: I/we have no stock, option or similar derivative position in any of the companies mentioned, but may initiate a beneficial Long position through a purchase of the stock, or the purchase of call options or similar derivatives in TSLA over the next 72 hours. I wrote this article myself, and it expresses my own opinions. I am not receiving compensation for it (other than from Seeking Alpha). I have no business relationship with any company whose stock is mentioned in this article.
Seeking Alpha’s Disclosure: Past performance is no guarantee of future results. No recommendation or advice is being given as to whether any investment is suitable for a particular investor. Any views or opinions expressed above may not reflect those of Seeking Alpha as a whole. Seeking Alpha is not a licensed securities dealer, broker or US investment adviser or investment bank. Our analysts are third party authors that include both professional investors and individual investors who may not be licensed or certified by any institute or regulatory body.

