Summary:
- Intel’s stock price has declined by more than 50% in 2024 due to weak revenue growth, product delays, and intense competition.
- 2025 looks more promising with the launch of Intel’s new Lunar Lake and Arrow Lake for AI PCs which could boost the DCAI segment recovery.
- While Intel’s history of product delays impacted its market share and revenue, collaboration with TSMC on 3nm chips has closed the technology gap.
- Given the huge decline in it share price, we see a huge buying opportunity for the company as it recovers moving forward.
tupungato
In our previous analysis of Intel Corporation (NASDAQ:INTC), we highlighted our expectations of improvements in the company’s growth prospects in the second half of the year and going into 2025 due to factors such as the growth recovery in the PC and server end markets, as well as new developments involving Intel’s Ultra processors for AI PCs and Gaudi data center GPUs.
Since our last coverage, Intel’s stock has suffered a large decline of 37%, particularly following its previous Q2 earnings release where its stock dropped by 26%, the second-worst daily decline in its history, thus we examine possible factors behind the slump. Firstly, we examined whether it could be due to revenue growth performance. We analyzed its performance in Q3 2024 YTD in comparison with our full-year forecasts previously and determined whether the company continues to struggle toward recovery. Moreover, we then analyze if Intel had suffered from product delays and how the product delays have impacted Intel’s share price revenue, technological advantage, and market share. Finally, we analyze the company’s financials in Q3 2024 YTD compared with our forecasts and identify the reasons for the drag on its total profitability.
Revenue Growth Deceleration Throughout 2024
Firstly, we examine Intel’s revenue performance and determine why the company’s growth decelerated from a strong start in Q1 with an 8.61% YoY growth to -0.90% in Q2 and a sharper contraction of -6.17% in Q3, for a total flattish Q3 YTD revenue growth of 0.05%, underperforming our previous growth forecasts of 9.5% YoY for the full year.
We compiled the company’s growth performance by segments below and compared its Q3 YTD performance with our previous forecasts to determine the reasons for the slowdown of growth, whether they are attributable to market-specific or due to internal competitiveness issues.
|
Intel Revenue Breakdown By Segment ($ bln) |
Q1 2024 |
Q2 2024 |
Q3 2024 |
Q3 2024 YTD |
Previous Full-Year Forecast |
|
Client Computing Group |
7.53 |
7.41 |
7.33 |
22.27 |
33.21 |
|
Growth % YoY |
30.6% |
9.3% |
-6.8% |
9.1% |
13.5% |
|
Datacenter and AI |
3.04 |
3.05 |
3.35 |
9.43 |
16.70 |
|
Growth % YoY |
4.7% |
-3.5% |
8.9% |
3.3% |
7.6% |
|
Network & Edge |
1.36 |
1.34 |
1.51 |
4.22 |
6.47 |
|
Growth % YoY |
-8.4% |
-1.5% |
4.2% |
-2.0% |
10.1% |
|
Mobileye |
0.24 |
0.44 |
0.49 |
1.16 |
2.22 |
|
Growth % YoY |
-47.8% |
-3.1% |
-25.5% |
-19.3% |
6.7% |
|
Intel Foundry (IFS Previously) (After Eliminations) |
0.02 |
0.07 |
0.06 |
0.14 |
0.06 |
|
Growth % YoY |
-86.4% |
-71.4% |
-82.4% |
-79.3% |
-0.2% |
|
Other Revenue |
0.54 |
0.53 |
0.55 |
1.62 |
0.64 |
|
Growth % YoY |
-45.4% |
-45.3% |
-8.5% |
-43.6% |
|
|
Total |
12.72 |
12.83 |
13.28 |
38.84 |
59.30 |
|
Growth % YoY |
8.61% |
-0.90% |
-6.17% |
0.05% |
9.5% |
Source: Company Data, Khaveen Investments
Based on the table, Intel’s revenue growth had slowed down throughout 2024 following a strong start in Q1, the main factor contributing to this is the slowdown of the CCG segment’s growth from 30.6% YoY to a decline of 6.8% in Q3. Its total CCG segment growth in Q3 YTD of 9.1% is slightly lower than our forecasts of 13.5% for the full year. On the other hand, its DCAI segment growth accelerated in Q3, bringing its Q3 YTD total segment growth to 3.3%, not too far from our forecasts of 7.6% for the year. Despite this, the company’s Q3 YTD growth is 9.4% lower than our forecasts. This is primarily due to the large underperformance of segments such as Network & Edge, Mobileye, and Other Revenue. While Network & Edge’s growth has improved in Q3, its Q3 YTD result is still well below our forecast of 10.1%. Mobileye revenues showed a reverse to its recovering trend in Q3 compared to Q2 with a decline of 25.5%. Notably, the company had reclassified its Programmable Solutions Group (FPGA revenue) from its DCAI segment to Other Revenue as it is reportedly planning to spin off the company, leading to $1.62 bln in revenue in Q3 YTD, but representing a steep decline in growth as its Altera FPGA revenues declined by 54% in Q3 YTD 2024 at $1.1 bln. We examine each of the main segments further below.
Client Computing Group
Starting with CCG, its largest segment (57% of revenue), revenue growth slowed down in Q2 and declined YoY in Q3. Q2 CCG revenue growth slowed down moderately to 9.3% YoY, as management highlighted that license restrictions for its chips to China had impacted growth in addition to expected wafer-level assembly supply problems for its core ultra-based AI PCs, previously highlighted in its Q1 earnings call. In Q1, the US revoked Intel’s export license to “ship chips used for laptops and handsets to sanctioned Chinese telecoms equipment maker Huawei Technologies”. The loss of license from Huawei had a negative revenue impact of $500 mln and “caused Intel to revise its expected revenue range for 2024, from $12.5 billion to $13.5 billion, to now $12.5 billion to $13 billion”.
Management had also guided that Q3 CCG will be impacted by “modest inventory digestion” and “continued modest negative impact from export controls”. From its latest briefing, management did confirm that it “worked down their inventory as expected” explaining its slowdown. Based on its quarterly report, this particularly affected its desktop CPU shipments as “Desktop volume decreased 26% in Q3 2024 primarily due to customers tempering purchases to reduce existing inventories”.
Datacenter and AI
Intel’s DCAI revenues showed gradual improvement through Q3, indicating it is on a recovering trend. Intel mainly operates in the traditional data center market, as management highlighted that they “need to invest in traditional server ecosystems ”, which is in contrast to AMD’s (AMD) AI-focused EPYC processors. In its latest briefing, management highlighted that “demand for traditional servers improved” which benefitted its growth. Specifically, “server volume increased 6% in Q3 2024”. That said, its DCAI revenue growth in Q3 YTD is still slightly lower than our forecasts of 7.6% for the full year. In Q3 YTD, DCAI’s “server volume decreased 11% in YTD 2024 due to lower demand in a competitive environment”. This is as Intel’s data center CPU market share has been falling, with a decline of 5.6% to 76.4% compared to AMD’s market share of 23.6% according to Mercury Research.
Network and Edge
NEX revenues underperformed our forecasts by a large 12% with a growth of -2.0% in Q3 YTD, we previously highlighted the market headwinds faced with “significant declines in the 5G market”, whereby “telecom companies’ capex spending declined mainly due to the normalization of 5G buildout” in 2023. This weakness continued going into 2024 and was highlighted in its quarterly report, attributing its decline “primarily due to 5G customers tempering purchases to reduce existing inventories”. We had previously expected a recovery for the NEX segment, due to the forecasted recovery in telecom capex, however, we believe that the NEX segment might recover slower than expected as telecom capex is expected to decline – 4.7% YoY in 2024. For example, top telecom companies by market share such as Verizon (VZ) guided 2024 capex spending to decline –8.1% YoY but expect higher capex in 2025 which could in turn bode well for the NEX segment’s outlook. Similarly, AT&T (T) has also guided capex to decline – 8.7% YoY but indicated capex could rise to $22 bln (23% increase compared to TTM) and T-Mobile (TMUS) guided capex to decline moderately by –9.2% YoY.
Mobileye
Mobileye (MBLY) revenues declined significantly by -19.3% for Q3 YTD and underperformed our forecasts by 26%. This is as the automotive market continues to face growth weakness since 2023, as “production of automotive vehicles exceeding demand, leading to a cutback of chip orders as automakers draw down existing inventories”. Despite a slight improvement in Q2 revenues, Mobileye’s revenues had a sharper decline in Q3 on a YoY basis, however, Mobileye’s revenues grew 11% sequentially and management pointed it as a “sign that inventory” at its customers “has normalized”. Furthermore, management stated that they “expect 2025 to benefit from resolution of the inventory digestion that happened in the first half of 2024”, indicating a more positive outlook in 2025. However, another factor that has impacted Mobileye is “near-term volume challenges stemming from market dynamics almost exclusively related to China”, which may affect its H2 2024 growth as they “seen a decline in orders for the second half of 2024 from Chinese OEMs” as highlighted by its management in its previous briefing. China is the largest geographic market for Mobileye, accounting for 26% of its total revenue. Positively, China automotive sales had picked up following a 5-month decline in September this year with a 4.3% growth due to new government subsidies, followed by an 18% growth in November, indicating signs of a market recovery which could
Intel Foundry
We noted that the company had changed its reporting structure to Intel Foundry, which consists “substantially of process engineering, manufacturing, and foundry services groups that provide manufacturing, test, and assembly services to our Intel Products business and to third party customers”. IF reported revenues are $13 bln, however, Intel has $12.9 bln in intersegment revenues which are mainly attributed to IF, therefore its external IF revenues are insignificant to Intel’s total revenues (0.4% of total). Previously, we believed the growth opportunities of IF external revenues were strong, as we highlighted in our previous analysis that it had “secured 6 customers for its new Intel 18A process and its total contract value for Intel Foundry increased to $15 bln”. Additionally, the company had highlighted that they are accelerating the transition of “its Intel 4 and Intel 3 wafers”, to allow its technology development “team more focus on their capital on 18A as well as then 14A and 10A”, whereby the 14A node (expected in 2027) is touted to provide 15% power per performance improvement. Moreover, management previously stated that they are well into the “ramp of Intel 4, Intel 3, and Intel 20A has been ready for production next quarter”. Additionally, management stated that they are “creating clearer separation for Intel Foundry by establishing the business as an independent subsidiary” which could allow it “to evaluate independent sources of funding and optimize the capital structure of Intel Foundry”.
Outlook
|
Intel Revenue Forecasts ($ bln) |
2024F |
2025F |
2026F |
|
Client Computing Group |
30.19 |
34.91 |
36.56 |
|
Growth % YoY |
3.2% |
15.6% |
4.7% |
|
Datacenter and AI |
13.00 |
14.74 |
16.14 |
|
Growth % YoY |
-16.3% |
13.4% |
9.5% |
|
Network & Edge |
5.54 |
6.45 |
7.51 |
|
Growth % YoY |
-4.1% |
16.5% |
16.5% |
|
Mobileye |
1.73 |
2.17 |
2.70 |
|
Growth % YoY |
-16.6% |
24.9% |
24.9% |
|
Intel Foundry (After Eliminations) |
0.18 |
0.45 |
1.13 |
|
Growth % YoY |
-80.8% |
148.3% |
148.3% |
|
Other Revenue |
2.16 |
0.64 |
0.64 |
|
Total |
52.80 |
59.36 |
64.68 |
|
Growth % YoY |
-2.6% |
12.4% |
9.0% |
Source: Company Data, Khaveen Investments
Overall, Intel’s revenue growth in 2024 YTD has been quite disappointing, which we primarily attribute to continued weakness in the 5G chip market affecting its NEX segment, slowing growth in the CCG segment amid new export restrictions and underperformance in DCAI as the company faces intense competition against AMD. We updated our revenue forecasts based on its Q3 YTD results by segment and factored in management guidance for its total revenues to decline by 10.4% YoY in the midpoint, leading us to derive our revised revenue growth forecasts of -2.6% for the full year compared to our initial forecast of 9.5%. Note that in our table above, our DCAI forecast is -16.3% due to the reorganization of the segment whereby Altera of the PSG segment revenue ($1.1 bln in Q3 YTD) has been shifted to Other Revenue as explained above. Looking ahead, however, we believe several positive catalysts may support a better growth outlook in 2025. For CCG, we highlight the launch of Intel’s new Lunar Lake and Arrow Lake for AI PCs and see signs of a recovery in the DCAI segment as its revenue growth has been rising since Q1 as the server end market improves. Furthermore, we highlighted that large telco players’ capex was guided to rise in 2025 which could bode well for the end market demand for 5G chips. In Mobileye, we see the segment stabilizing going into 2025 as “Tier 1 customers inventory levels” were highlighted to “return to normal orders by end of Q2”. We also continue to factor our projections for Intel Foundry’s revenue growth to increase significantly in 2025F onwards as it continues to scale up its external revenue.
Product Delays and Return to Process Leadership
In our past analyses, we have highlighted numerous occasions of Intel facing product delays which have impacted the company’s product launches and competitiveness. In the latest earnings briefing, management stated that “a key part of our strategy is returning to process leadership through disciplined execution of our roadmap”. Thus, we compile and examine Intel’s past product delays and determine the impact on the company, and analyze its process technology trend to identify whether it has improved or continues to lag behind competitors.
Past Delays
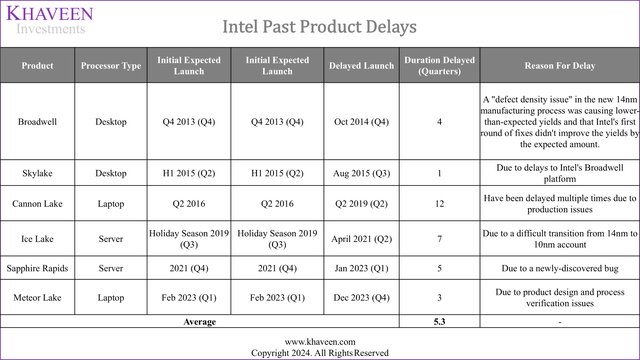
We compiled in the table below Intel’s delayed processors along with the type of processors between PC and server, as well as the duration of the delayed period based on the difference between its initial expected launch and actual launch date.
Company Data, Khaveen Investments
Intel’s processor launches faced delays such as with Broadwell (2013 to 2014), Skylake (early to late 2015), Cannon Lake (2016 to 2019), Ice Lake (2019 to 2021), Sapphire Rapids (2021 to 2023), and Meteor Lake (early to late 2023) due to issues such as low yields, production challenges, difficulties transitioning to advanced nodes, and unexpected bugs. Intel’s CPU delays had an average duration of 5.33 quarters across all identified launch delays in the past 10 years. The Cannon Lake product had the longest delay duration of 12 quarters followed by Ice Lake while Sky Lake had the shortest of only 1 quarter.
Impact of Delays on Revenue Loss of Market Share
To estimate the revenue loss due to lost market share of each product delay, we compiled the total shipments based on the PC and server markets. We analyzed the market share change of Intel during the affected period of the delay and calculated the estimated shipments impacted, as well as compiled the average ASP of processors of each product generation delayed estimating the revenue impact using our calculated shipments and its ASPs. We also compiled Intel’s actual revenues during the affected period and calculated it as % of Intel’s revenue.
|
Delay Impact |
Total Estimated Shipments (mln) |
Market Share Change |
Estimated Shipments Impacted (mln) |
ASP ($) |
Estimated Revenue Impact ($ mln) |
Intel Revenue (During the Delayed Period) |
% of Intel Revenue |
|
Broadwell |
376.88 |
1.20% |
4.52 |
321 |
1,452 |
54,983 |
2.6% |
|
Skylake |
136.04 |
1.20% |
1.63 |
180 |
294 |
27,660 |
1.1% |
|
Cannon Lake |
666.68 |
0.80% |
5.33 |
290 |
1,547 |
211,860 |
0.7% |
|
Ice Lake |
24.67 |
-4.10% |
-1.01 |
2,277 |
-2,303 |
156,570 |
-1.5% |
|
Sapphire Rapids |
25.11 |
-6.32% |
-1.59 |
1,836 |
-2,914 |
95,297 |
-3.1% |
|
Meteor Lake |
204.68 |
-2.40% |
-4.91 |
449 |
-2,204 |
54,228 |
-4.1% |
|
Average |
-0.7% |
||||||
Source: Company Data, Mercury Research, Khaveen Investments
Overall, we observed that Meteor Lake’s delay had the most negative impact on the company’s revenue at -4.1%, followed by Saphire Rapids and Ice Lake at -3.1% and -1.5% respectively. On the other hand, the revenue impact is shown to be positive across the delay of products such as Broadwell, Skylake, and Cannon Lake, this is due to a slight increase in market share across the processors’ respective delay periods. Overall, we derived an average revenue loss impact of -0.7% for Intel attributed to market share loss during the delay period.
Revenue Loss in Pricing
Furthermore, we analyzed the revenue loss in pricing by estimating it based on our compiled ASP data of each affected delayed product and compared it with the ASPs of each previous generation to derive the ASP difference. We then estimate the shipments impacted to Intel based on its market share during the period multiplied with the total PC and server market shipments as a proxy, as well as factored in an estimate for the % sales mix of each delayed product based on an assumption of 25% of equal distribution 4 generation years of CPUs. For example, the 10th-generation CPUs had been discontinued this year after launching in 2020. Based on our derived ASP difference and shipments, we calculate the revenue impact and as % of revenue below.
|
Delay Impact |
ASP (Product) ($) |
ASP (Previous Gen) ($) |
ASP Difference ($) |
Estimated Shipments Impacted (mln) |
Revenue Impact ($ mln) |
Intel Revenue (During the Delayed Period) ($ mln) |
% of Intel Revenue |
|
Broadwell |
321 |
211 |
110 |
65.6 |
7,214 |
54,983 |
13.1% |
|
Skylake |
180 |
216 |
-36 |
24.3 |
-881 |
27,660 |
-3.2% |
|
Cannon Lake |
290 |
338 |
-48 |
151.8 |
-7,251 |
211,860 |
-3.4% |
|
Ice Lake |
2,277 |
1,920 |
357 |
6.0 |
2,135 |
156,570 |
1.4% |
|
Sapphire Rapids |
1,836 |
2,277 |
-441 |
5.8 |
-2,564 |
95,297 |
-2.7% |
|
Meteor Lake |
449 |
434 |
15 |
37.1 |
539 |
54,228 |
1.0% |
|
Average |
1.0% |
||||||
Source: Company Data, Khaveen Investments
Based on the table, we derived an average revenue loss attributed to an ASP difference estimate of 1%, a negative impact on the company’s revenues. In particular, we derived the highest % loss for the Broadwell gen due to its significantly higher ASP compared to the Haswell gen. Notably, there is a negative revenue loss for Skylake and Cannon Lake, as these product gen’s ASPs are lower compared to the previous gen. Overall, our estimates indicate a minimal impact on Intel’s revenues at an average loss of 1% attributed to pricing.
Technology Loss in Process Technology
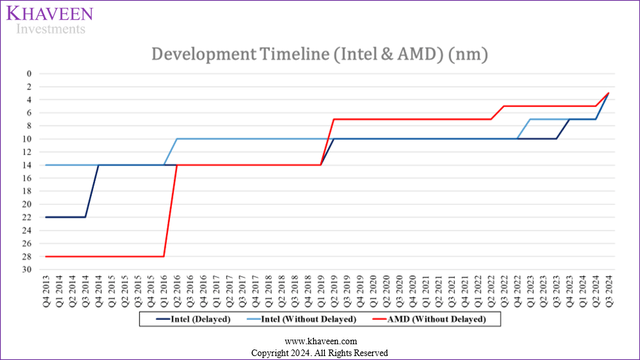
Additionally, we compiled a timeline for Intel’s process node technology across the past 44 quarters with and without the delay of its product launches and compared it with AMD’s node technology timeline throughout the same period.
Company Data, Khaveen Investments
Despite Intel having a delay for Broadwell until Q4 2014, the company was still leading in contrast with AMD at 28nm. In Q2 2016, AMD significantly advanced from 28nm to 14nm. If Intel’s Cannon Lake had been on schedule, Intel would have maintained its lead in process technology. However, Intel experienced significant delays with the launch of its 10nm Cannon Lake, pushing it back by 12 quarters to Q2 2019. This delay resulted in AMD catching up and a period during which AMD and Intel were on par. Most importantly, in Q2 2019, AMD took the lead with chips based on 7nm, surpassing Intel’s 10nm products. This technological advantage for AMD continued through Q2 2024, where we observed that Intel had been closing the gap to AMD with the help of TSMC (TSM), as the company launched its new Lunar Lake CPUs made by TSMC using its 3nm process and even its latest Arrow Lake CPUs. Furthermore, AMD is also expected to release 3 nm-based laptop CPUs in 2024.
Outlook
All in all, Intel has had a history of product launch delays with a total of 6 in the past 10 years due to issues ranging from defects to production issues. We believe Intel has been impacted in more recent years than before as it has had market share losses in PC and server markets for its Ice Lake, Sapphire Rapids, and Meteor Lake generations. Furthermore, we derived an average loss to Intel’s revenues over the past 10 years of product delays attributed to market share and pricing loss of 0.7% and 1% respectively, negatively impacting Intel’s revenues in the delayed periods. Furthermore, we also observed the delays had led to a technology gap between it and AMD, as AMD capitalized on the delays by gaining a process advantage over Intel. However, we note that Intel has closed the gap in 2024 following its internal process technology roadmap execution and help from TSMC to manufacture its latest chips using 3nm. Going forward, Intel’s roadmap indicates that it will switch back to its internal manufacturing process for its upcoming Lunar Lake PC CPUs in 2025. Furthermore, it was reported that Intel canceled Intel 20A so that it could focus more resources on the development of Intel 18A. Intel was reported to be progressing well as it is going “to sample 18A chips to customers in H1 2025 and start to ramp production at its Oregon fab in H2” next year. Therefore, we believe Intel’s execution of its process technology development roadmap has been well but not without challenges and external foundry help to bring it on par with AMD. We believe the success of its upcoming Intel 18A node is key for its plans to take the lead in terms of process technology.
Margins Are Dropped Due To Restructuring and Other Charges
Lastly, we analyzed the company’s profitability to determine whether the lower margins could be a factor in the negative market reaction. We compiled the company’s gross, operating, and net margins in the past 6 years as well as in Q3 2024 YTD below.
|
Earnings & Margins |
2018 |
2019 |
2020 |
2021 |
2022 |
2023 |
Q3 2024 YTD |
|
Earnings Before Interest & Taxes (EBIT) ($ mln) |
23,244 |
22,428 |
23,876 |
22,082 |
2,575 |
31 |
-1,881 |
|
Net Earnings ($ mln) |
21,053 |
21,048 |
20,899 |
19,868 |
8,014 |
1,689 |
-18,730 |
|
Gross Margin (%) |
61.73% |
58.56% |
56.01% |
55.45% |
42.99% |
40.04% |
38.8% |
|
EBIT Margin (%) |
32.81% |
31.17% |
30.66% |
27.94% |
4.08% |
0.06% |
-4.8% |
|
Net Margin (%) |
29.72% |
29.25% |
26.84% |
25.14% |
12.71% |
3.11% |
-48.2% |
Source: Company Data, Khaveen Investments
Intel’s profitability margins have suffered a decline since 2022 as we previously highlighted “its revenues contracted by double digits during the period; thus the period affected the companies’ economies of scale”. Additionally, the company’s R&D spending continued to increase from 17.4% of revenue in 2020 to 29.6% in 2023. In Q3 2024 YTD, the company’s profitability again declined significantly, with a net margin of -48.2%, thus we examine the reason for this further.
|
Profitability Margins |
Q2 2023 |
Q3 2023 |
Q4 2023 |
Q1 2024 |
Q2 2024 |
Q3 2024 |
|
Gross Margins (%) |
35.8% |
42.5% |
45.7% |
41.0% |
35.4% |
39.8% |
|
Net Margins (%) |
11.4% |
4.9% |
17.3% |
-3.0% |
-12.5% |
-125.3% |
Source: Company Data, Khaveen Investments
The company’s gross margins were relatively stable through Q3 2024 with only a minor decline of 2.7% compared to the same period last year. However, its net margins declined significantly to -125.3% in Q3 2024.
Company Data, Khaveen Investments
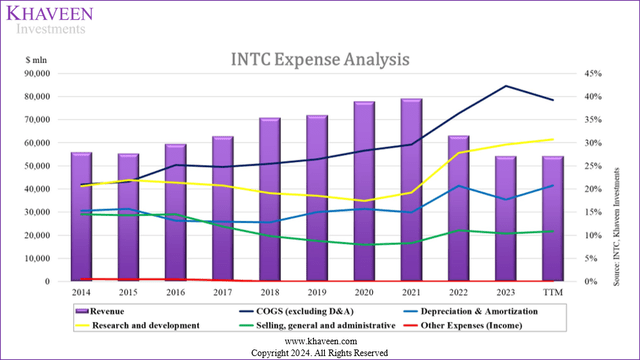
From the chart above of the expense analysis, the company’s COG % of revenue shows a decline in Q3 TTM while R&D, depreciation, and SG&A increased slightly, thus does not fully explain the sharp decline in profitability.
Operating Segments
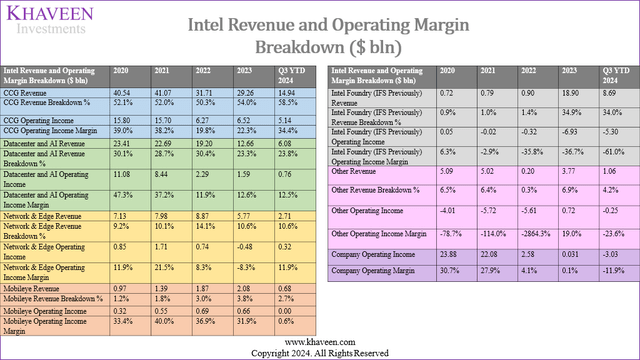
Company Data, Khaveen Investments
Examining the company’s operating margins by segment, particularly the Intel Foundry, shows a worsening decline over the years. The segment had a modest operating margin of 6.3%, which quickly deteriorated into losses (-2.9% in 2021) before worsening dramatically in 2022 (-35.8%). By 2023, the losses increased with a margin of -35.8%, and by Q3 2024, the operating margin had reached a staggering -61.0%.
|
Intel Foundry ($ bln) |
Q1 2023 |
Q2 2023 |
Q3 2023 |
Q1 2024 |
Q2 2024 |
Q3 2024 |
Q3 2023 YTD |
Q3 2024 YTD |
|
Revenue |
4.83 |
4.17 |
4.70 |
4.37 |
4.32 |
4.35 |
9.00 |
8.69 |
|
Operating Income |
-2.36 |
-1.87 |
-1.40 |
-2.47 |
-2.83 |
-5.84 |
-4.23 |
-5.30 |
|
Operating Income Margin |
-48.9% |
-44.8% |
-29.8% |
-56.6% |
-65.5% |
-134.3% |
-47.0% |
-61.0% |
Source: Company Data, Khaveen Investments
The table above shows Intel’s Foundry revenues and operating margin which has been negative in 5 out of the last 6 quarters, averaging –57.8%. Furthermore, operating income margins worsened through Q3 2024 to -134.3%.
However, based on the new accounting definitions from its quarterly report, intersegment revenue refers to when Intel Foundry satisfies performance obligations as “evidenced by the transfer of control of Intel Foundry products and services to the Intel Products businesses”. Intersegment revenue elimination refers to when intersegment revenues recorded at the end of the period are “eliminated for consolidation purposes”. Furthermore, operating losses refer to segment revenue subtracting expenses, which expenses “consists of direct expenses for technology development, product manufacturing and services provided by Intel Foundry to internal and external customers”. Therefore, the reason for the higher operating expenses in 2023 is due to the recategorization of the IF segment which included internal transactions. For example, based on its previous breakdown, Intel’s IFS segment (does not include internal transactions) operating profit was -$0.48 bln, which is 14.4x lower compared with its IF segment (includes internal transactions) 2023 operating profit of -$6.93 bln.
We compiled Intel’s IFS and IF 2023 breakdown by revenue, operating expenses, and operating losses to calculate its operating margins. We then further calculated the intercompany difference between IFS and IF to better analyze the impact of intercompany inclusion into IF.
|
2023 IFS and IF Intercompany Revenue and Operating Expenses ($ bln) |
IFS Segment (Excludes Internal Transactions) |
IF (Includes Internal Transactions) |
Intercompany Transactions (Difference between IFS and IF) |
|
Revenue |
0.95 |
18.91 |
17.96 |
|
Operating Expenses |
1.43 |
25.84 |
24.41 |
|
Operating Losses |
-0.48 |
-6.93 |
-6.45 |
|
Operating Margin |
-50.6% |
-36.6% |
-35.9% |
Source: Company Data, Khaveen Investments
Based on the table above, Intel Foundry revenue is significantly higher than Intel Foundry Services, due to the inclusion of $17.96 bln in intercompany revenue. Furthermore, IF operating expenses and operating losses are also higher than IFS, due to the inclusion of intercompany expenses and losses respectively. Notably, IF operating margins are substantially higher than IFS, due to higher intercompany margins of -36.0%, which improved IF operating margins. Therefore, we believe the previous IFS segment before recategorization was more reflective as it only accounted for external customers’ revenue, expenses, and profit margins, whereas the IF segments include revenues and expenses for internal production, which is consolidated with Intel’s financials due to the accounting for intersegment transactions.
Restructuring Charges and Other Expenses
Instead, we identified one of the main reasons for the lower margins in Q3 2024 YTD as being the Restructuring and other charges of $6.9 bln in Q3 2024, an increase of 540% compared to the same period a year ago, rising from 2.8% of revenue to 17.8% in Q3 2024 YTD.

Intel
Based on its quarterly report, the company attributed the cost increases to its 2024 Restructuring Plan “to implement cost-reduction measures” and had reached $2.8 bln through Q3 2024. Among its expenses related to this includes “employee severance and benefit arrangements, non-cash charges related to asset impairments associated with exit activities, as well as charges relating to real estate exits and consolidations”. The most significant appears to be “employee severance and benefit arrangements” which “includes charges of $2.2 billion in the third quarter of 2024 relating to the 2024 Restructuring Plan”. The company expects its restructuring plan to conclude by Q4 2025.
Furthermore, other components of its Restructuring and other charges are litigation and asset impairment. According to its quarterly report, the company is involved in ongoing claims and litigation, including a $1.0 bln charge related to VLSI litigation, a $780 mln charge for agreements with R2, Third Point, and TRGP, and a $401 mln charge for a fine imposed by the European Commission. Intel successfully appealed the VLSI decision as it was overturned. However, for its case with R2 Semiconductor, a German court ruled that “certain Intel central processing units (CPUs), embedded in electronic devices, infringe the claimant’s patent”, ruling against Intel. Finally, asset impairment charges “include a goodwill impairment loss of $222 million in the first quarter of 2024”.

Intel
Besides restructuring charges, in Q3 2024, Intel also highlighted various charges such as $3.1 bln of asset impairments and accelerated depreciation related to its Intel 7 node development, $2.9 bln in goodwill impairment and $9.9 bln charge related to a write of its deferred tax assets as the company determined that “it is more likely than not that the deferred tax assets will not be recoverable” as it has a “three-year cumulative historical loss position” and was “largely resulting from the asset impairment and restructuring and other charges incurred during the current quarter” based on its quarterly report. It is a non-cash charge, thus primarily affecting its net margin rather than cash flow.
Outlook
Company Data, Khaveen Investments
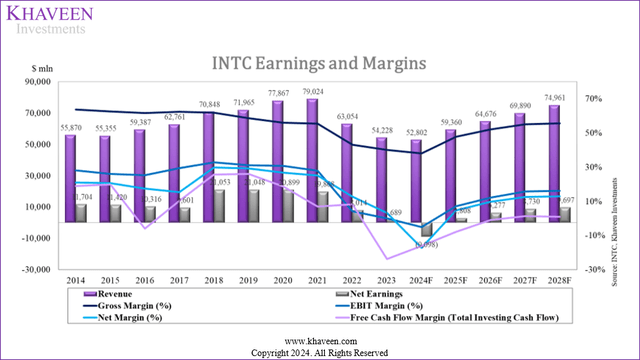
All in all, we believe the decline in the company’s profitability margins in Q3 2024 YTD was primarily affected by factors such as the restructuring and other charges, which mainly consist of litigation charges following the legal challenges the company faces with R2, in addition to higher employee severance and benefits as well as impairment of goodwill. Additionally, other factors such as asset impairments and accelerated depreciation, goodwill impairment, and deferred tax write-offs also contributed to its steep losses in 2024. However, we believe these charges are non-recurring expense items and could lead to a boost in Intel’s margins going forward following the recognition of the charges this year. For example, the company stated in its quarterly report that the restructuring charges incurred for its 2024 Restructuring plan are nearly its expected target of $3 bln as it already incurred $2.8 bln cumulatively, implying an expected remaining charge of only $0.2 bln. Nonetheless, we updated our margin projections for the company’s net margin to decline to -17.23% in 2024 before gradually recovering to 4.8% in 2025 and 13% by 2028 primarily due to our continued expectations for the company’s economies of scale to improve as highlighted in our previous analysis due to the expected return to growth beyond 2024.
Risk: Management Restructuring and Expansion Delays
Recently, Intel’s CEO was ousted by the board, as Reuters reported that “the board told Gelsinger he could retire or be removed, and he chose to step down”. We believe this could be a risk for Intel’s execution of its process roadmap to return to leadership as discussed in the second point. Notwithstanding, Intel’s board highlighted that they remain committed to this as “returning to process leadership is central to product leadership”. Besides that, another risk we believe for the company is its delayed factory expansions. In 2024, 3 projects have been delayed. Firstly, construction for Intel’s $32.4 bln Magdeburg chip fab has been delayed until 2025. Secondly, construction for Intel’s $25 bln Israel Fab 38 has been delayed, which could be due to potential financing issues despite the NIS 11 bln Israeli government grant. Thirdly, the construction for its $20 bln Ohio has been delayed and is expected to be completed by late 2026 or 2027, which could affect the revenue growth of its Foundry segment.
Valuation
Company Data, Khaveen Investments
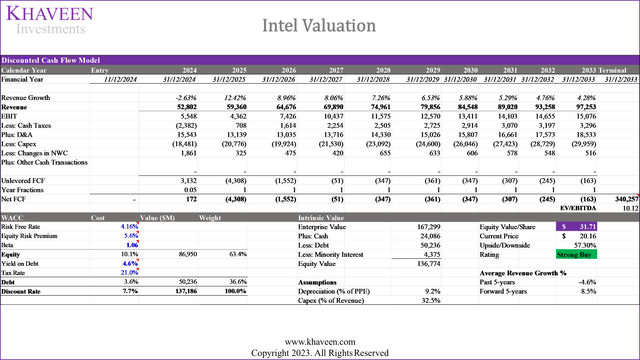
For our DCF valuation, we adjusted our revenue projections reflecting the underperformance of the company in 2024 of -2.6% compared to our initial projections (9.5%) as discussed in the first section, leading to a lower 5-year forward average revenue growth of 8%, but only slightly vs 9.4% previously as we maintain our growth outlook for the company in 2025 and beyond capitalizing on the expected end markets recovery while still factoring for intense competition as explained in our coverage of AMD. Our view is also fairly in line with analysts’ consensus that has a 3-year forward average of 5.8% for the company. Based on a discount rate of 7.7% (company’s WACC) and Intel’s 5-year average EV/EBITDA of 10.12x, we derived an upside of 57%.
Verdict
We believe Intel’s underperformance in 2024 YTD is driven by continued challenges in key segments such as weakness in the 5G chip market, new export restrictions and intense competition from AMD, leading to our revised forecasts of -2.6% for 2024. Looking ahead, however, we expect several positive catalysts to improve Intel’s growth outlook in 2025. We believe the upcoming launches of Lunar Lake and Arrow Lake processors for AI-focused PCs could support CCG. For the DCAI segment, we see signs of recovery, with revenue growth showing sequential improvement since Q1 2024, as the server end market stabilizes. Furthermore, we believe rising capex investments from major telco players, guided for 2025, could support a rebound in 5G chip demand for the NEX segment. We also expect Mobileye to stabilize as Tier 1 customer inventory levels normalize by mid-2025. In addition, we believe Intel Foundry still has the potential to show significant growth from 2025 onwards as it scales up external revenue.
While Intel has had a history of product launch delays with an estimated average revenue loss attributed to market share loss and pricing of 0.7% and 1% respectively, we believe the company has made notable progress in closing the technology gap in 2024 due to its roadmap execution and collaboration with TSMC on 3nm chips. Looking forward, we expect the success of Intel’s 18A process node in 2025 could be a key opportunity for it to be on a path to regain process technology leadership if it succeeds. Furthermore, we believe the steep decline in Intel’s profitability in 2024 has been primarily driven by non-recurring restructuring and legal charges, as well as asset impairments and deferred tax write-offs. These factors have contributed to our estimate of a -17.23% net margin for the year. However, with restructuring charges nearly completed, we expect Intel’s margins to recover to 4.8% in 2025 and 13% by 2028, supported by economies of scale and improved revenue growth.
In conclusion, while Intel faces near-term headwinds, we believe its focus on innovation, recovery in key end markets, and execution of its process technology roadmap could position the company for a rebound beyond 2025. Our updated valuation shows a price target of $31.71, which is below our previous target of $39.1, yet still representing a 54% upside from current levels following its 39% stock decline since our last coverage.
Analyst’s Disclosure: I/we have a beneficial long position in the shares of INTC either through stock ownership, options, or other derivatives. I wrote this article myself, and it expresses my own opinions. I am not receiving compensation for it (other than from Seeking Alpha). I have no business relationship with any company whose stock is mentioned in this article.
No information in this publication is intended as investment, tax, accounting, or legal advice, or as an offer/solicitation to sell or buy. Material provided in this publication is for educational purposes only, and was prepared from sources and data believed to be reliable, but we do not guarantee its accuracy or completeness.
Seeking Alpha’s Disclosure: Past performance is no guarantee of future results. No recommendation or advice is being given as to whether any investment is suitable for a particular investor. Any views or opinions expressed above may not reflect those of Seeking Alpha as a whole. Seeking Alpha is not a licensed securities dealer, broker or US investment adviser or investment bank. Our analysts are third party authors that include both professional investors and individual investors who may not be licensed or certified by any institute or regulatory body.
