
Summary:
- Intel’s revenue is projected to grow slower than expected, but still post a 9% growth for FY2024.
- Margins have declined, but this is due to economies of scale, and we expect them to increase in line with revenue moving forward.
- Intel remains the market leader in CPUs and is poised to benefit from the rise of AI CPUs.
JasonDoiy
In our previous analysis of Intel Corporation (NASDAQ:INTC) (NEOE:INTC:CA), we projected a rebound in Intel’s desktop and laptop revenue in 2024, driven by an 11.5% growth in the PC market and the launch of advanced 2nm Arrow Lake CPUs, alongside a 5.7% growth in server revenue supported by positive IT spending and increased data center capex for AI by cloud providers. Additionally, we also expected Intel’s NEX, Mobileye (MBLY) and IFS segments to recover, with NEX benefiting from market recovery and new products, Mobileye from ADAS growth, and IFS from capacity expansions.
In this analysis, we reexamined the company as it experienced a 25% decline in stock value, underperforming the semiconductor industry since our previous analysis. We begin by examining why Intel’s revenue recovery falls short of our initial forecast of 12%. Despite improvements in the PC and server markets, the company’s recovery remains challenging, with analyst consensus now revised down to 3%. Additionally, we explore how the company’s growth outlook could improve throughout the year, particularly in the CCG and DCAI segments, by examining new product launches and advancements in AI-powered PCs and Gaudi GPUs. Lastly, we address the persistent negative FCF margins despite revenue and margin growth.
Revenue Growth Recovery Slower Than Expected
In this point, we examine why Intel’s revenue recovery is still struggling despite the anticipated recovery in our previous analyses. We had forecasted Intel’s full year 2024 revenue growth at 13.9% previously, which was in line with analysts’ consensus as well during Jan 2024. However, Intel had reported 8.6% YoY growth in Q1 2024, which is not far off from our 2024 forecast but provided weak guidance for Q2 at flattish growth YoY while analysts’ consensus had reduced the company’s growth forecast in 2024 to 3%.
We compiled Intel’s Q1 2024 performance and compared it with our previous forecast for 2024 to identify underperforming segments. We then further examined the specific performance metrics for its key segments such as CCG and DCAI such as ASP, shipment growth and revenue growth, PC & server market growth and Intel market share.
|
Intel Revenue ($ mln) |
Q1 2024 |
Our Previous 2024F |
|
Client Computing Group |
7,533 |
33,694 |
|
Growth (% YoY) |
30.6% |
15.2% |
|
CCG Desktop |
2,461 |
11,850 |
|
Growth (% YoY) |
31.0% |
16.6% |
|
CCG Laptop |
4,681 |
19,423 |
|
Growth (% YoY) |
37.4% |
14.3% |
|
CCG Other |
391 |
2,421 |
|
Growth (% YoY) |
-18.7% |
15.2% |
|
Datacenter and AI |
3,036 |
16,762 |
|
Growth (% YoY) |
4.7% |
8.0% |
|
Network & Edge |
1,364 |
6,474 |
|
Growth (% YoY) |
-8.4% |
12.1% |
|
Mobileye |
239 |
2,596 |
|
Growth (% YoY) |
-47.8% |
24.9% |
|
Intel Foundry (IFS until Q4 2023) |
4,369 |
1,121 |
|
Growth (% YoY) |
-9.6% |
11.9% |
|
Others |
536 |
196 |
|
Growth (% YoY) |
-45.4% |
0.0% |
|
Intersegment Eliminations |
(4,353) |
|
|
Growth (% YoY) |
||
|
Total |
12,724 |
62,272 |
|
Growth (% YoY) |
8.61% |
13.9% |
Source: Company Data, Khaveen Investments
Based on the table, Intel’s CCG segment, which is its largest (59.2% of revenue) grew by 30.6% YoY, indicating a recovery underway and higher than our full-year segment growth forecast of 15.2%. Despite the outperformance of CCG, Intel’s total revenue grew by 8.6% YoY in Q1 2024, lower compared to our full-year forecasts (13.9%). The reason is due to the lower growth of its remaining segments such as DCAI, which had not yet reached our full-year growth expectations (4.7% vs 8%), while other segments such as NEX (-8.4% vs 12.1%), Mobileye (-47.8% vs 24.9%) and IF (-9.6% vs 11.9%) contracted significantly.
CCG and DCAI
CCG had a higher YoY growth of 30.6%, surpassing our previous full-year forecast of 15.2%. There was higher growth across CCG subsegments including Desktop and Laptop as management highlighted “a strong product portfolio and share position and significantly improved customer inventory levels.” Besides, we observed a negative growth of 18.7% in CCG Other, which was lower than our full-year forecast of 15.2% “primarily driven by the exit of legacy businesses” according to the company. Moreover, performance in Datacenter and AI is in line with our full-year forecast given that it has a growth of 4.7%, close to our full-year forecast of 8.0%.
To determine the reason for the performance differences in the CCG and DCAI segments, we examined the company’s revenue growth breakdown by Desktop, Laptop and Server in terms of shipment, ASP, end market growth and market share.
|
Intel CCG and DCAI Segments |
Desktop (Q1 2024) |
Our Forecast (2024F) |
Laptop (Q1 2024) |
Our Forecast (2024F) |
Server (Q1 2024) |
Our Forecast (2024F) |
|
Revenue Growth |
31.0% |
16.6% |
37.4% |
14.3% |
4.7% |
5.7% |
|
Shipments Growth |
31.0% |
11.5% |
37.4% |
11.5% |
-16.3% |
2.1% |
|
ASP Growth |
0% |
3.7% |
0% |
1.7% |
25% |
4.2% |
|
Market Share |
76.1% |
81.3% |
80.7% |
82.6% |
76.4% |
78.8% |
|
End Market Growth % |
1.5% |
11.5% |
1.5% |
11.5% |
-1.6% |
2.1% |
Source: Company Data, Khaveen Investments
Revenue growth in Q1 2024 Desktop segment was 31.0%, surpassing our full-year forecast of 16.6%, primarily attributed to the Shipments growth since the ASP growth remains flat (0%) for the quarter. Besides, Intel’s Q1 2024 Desktop market share decreased by 4.7% YoY was 5.2% below our full-year forecast. According to Mercury Research, AMD (AMD) gained market share following its recently launched new “Zen 4-based Ryzen 8000/Ryzen 8000 Pro processors”, which was released in Q1 2024 while Intel released its processors earlier in Q4 2023, which may be a reason for the share gain for AMD in the quarter.
Similarly, in terms of the laptop segment, Intel’s Q1 2024 performance surpassed our forecast in both revenue and shipment growth by more than 20%, mainly due to an increase in shipment growth, with ASP growth remaining flat. Moreover, the company’s Laptop Q1 2024 market share was 80.7%, which was fairly in line with our full-year forecast for 2024. In terms of end market, the overall PC market (laptops and desktops) growth was 1.5% YoY in Q1, compared to our full-year forecast of 11.5%. Still, we believe this indicates an improving trend; the previous Q4 2023 quarter growth was -2.7% YoY. In contrast, we believe Intel’s high shipment growth could be a forward indicator of the PC market growth for 2024 as PC makers order chips in advance to manufacture PCs.
Additionally, we observed a revenue growth of 4.7% in the Q1 2024 server segment, which is around 1% lower than our full-year forecast. Besides, shipments growth in the quarter was -16.3%, much lower than our forecast of 2.1%, however, it was offset by a large ASP growth of 25%, which is 20.8% higher than our forecast as management highlighted it benefited from “higher server ASPs” and “a higher mix of high core count products” as Intel had released its 5th gen Xeon processors which increased its core count to 64 for its flagship model. Intel’s server market share decreased by 5.6% YoY in Q1, but is still fairly in line with our full-year market share forecasts. In our previous analysis of AMD, we determined a lower competitive factor score for Intel’s server CPUs (0.99x) compared to AMD, as we believe AMD continues to have a slight advantage over Intel’s server processors due to its superior performance. Furthermore, the server end market shipment growth was -1.6% YoY, which indicates an improvement towards recovery.
Intel Other
For the remaining segments under the Intel Other business, segments across Network & Edge as well as Mobileye both showed negative YoY growth of 8.4% and 47.8% respectively, deviating from our 2024 full-year forecast. In NEX, the company continued to “significant declines in the 5G market”, which we previously analyzed. However, the company’s NEX segment growth rate in Q1 was negative (-8.4%) but indicates an improvement compared to the large decline of -35% in 2023; therefore we believe the company’s NEX segment is gradually recovering. Management also highlighted the improvement in end markets, with “channel inventories approaching normal levels” in its latest quarter. During 2023, telecom companies’ capex spending declined mainly due to the normalization of 5G buildout where telecom operators such as AT&T were reducing capex for 2H 2023 by $1 bln after “historically high levels of investments in 5G”. However, despite the decline of Network Operators’ capex to $543 bln in 2023, total capex is expected to recover by 2% to $552 bln during 2024.
Furthermore, for Mobileye, management cited the decline in the segment due to “inventory headwinds impacting Mobileye.” We previously highlighted the automotive market weakness as the reason for the company’s slowdown in 2023, with the production of automotive vehicles exceeding demand, leading to a cutback of chip orders impacting automotive chipmakers including Mobileye as automakers draw down existing inventories.
In Intel Foundry Services, the company had changed its reporting structure to Intel Foundry, which consists “substantially of process engineering, manufacturing, and foundry services groups that provide manufacturing, test, and assembly services to our Intel Products business and to third-party customers”. However, despite the increase to $4.4 bln, it had intersegment eliminations of $4.3 bln which indicates most of the revenue is due to intercompany transactions for its Intel Products business as mentioned. Furthermore, based on its IF segment revenue and intersegment eliminations, we calculated its Q1 2024 revenue was only $16 mln, which is an 86% YoY decline compared to the previous quarter. This is compared to our expectations of positive growth while the foundry market grew by 6.8% YoY in Q1 2024, which is still an insignificant portion of the company’s overall business (0.1% of total Q1 revenue) as we believe Intel is still trying to attract customers for long-term growth. For example, management highlighted that it had recently secured 6 customers for its new Intel 18A process and its total contract value for foundry increased to $15 bln, higher than $10 bln previously.
Outlook
Overall, Intel’s growth rate in Q1 2024 was 8.6% which was slightly below our full year 2024 growth projection of 13.9% for its total revenue as we believe the company’s segments such as DCAI and NEX are still trying to stabilize after the large contractions in 2023 with Q1 2024 indicating an improvement. However, despite the decent performance in Q1, management has guided flattish growth for Q2 of 1% YoY at the midpoint of $13 bln but sees a better growth outlook in H2 204. The company highlighted that “Q2 client revenue is constrained by wafer-level assembly supply”.
Notwithstanding, management also provided a more positive outlook for H2 2024 as it is building “more wafer-level assembly capacity” and expects “growth across all segments” with the upcoming product launches for next-gen Lunar Lake CPUs for CCG and Granite Rapids for DCAI. On the other hand, Intel guided growth for its Intel Other segments including Mobileye, NEX and IFS, indicating a recovery. We had anticipated the slowdown to persist throughout H1 2024 and affect Mobileye’s growth until a recovery in the second half of the year. Mobileye’s management also reiterated this, expecting its Tier 1 customers inventory levels to return to “normal orders by end of Q2”. Furthermore, in NEX, we highlighted the expected recovery in telecom capex in 2024 after the contraction following the normalization of spending for the 5G infrastructure rollout. Additionally, while its IF segment revenue to external customers is insignificant (0.1% of total revenue), we see its growth supported by its new customers and total contract value rising to $15 bln, which could bode well for its long-term outlook. While its foundry segment still has a long way to reach $15 bln in revenues by 2030, we believe the expected launch and ramp of the Intel 18A in 2025, which aligns with the expected completion of its new Arizona fab expansion indicates growth potential. One of the key customers Intel has secured using Intel 18A is Microsoft (MSFT), which we mentioned previously introduced its own custom CPUs and GPUs for its data centers and is positive for the company’s outlook as the second-largest cloud provider (25% share).
Therefore, we believe our projections remain appropriate for H2 2024. This is as management indicated growth acceleration in H2 2024 following flattish guidance for Q2 2024 as the company faces backend supply shortages which it is stated that it was building more capacity. Among factors for the growth acceleration is the improving end market outlook with normalizing inventory levels for NEX and stabilizing PC and server market shipments as we believed excess market shipments during the pandemic have been absorbed and cloud service providers’ capex spending recover in 2024 as previously highlighted in past analyses.
|
Intel Revenue Projections ($ bln) |
2023 |
2024F |
2025F |
2026F |
|
Client Computing Group |
29.26 |
33.70 |
38.98 |
40.81 |
|
Growth % |
-7.7% |
15.2% |
15.7% |
4.7% |
|
Datacenter and AI |
15.52 |
16.20 |
18.27 |
19.87 |
|
Growth % |
-19.1% |
4.4% |
12.8% |
8.7% |
|
Network & Edge |
5.77 |
6.47 |
7.54 |
8.78 |
|
Growth % |
-34.9% |
10.1% |
16.5% |
16.5% |
|
Mobileye |
2.08 |
2.22 |
2.77 |
3.46 |
|
Growth % |
11.2% |
6.7% |
24.9% |
24.9% |
|
External IF (IFS Previously) |
0.95 |
0.06 |
0.16 |
0.39 |
|
Growth % |
6.4% |
-0.9% |
148.3% |
148.3% |
|
Other Revenue |
0.64 |
0.64 |
0.64 |
0.64 |
|
Total |
54.23 |
59.30 |
68.36 |
73.95 |
|
Growth % |
-14.0% |
9.3% |
15.3% |
8.2% |
Source: Company Data, Khaveen Investments
We updated our revenue projections based on our actual Q1 results, Q2 guidance and our growth forecast for H2 2024 based on management of our previous full year 2024 projections. For CCG and DCAI, we prorated its Q1 actual growth, flattish guidance assumption of 0% YoY in Q2 and our previous forecast for H2 2024. Whereas for NEX, Mobileye, we prorated its Q1 actual growth and our previous projections while for the IF segment, we annualized our calculated Q1 external IF segment revenue and prorated its revenues to reach the target of $15 bln by 2030, which represents a CAGR of 148%, representing an acceleration coinciding with the expected ramp of Intel 18A in 2025, but only accounting for only a minor portion (0.5%) of total revenue in 2026. In total, we revised our growth projections for Intel in 2024 at 9.3%, which is lower than 13.9% previously but still expect a better growth performance in 2025 onwards.
AI PC and Data Center GPU Growth Drivers
In the next point, we examined drivers for how the company’s growth outlook could improve throughout the year. Firstly, for CCG, management highlighted AI PCs and stated that “demand for AI PCs, particularly Core Ultra products, is exceeding expectations” during its latest earnings briefing. Meanwhile, in DCAI, the company emphasized the upcoming launch of Gaudi 3 as its next-generation server GPU and mentioned that “Intel is seeing increased interest in Xeon’s AI capabilities and the potential of Xeon plus Gaudi for enterprise AI use cases”.
Intel Ultra Processors (CCG)
We compared Intel’s Ultra processors with its 13th Gen (Raptor Lake) and 12th Gen (Alder Lake) core processors, focusing on processors with matching total core counts (12) and maximum clock speeds (4.4 and 4.8 Ghz). Then, we derived five Ultra processors and five combining 13th and 12th Gen Core processors to analyze the difference in the average benchmark performance and pricing.
|
Intel CPU Comparison |
Intel Ultra |
Intel Core Processors (Raptor Lake and Alder Lake) |
Difference |
|
Pricing |
405.4 |
346.6 |
17.0% |
|
Performance Benchmark |
16,353 |
22,617 |
-27.7% |
|
Performance per Pricing |
40.3 |
65.3 |
-38.2% |
Source: PassMark, Company Data, Khaveen Investments
Based on the table, the average pricing of Intel Ultra processors is 17% higher than the average derived from Raptor Lake (13th Gen) and Alder Lake (12th Gen) processors with similar core count and clock speeds. In terms of performance benchmark average, Intel Ultra is lower by 27.7%, resulting in a lower average value score (performance per pricing) of 38.2%. In our previous analysis, we highlighted that AI PCs have an NPU which is “a dedicated processor or processing unit on a larger SoC designed specifically for accelerating neural network operations and AI tasks.” Furthermore…
Compared to GPUs, NPUs offer greater efficiency for AI-related tasks because they extract dedicated circuits from GPUs, allowing them to handle AI workloads more effectively and at lower power levels. NPUs complement CPUs and GPUs by specializing in AI-driven tasks, such as background blurring in video calls or object detection in photo editing, while the other processors handle broader tasks. – Khaveen Investments
Therefore, we believe the implementation of Neural Processing Unit (NPU) is considered a differentiator for Ultra processors in comparison to Intel Core processors, thus potentially contributing to the pricing premium which we expect could benefit Intel’s ASPs due to the shift to AI PCs.
Canalys, Khaveen Investments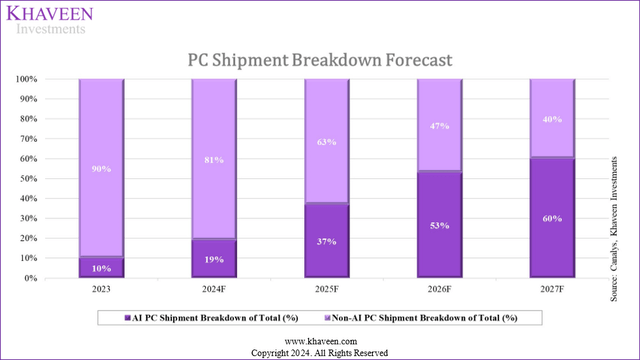
In our previous analysis of Dell (DELL), we highlighted “Canalys forecasted that the AI PC market will grow at a CAGR of 67.1% from 2023-2027, reflecting strong demand for AI PCs. AI PCs’ market share is expected to increase from 19% to 60% in 2027, driving the global PC shipment market”. Intel’s own estimates indicate the share of AI PCs to increase to 80%. Therefore, to maintain competitiveness in the PC market, we believe Intel introduced its Ultra processors to capitalize on the shift to AI PCs. Additionally, competitors such as AMD and Qualcomm have also introduced their processors for NPU chips, requiring Intel to respond to avoid losing competitiveness.
Intel Gaudi 3 (DCAI)
Moreover, we updated our comparison of server GPUs from our previous analysis of Nvidia in terms of performance specifications and updated our ranking to include more details on AMD’s new MI325, MI350 and Intel Gaudi 3.
|
Data Center GPU Comparison Metrics |
AMD (MI300x) |
AMD (MI325) |
AMD (MI350) |
Nvidia (B100) |
Nvidia (GB200 Superchip) |
Intel (Gaudi 2) |
Intel (Gaudi 3) |
Huawei (Ascend 910B) |
|
Processor |
5nm (TSMC) |
5nm (TSMC) |
3nm (TSMC) |
4nm (TSMC) |
4nm (TSMC) |
7nm (TSMC) |
5nm (TSMC) |
7nm (SMIC) |
|
Transistors (‘bln’) |
153 |
153 |
208 |
208 |
100 |
200 |
||
|
FP16 Peak (Teraflops) |
1,307 |
1,307 |
3,500 |
10,000 |
839 |
1,835 |
320 |
|
|
INT 8 (Teraflops) |
2,615 |
2,615 |
7,000 |
40,000 |
1,628 |
640 |
||
|
Memory Clock |
1.9GHz |
5.9 Gbps HBM3E |
8Gbps HBM3E |
8Gbps HBM3E |
1.56GHz |
3.6GHz |
1.85GHz |
|
|
Memory Capacity (GB) |
192 |
288 |
288 |
192 |
384 |
96 |
128 |
64 |
|
Memory Bandwidth (TB/sec) |
5.2 |
6 |
8 |
16 |
2.45 |
3.7 |
1.6 |
|
|
Interconnect Bandwidth (GB/sec) |
896 |
1800 |
1800 |
300 |
600 |
400 |
||
|
Max Power Consumption (W) |
700 |
700 |
1000 |
600 |
900 |
310 |
Source: Company Data, Khaveen Investments
Based on the table, Intel’s latest Gaudi 3 processor uses TSMC’s 5nm process, surpassing Huawei’s Ascend 910B, however, trailing behind NVIDIA (NVDA) and AMD. In terms of transistors, Intel’s Gaudi 3 has approximately 200 bln transistors, as it is estimated to have 2x more compared to its previous model. Thus, surpassing AMD’s latest MI325 but trailing behind Nvidia.
Furthermore, Gaudi 3 is reported to have 1835 FP16 Peak in Teraflops, surpassing AMD’s latest model as well as Huawei’s Ascend 910B. However, in terms of memory capacity, Intel’s latest model is around 128GB, trailing behind both AMD and Nvidia. One advantage that Intel touts is in terms of costs, “Intel’s Gaudi 3 will cost half the price of Nvidia’s H100” according to Tom’s Hardware. However, in our previous analyses, we highlighted performance to be the major factor for AI, due to the rising parameters of LLMs and the necessity for greater GPUs for training AI models. Therefore, we continue to believe Nvidia’s performance advantage remains intact with a large gap for its GB200 Superchip while AMD is expected to introduce MI350 which is based on a more advanced process compared to Intel’s Gaudi 3. Intel’s management also guided $500 mln in expected revenue from Gaudi this year. In our previous analysis of Nvidia, we determined a competitive factor score for Intel at 0.7x and the market growth rate at 39%.
Outlook
|
Intel Revenue ($ bln) |
2024F |
2025F |
2026F |
|
Client Computing Group |
33.77 |
39.51 |
41.65 |
|
Growth % |
15.4% |
17.0% |
5.4% |
|
Datacenter and AI |
16.20 |
18.27 |
19.87 |
|
Growth % |
4.4% |
12.8% |
8.7% |
|
Datacenter and AI (Gaudi) |
0.5 |
0.64 |
0.81 |
|
Growth % |
27.3% |
27.3% |
|
|
Network & Edge |
6.47 |
7.54 |
8.78 |
|
Growth % |
10.1% |
16.5% |
16.5% |
|
Mobileye |
2.22 |
2.77 |
3.46 |
|
Growth % |
6.7% |
24.9% |
24.9% |
|
External IF (IFS Previously) |
0.06 |
0.16 |
0.39 |
|
Growth % |
-0.9% |
148.3% |
148.3% |
|
Other Revenue |
0.64 |
0.64 |
0.64 |
|
Total |
59.37 |
68.90 |
74.79 |
|
Growth % |
9.5% |
16.0% |
8.6% |
Source: Company Data, Khaveen Investments
Overall, we believe the company’s latest developments in CCG and DCAI could provide an additional boost to its growth outlook such as the introduction of Intel Ultra processors to benefit its CCG revenue growth by capitalizing on the shift to AI PCs with premium pricing with its NPU component to support AI application workloads. We forecasted its ASP growth for CCG Laptop to increase 1.5% with the Intel Ultra processors by multiplying a share estimate increase in AI PCs by 9% in 2024 and our derived pricing average difference of 17%, for a total ASP growth of 3.2%. Moreover, we DCAI, we factored in management guidance of Gaudi revenue of $500 mln in 2024, which is only a minor portion (3.9% of revenue) but with our growth forecast of 27.3% based on our market growth estimate of 39% multiplied with a competitive factor score of 0.7x as we expect competitors Nvidia and AMD to outperform Intel due to their performance advantage, reaching $800 mln by 2026. In total, we forecast Intel’s total revenue growth accounting for AI PCs and new Data Center GPUs at 9.5% in 2024, representing only a slight 0.2% increase compared to our base estimates from the previous first section but with a higher difference of 0.7% in 2025.
Margins To Gradually Improve
Finally, we focused on the company’s profitability and determined why are the company’s FCF margins still negative and deteriorating, even though there has been an improvement in revenue and margin growth.
We analyze the company’s profitability margins in comparison to our forecasts. Additionally, we explain the trend in profitability margins through an expense analysis and break down the FCF margins to understand the reasons behind their negativity.
Operating and Net Profitability
|
Expense Analysis |
Q1 2024 |
Our Previous 2024F |
|
COGS (excluding D&A) |
38.95% |
25.29% |
|
Depreciation & Amortization |
20.05% |
25.60% |
|
Gross Margin |
41.00% |
49.11% |
|
Research and development |
34.44% |
21.64% |
|
Selling, General and Administrative |
12.23% |
9.39% |
|
Other Expenses (Income) |
0.00% |
0.00% |
|
EBIT Margin |
-5.67% |
18.08% |
|
Interest |
0.51% |
0.74% |
|
Other Non-Operating Expense (income) |
0.50% |
-0.51% |
|
EBT Margin |
-5.65% |
19.32% |
|
Tax |
-2.22% |
11.84% |
|
Net Margin |
-3.43% |
17.04% |
|
Minority Interests |
0.44% |
-0.03% |
|
Net Earnings to Shareholders (% of Revenue) |
-2.99% |
17.06% |
Source: Company Data, Khaveen Investments
Based on the table above, we compiled an expense analysis of Intel’s Q1 2024 performance and compared it with our previous 2024 full-year forecast.
Firstly, the company reported a gross margin of 41%, lower than our full-year forecast of 49.11%, which is primarily due to the higher-than-expected COGS and Depreciation & Amortization. However, the company’s gross margins improved, higher by 6.8% compared to Q1 2024, therefore indicating a recovery in gross margins.
Furthermore, the company’s Q1 2024 EBIT margin was -5.67%, compared to our forecast of 18.08% for the full year. This was mainly due to a higher R&D expense as well as SG&A expense % of revenue. This further resulted in a negative EBT margin of 5.65%, which deviated from our 19.32% full-year forecast.
However, the company recognized a tax benefit which is reflected as a -2.22% tax expense in Q1 2024, suggesting that the company benefited from a tax shield. This contrasts with our forecast, where we anticipated a positive tax expense of 11.84%. Overall, the company in the end reported a net loss margin of -3.43% in Q1 2024, in contrast with our full-year net margin projection of 17.04%.
COGS
Company Data, Khaveen Investments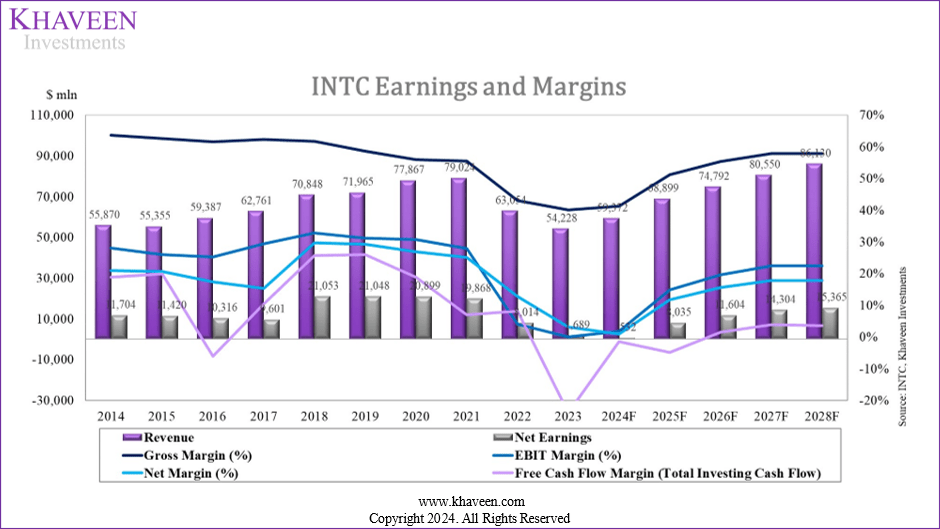
One of the main reasons for the lower-than-expected margins is due to its gross margins. Based on the chart above, the company’s gross margin had been trending downward from 2014 to 2021, which we believe could be due to the intense pricing competition between Intel and AMD based on our past analyses. However, in 2022, the company’s gross margins declined substantially and continued to decline in 2023 as its revenues contracted by double digits during the period; thus the period affected the companies’ economies of scale. In Q1 2024, the company’s gross margin did not match our expectations based on our full-year projections as we believe its scale had not recovered yet as we mentioned in the first point, the company’s revenue growth had not yet reached our full-year expectations, leading to lower scale benefits. Furthermore, based on our 2024 forecast, we expect its gross margins to recover to 2021 levels by 2027 when we see its revenue reaching $80.6 bln, compared to the 2021 level of $79 bln.
R&D
|
Intel R&D Forecast ($ mln) |
2019 |
2020 |
2021 |
2022 |
2023 |
Q1 2024 |
2024F |
2025F |
2026F |
2027F |
|
R&D |
13,362 |
13,556 |
15,190 |
17,528 |
16,046 |
4,382 |
17,528 |
18,638 |
19,817 |
21,072 |
|
Growth % |
-1.3% |
1.5% |
12.1% |
15.4% |
-8.5% |
6.6% |
9.2% |
6.3% |
6.3% |
6.3% |
|
Revenue |
71,965 |
77,867 |
79,024 |
63,054 |
54,228 |
12,724 |
59,372 |
68,899 |
74,792 |
80,550 |
|
Growth % |
1.6% |
8.2% |
1.5% |
-20.2% |
-14.0% |
8.6% |
9.49% |
16.05% |
8.55% |
7.70% |
|
% of Revenue |
18.6% |
17.4% |
19.2% |
27.8% |
29.6% |
34.4% |
29.5% |
27.1% |
26.5% |
26.2% |
Source: Company Data, Khaveen Investments
In terms of operating expenses, the most significant for the company is R&D. The company’s R&D expenses % of revenue was 34.4% in Q1 2024 and had increased compared to 29.6% in 2023.
According to its quarterly report, the company’s R&D increase was attributed to the company pursuing investments for the company’s process technology roadmap. In 2021, Intel launched its new IDM (integrated device manufacturing) 2.0 strategy, aiming to improve and catch up in terms of its technology process capabilities while expanding into the foundry market to leverage these advanced process technologies. In our previous analysis, we highlighted that Intel has developed various advanced process technologies and currently has successfully developed Intel 7 (7nm process). Based on its roadmap, we highlighted Intel’s plan to further close the gap with competitors and the Intel 10A is scheduled to be launched in 2027.
We continue to make significant investments to accelerate our process technology roadmap. This requires continued investments in R&D and focused efforts to attract and retain talent. – Intel Quarterly Report
During the period Intel’s R&D expenses increased since 2021, it outpaced the growth in revenues and only declined in 2023 as its revenues continued to contract. Therefore, we believe this strategy led to the outpacing of R&D spending. We projected its R&D spending in 2024 by prorating its Q1 R&D spending and based on its 3-year average of 6.3% in 2025 and beyond. However, we see its revenue growth outpacing its R&D growth, thus resulting in a projected decline in R&D % of revenue.
FCF Margin
|
Free Cash Flow Margin |
Q1 2024 |
Q1 2024 (% of Revenue) |
Our Previous 2024F |
Our Previous 2024F (% of Revenue) |
|
Net Interest Expenses |
65 |
0.5% |
451 |
0.7% |
|
Cash from Operations |
-1,223 |
-9.6% |
24,352 |
39.8% |
|
Capex |
-5,970 |
-46.9% |
-21,426 |
-35.0% |
|
Total Cash from Investing |
-2,563 |
-20.1% |
-21,426 |
-35.0% |
|
Free Cash Flow (Total Investing Cash Flow) |
-3,837 |
-30.2% |
2,569 |
4.2% |
|
Free Cash Flow (Capex Only) |
-7,244 |
-56.9% |
2,569 |
4.2% |
Source: Company Data, Khaveen Investments
According to the table above, we observed that the company’s Q1 2024 Free Cash Flow margin significantly deviated from our previous full-year projections, where we projected a positive FCF for both the total investing and capex only at 4.2% of revenue, and in contrast, the FCF margins were -30.2% and -56.9% respectively.
In terms of cash from operations, Q1 2024 ended with a negative 9.6% margin. This is followed by a high capital expenditure in Q1 2024, at 46.9% of revenue, which exceeds our full-year projection of -35.0%. We believe this is due to the company’s investment towards acquiring equipment from ASML, where it is reported that Intel has reserved all high-NA EUV machines and took delivery at the start of 2024 as the first customer of ASML to obtain these advanced lithography equipment. Therefore, we believe this could have resulted in a higher capex in Q1 2024. Furthermore, management reiterated its 2024 and 2025 capex guidance at mid-30% of revenue in its earnings briefing, which is the assumption we had previously applied for 2024.
Outlook
All in all, we determined the company’s profitability margins were lower compared to our full-year forecast for 2024, mainly due to lower gross margin as we believe the company’s economies of scale had not improved to the full potential as its revenue growth still struggled to recover based on our full-year expectations. Looking ahead, we expect its gross margins to recover steadily through 2027, recovering to their 2021 levels (57.8%) by 2027 as we projected its revenue to recover by then, reaching $80.9 bln. Additionally, we believe its R&D growth surged as the company invested to increase its process technology capabilities to catch up with the intense competition, though we expect its revenue growth to outpace the growth in R&D as its revenues recover and its R&D spending % of revenue to moderate going forward.
Risk: Competition
We believe one of the risks to Intel is competition from AMD and Nvidia in the CCG and DCAI segments. AMD’s upcoming Ryzen launch (Ryzen AI 300) and EPYC launch (Zen 5-based EPYC) are expected to bring powerful processors that could potentially challenge Intel’s offerings in both the client and server markets. Similarly, Nvidia’s Rubin architecture, which is also designed for high-performance computing together with AI applications, further intensifies the competitive landscape between the 3 companies. Thus, we believe this overall could impact Intel’s market position, pressuring Intel to further innovate.
Valuation
Khaveen Investments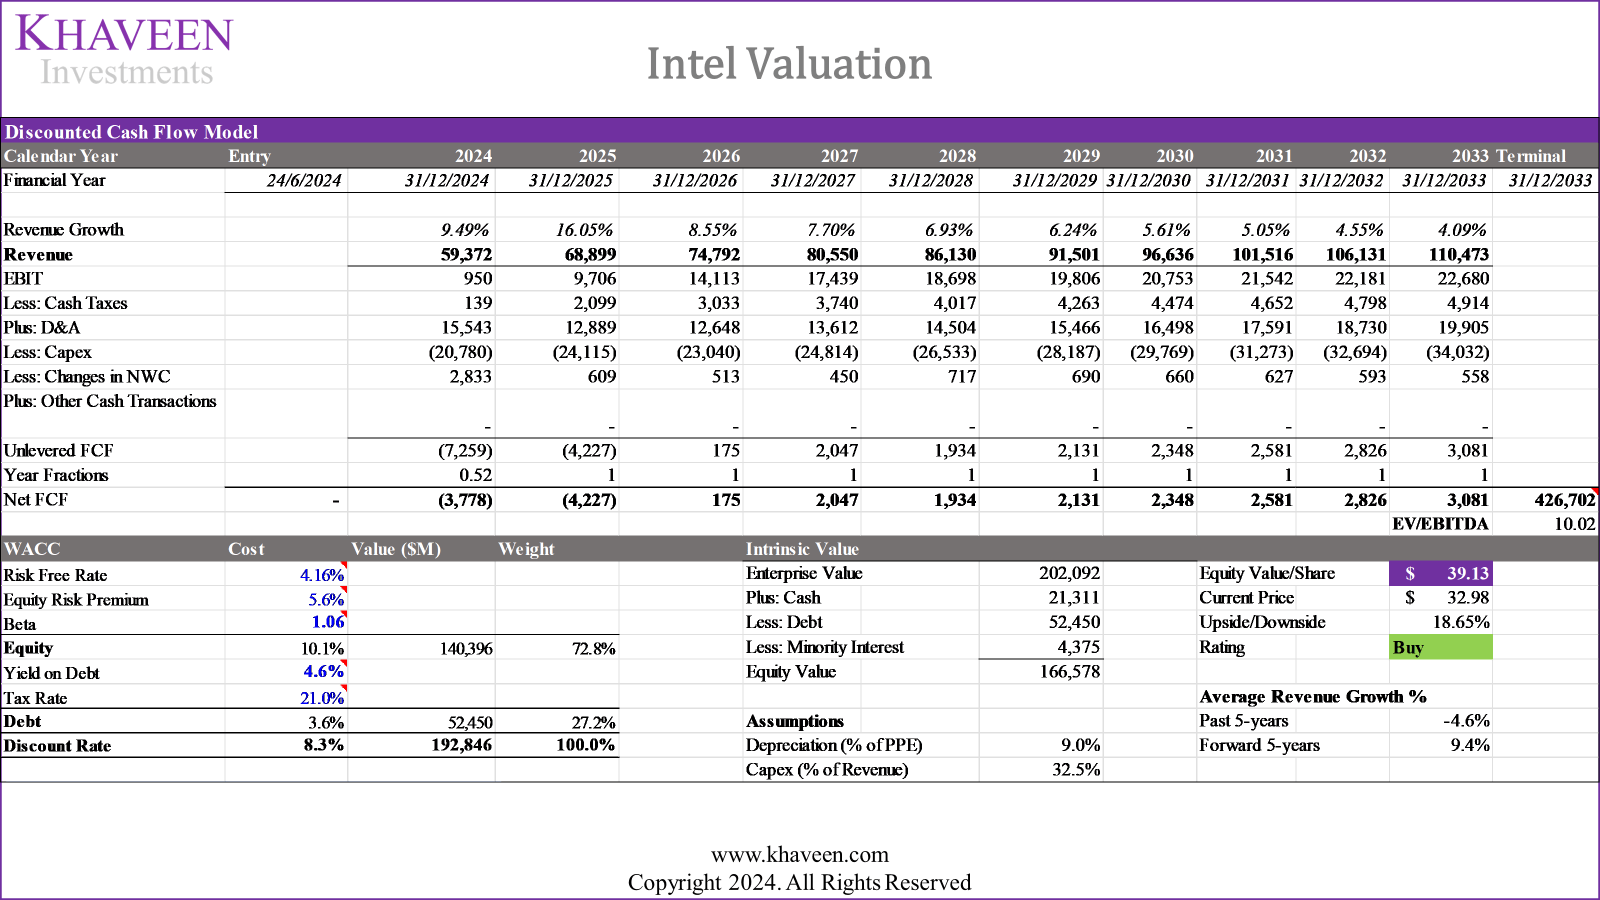
We updated our DCF valuation model, with revised revenue and margin projections. Based on a discount rate of 8.3% (company’s WACC) and terminal value based on its 5-year average EV/EBITDA of 10.02x, we derive an upside of 18.65%.
Verdict
In summary, we continue to believe Intel’s outlook for the second half of the year and going into 2025 has a potential for growth acceleration during the second half of the year with the recovery in various end markets as well as new developments such as AI-powered PCs with the introduction of Intel Ultra processors supporting ASP growth as well as new Gaudi GPUs for data centers. In terms of profitability, we revised our expectations for its margins to be lower due to lower gross margins, which we believe could recover in the long run as its scale improves. Furthermore, while we forecast R&D spending as % of revenue to remain high surge in the near term, we expect its revenue growth to outpace R&D growth as Intel’s revenue recovers. All in all, we upgrade our rating for Intel from a Hold to a Buy given the recent stock drop since our previous coverage of Intel by 25%. This is despite a slightly lower price target in this analysis of $39.13 ($41.70 previously), primarily due to our lower revised margin forecasts as the company focuses on its process roadmap as we have adjusted our 5-year forward average net margin forecast downward to 12.7% from 20.87% since our previous analysis factoring in the company’s R&D spending to support its advancements in process technology as part of its IDM2.0 strategy.
Analyst’s Disclosure: I/we have a beneficial long position in the shares of INTC either through stock ownership, options, or other derivatives. I wrote this article myself, and it expresses my own opinions. I am not receiving compensation for it (other than from Seeking Alpha). I have no business relationship with any company whose stock is mentioned in this article.
No information in this publication is intended as investment, tax, accounting, or legal advice, or as an offer/solicitation to sell or buy. Material provided in this publication is for educational purposes only, and was prepared from sources and data believed to be reliable, but we do not guarantee its accuracy or completeness.
Seeking Alpha’s Disclosure: Past performance is no guarantee of future results. No recommendation or advice is being given as to whether any investment is suitable for a particular investor. Any views or opinions expressed above may not reflect those of Seeking Alpha as a whole. Seeking Alpha is not a licensed securities dealer, broker or US investment adviser or investment bank. Our analysts are third party authors that include both professional investors and individual investors who may not be licensed or certified by any institute or regulatory body.