Summary:
- Despite a possible business shift to Intel’s foundry, concerns persist due to the looming threat of intellectual property compromise, casting doubt on the viability of such transitions.
- Intel’s potential for short-term earnings through expense cuts does little to address overarching concerns, including high debt, diminished margins, and unattractive foundry offerings.
- A striking revelation is the anticipated downside of over 42%, emphasizing the severity of Intel’s challenges and validating the cautious “Sell” recommendation.
- In light of Intel’s precarious situation, the sell recommendation is reinforced by the availability of better alternatives like AMD, TSMC, or Nvidia, offering superior risk-reward balances and growth potential.
wellesenterprises
Thesis
Intel Corporation (NASDAQ:INTC) stands as a trailblazer in the CPU market, sharing its dominance with Advanced Micro Devices, Inc. (AMD) in a PC CPU market duopoly.
While Intel has been a major player in semiconductor foundries, the outlook for regaining market dominance seems challenging. This is due to the inherent risks associated with manufacturing chips using Integrated Device Manufacturing (IDM), which opens the door to the potential theft of designs.
Upon conducting two DCF models, the results are telling. Based on current analysts’ estimates, Intel appears poised for a downside of approximately 42.6%. Even with an optimistic second DCF model forecasting a modest upside of 10.7%, the situation falls short of justifying the risks currently associated with Intel. Consequently, I recommend a “sell” rating for the stock.
Overview
Intel’s primary revenue stream emanates from the sale of its chips, notably the Intel CPU family. However, the company also generates income from data centers. Despite the exponential growth observed in this market for other players like NVIDIA Corporation (NVDA), Intel has experienced a 10% decline in revenue from this source compared to the same quarter the previous year. Contrastingly, in the realm of network and edge, Intel has witnessed a more pronounced dip of 32%, whereas competitors like Cisco Systems, Inc. (CSCO), have seen a remarkable 26% growth in this segment.
Notably, the most rapidly expanding sectors for Intel include Mobile, focusing on automotive software for self-driving applications, and Intel foundry services, which has registered an astonishing 299% growth compared to the same quarter in the previous year.
Data Center Market
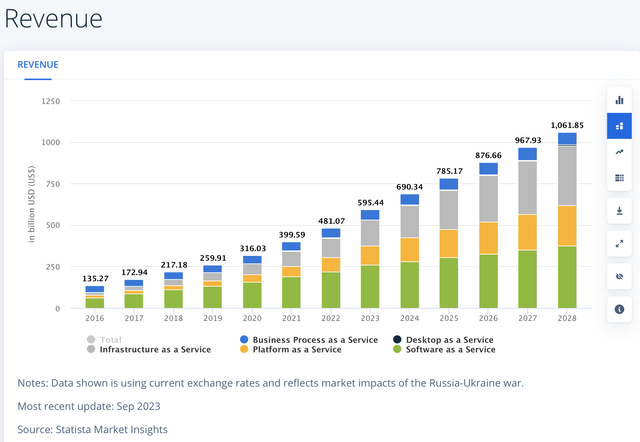
The Data Center Market is poised for consistent revenue growth, with a projected CAGR of 4.66% from 2023 to 2027. However, inside this data center market is the “AI Market,” which has been delivering huge returns so far.
Data Center Market Revenue Projections (Statista)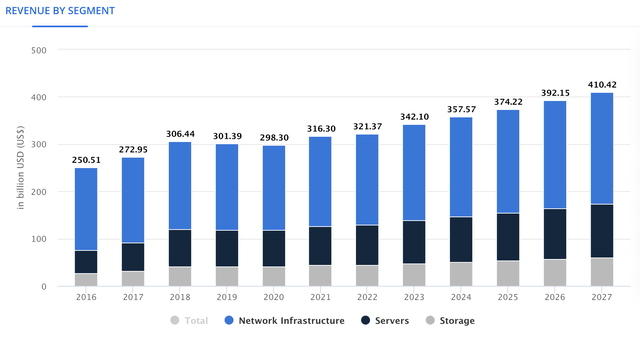
The AI market is set to undergo robust expansion, with an expected CAGR of 17.30% from 2023 to 2030. It’s noteworthy that by 2030, an estimated 70% of companies will integrate AI into their operations, representing a substantial 35% increase from the 35% observed in 2023.
AI Market – Worldwide (Statista)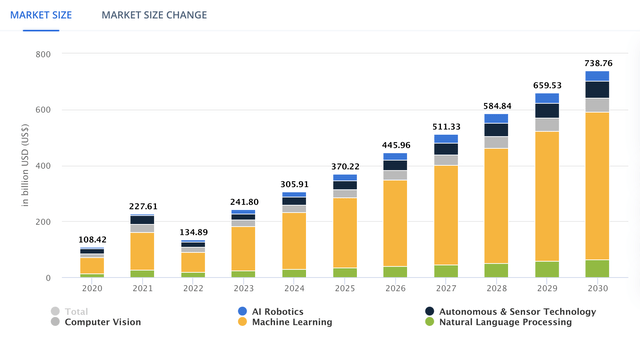
Client & Embedded processors
This segment encompasses AMD’s sales of CPUs and GPUs to individuals and PC brands. The microprocessor and GPU market is anticipated to grow at a rate of 2.9% through 2030.
Author’s Calculations based on Yahoo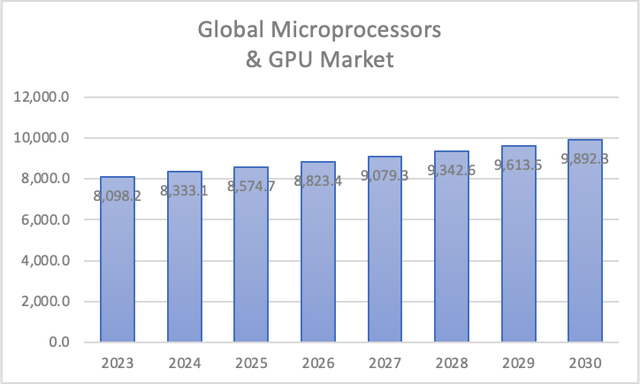
Mobileye
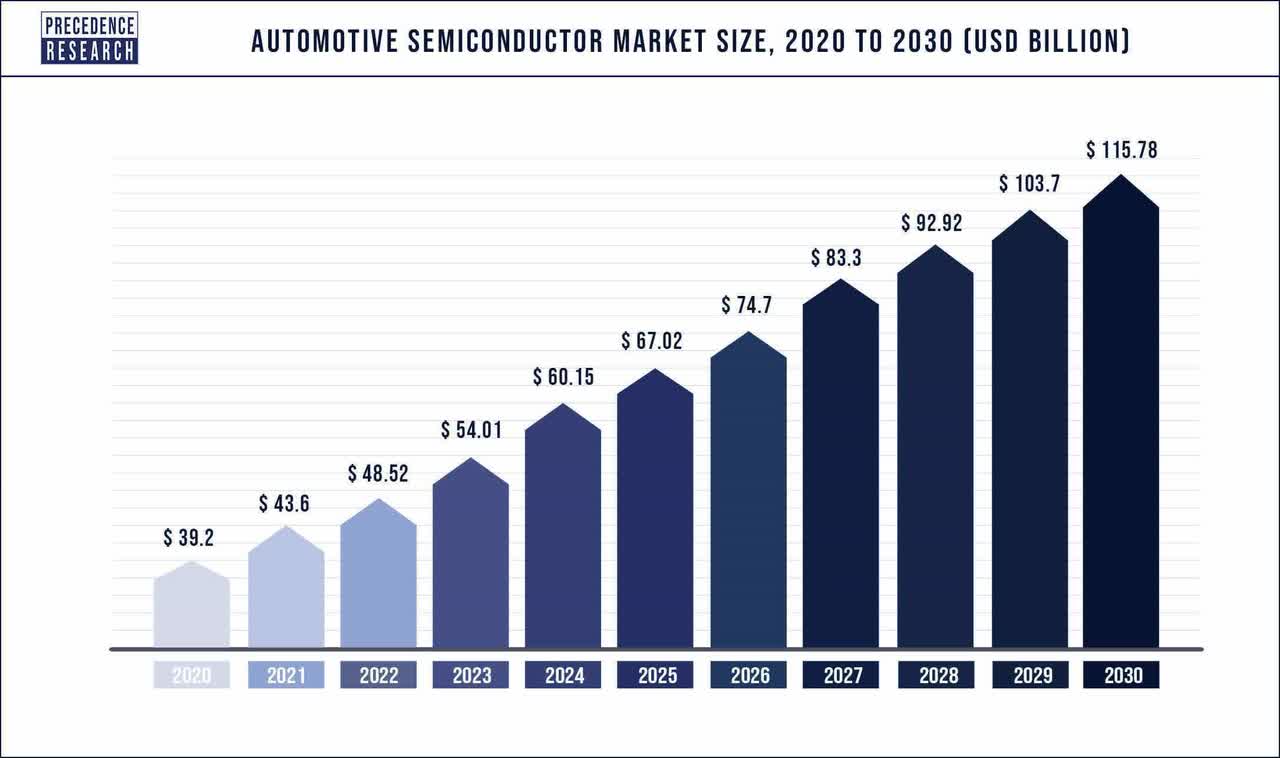
Mobileye is an Intel subsidiary bought in August 2017, when it was a publicity-traded company. Mobileye develops autonomous driving technologies and Advanced Driver Assistance Systems swell as cameras, chips, and software.
The automotive semiconductor market is expected to grow at a CAGR of 11.5% throughout 2023-2030.
Network and Edge
In essence, Intel integrates both cloud and edge computing. Edge computing involves relocating data to the point where it is most essential, thereby reducing response time. The seamless transfer of stored data from one server to another requires a cloud-ready infrastructure. It’s noteworthy that the public cloud market is anticipated to exhibit a CAGR of 12.7% until 2028.
Intel Foundry
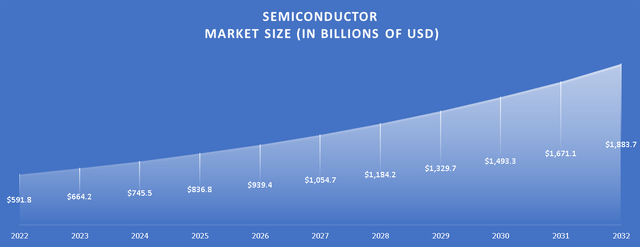
Projections suggest that the semiconductor market is poised to grow at a Compound Annual Growth Rate [CAGR] of 12.28% from 2023 to 2032. As of 2023, the market size stands at approximately $664.2 billion. If these projections materialize, it is estimated that the market will expand to $1.88 trillion by 2032.
Why TSMC will always be untouchable
Prior to the establishment of the Taiwan Semiconductor Manufacturing Company Limited (TSM), the landscape featured Integrated Manufacturing and Development (IDM) entities, with Intel being one of them. These entities not only designed their own chips but also engaged in manufacturing.
The catalyst behind Morris Chang’s decision to establish TSMC was the inherent risk associated with IDMs potentially pilfering the designs they were manufacturing and subsequently selling them as their own. As Intel’s history illustrated, the specter of legal entanglements dissuaded designers from pursuing such ventures, despite potential victories coming at a substantial cost.
TSMC provides designers with the assurance that their designs will remain secure, and free from the risk of theft. The path for Intel to reclaim chip foundry dominance may require the strategic move of spinning off its foundry business, thereby transforming it into two distinct entities.
Financials
Intel has witnessed a significant downturn in its economic metrics and performance. An illustrative example can be found in the income statement, where revenue has plummeted by approximately 33.16% to below $29.21 billion, a stark contrast to the $79 billion in revenues Intel boasted in the past.
Operating income and net income paint an equally bleak picture. In 2022, figures stood at $2.3 billion and $8 billion, respectively. Fast forward to the present, and Intel finds itself at -$2 billion and -$1.6 billion, marking a staggering reduction of over 90%.
This catastrophic decline is further evident in the margins. The once healthy operating margin of around 27.94% has nosedived to -3.94%, while the net income margin has similarly plummeted from 25.14% to today’s dismal figure of -3.11%.
Author’s Calculation Author’s Calculation

Turning our attention to Intel’s balance sheet reveals a grim state of affairs. Long-term debt has surged by 13.6% annually since 2021, juxtaposed against dwindling cash, which is shrinking at a rate of 4.50% annually.
The final blow comes in the form of free cash flow (FCF). From a robust FCF of approximately $17.8 billion, Intel now faces a staggering -$8.47 billion negative FCF, with its margin standing at a negative -16%, down from 2020’s 22.9%.
A closer look at the “FCF Components” table reveals that this downturn can be attributed to an increase in CapEx and a reduction in cash from operations. Reverting CapEx spending to 2020 levels would result in an FCF of around $1.62 billion, still low but at least not in the negative.
Author’s Calculation Author’s Calculation Author’s Calculation


In summary, Intel’s financial data paints a grim picture, indicating a need for substantial remedial efforts. The challenge, as evident from the free cash flow analysis, lies not in Intel’s disproportionate increase in expenses, but rather in a substantial sales slump, a much more formidable issue to address than merely reducing expenses to achieve a 22.9% FCF margin again.
Valuation
For this valuation, I will present two models: one based on analysts’ estimates and the other derived from my own projections, factoring in the expected market growth rate for each of the segments in which Intel operates.
In the table below, you can observe the variables used to calculate the WACC. Additionally, you’ll notice that Depreciation and Tax (D&T) as well as interest expenses are computed with margins tied to revenue.
| TABLE OF ASSUMPTIONS | |
| (Current data) | |
| Assumptions Part 1 | |
| Equity Value | 105,686.00 |
| Debt Value | 48,883.00 |
| Cost of Debt | 1.55% |
| Tax Rate | 41.70% |
| 10y Treasury | 4.80% |
| Beta | 1.21 |
| Market Return | 10.50% |
| Cost of Equity | 11.70% |
| Assumptions Part 2 | |
| EBIT | |
| Tax | (1,176.00) |
| D&A | 10,376.00 |
| CapEx | 24,959.00 |
| Capex Margin | 47.21% |
| Assumption Part 3 | |
| Net Income | -1,644.00 |
| Interest | 760.00 |
| Tax | -1,176.00 |
| D&A | 10,376.00 |
| Ebitda | 8,316.00 |
| D&A Margin | 19.63% |
| Interest Expense Margin | 1.44% |
| Revenue | 52,864.0 |
Analysts’ Estimates
In this initial model, I aim to determine Intel’s fair value per share assuming it achieves the growth rates forecasted by analysts-specifically, -6.59% for revenue and 2.33% for EPS over a 3 to 5-year period.
| Revenue | Net Income | Plus Taxes | Plus D&A | Plus Interest | |
| 2023 | $53,840.0 | $4,005.00 | $5,675.17 | $16,242.74 | $17,016.77 |
| 2024 | $60,890.0 | $7,968.00 | $11,290.83 | $21,858.39 | $22,632.42 |
| 2025 | $56,877.3 | $8,153.65 | $11,553.90 | $22,717.63 | $23,535.33 |
| 2026 | $53,129.1 | $8,343.63 | $11,823.11 | $22,251.15 | $23,014.96 |
| 2027 | $49,627.9 | $8,538.04 | $12,098.59 | $21,839.42 | $22,552.89 |
| 2028 | $46,357.4 | $8,736.98 | $12,380.48 | $21,479.39 | $22,145.85 |
| ^Final EBITA^ |
The results paint a disheartening picture for Intel. The model suggests a near-term downside of 42.6%, indicating that the stock should adjust to a fair value of $22.3 from its current price of $38.9. Furthermore, the projection for 2028 sets the stock price at $41.9, translating to meager annual returns of around 1.5%. Clearly, analysts do not harbor much optimism for Intel’s future prospects.
My Estimates
In this alternative model, I project the revenue for each of Intel’s segments based on the market growth rate specific to each segment’s respective market.
| Revenue | Net Income | Plus Taxes | Plus D&A | Plus Interest | |
| 2023 | $52,642.0 | $6,690.79 | $9,481.00 | $19,813.42 | $20,570.23 |
| 2024 | $57,430.8 | $7,299.46 | $10,343.48 | $20,675.90 | $21,432.71 |
| 2025 | $62,918.8 | $7,996.99 | $11,331.90 | $23,681.44 | $24,585.99 |
| 2026 | $69,223.0 | $8,798.25 | $12,467.31 | $26,054.21 | $27,049.40 |
| 2027 | $76,480.4 | $9,720.66 | $13,774.39 | $28,785.75 | $29,885.28 |
| 2028 | $84,851.7 | $10,784.65 | $15,282.08 | $31,936.53 | $33,156.40 |
| ^Final EBITA^ |
Author’s Calculation Author’s Calculation

My estimates offer a more favorable outlook for Intel, with a substantial upside of up to 10.7%. This implies a stock price reaching $43. The model also suggests the potential for annual returns of approximately 18.9% if the stock attains the future price of $75.5.
However, even with this more optimistic projection, the upside remains relatively low. It may not be compelling enough to disregard analysts’ estimates, especially when compared to competitors like AMD, which could potentially offer annual returns exceeding 25%.
Risks to Thesis
The primary challenge to the bearish outlook lies in the potential willingness of businesses to transition to Intel’s foundry. However, the looming threat of technology theft remains a significant deterrent for designers contemplating a partnership with Intel.
A second risk involves the possibility of Intel implementing substantial expense cuts in the current fiscal year. While this could artificially boost earnings, it might create a scenario where Intel becomes intrinsically undervalued, presenting a potential for a deep value play. This, however, does not negate the overarching forecast of a declining company.
Nevertheless, several critical factors, including Intel’s considerable debt, diminished margins, high Capital Expenditure (CapEx), and an unattractive foundry offer, contribute to my perspective that the stock will remain lackluster in the foreseeable future. For these reasons, I advocate a “Sell” rating for Intel. In my view, the risk-reward balance does not justify investing in Intel when alternatives like AMD, TSMC, or Nvidia present more promising opportunities.
Conclusion
In conclusion, the “Sell” rating on Intel emerges as a prudent stance in light of the substantial risks and challenges the company currently faces. The prospect of businesses shifting to Intel’s foundry is overshadowed by the pervasive fear of technology theft, presenting a formidable obstacle for potential design partnerships. Moreover, while there is a theoretical chance of Intel orchestrating significant expense cuts in the near term, the overarching concerns stemming from massive debt, eroded margins, high CapEx, and an unappealing foundry proposition persist. As my analysis indicates, Intel’s stock is on a precarious path, with a projected downside of over 42%. This sobering outlook underscores the gravity of the challenges ahead and strongly supports the cautious recommendation to divest from Intel in favor of more promising alternatives in the market
Analyst’s Disclosure: I/we have no stock, option or similar derivative position in any of the companies mentioned, but may initiate a beneficial Short position through short-selling of the stock, or purchase of put options or similar derivatives in INTC over the next 72 hours. I wrote this article myself, and it expresses my own opinions. I am not receiving compensation for it (other than from Seeking Alpha). I have no business relationship with any company whose stock is mentioned in this article.
Seeking Alpha’s Disclosure: Past performance is no guarantee of future results. No recommendation or advice is being given as to whether any investment is suitable for a particular investor. Any views or opinions expressed above may not reflect those of Seeking Alpha as a whole. Seeking Alpha is not a licensed securities dealer, broker or US investment adviser or investment bank. Our analysts are third party authors that include both professional investors and individual investors who may not be licensed or certified by any institute or regulatory body.


