Summary:
- Intel reported mixed results for Q1, beating earnings expectations but falling short in revenue.
- The company’s revenue growth was driven by improvements in artificial intelligence, personal computing, and data center segments.
- Intel’s guidance for Q2 fell below consensus estimates, and investors appear skeptical of the company’s turnaround prospects.
- We believe that most of the “bad news” has already been priced in, and investors should look to start buying INTC stock at these lower levels.
hapabapa
For the first quarter period, Intel Corporation (NASDAQ:INTC) reported mixed results that surpassed analyst expectations in earnings but fell short in revenue – and the company issued guidance figures for the second quarter that were not received favorably by markets. Specifically, Intel recorded adjusted per-share earnings of $0.18 (or $759 million) for the period (beating analyst estimates of $0.14 per share) on revenues of $12.72 billion (slightly lower than the $12.78 billion consensus expectations).
1Q24 Earnings (Intel Corporation)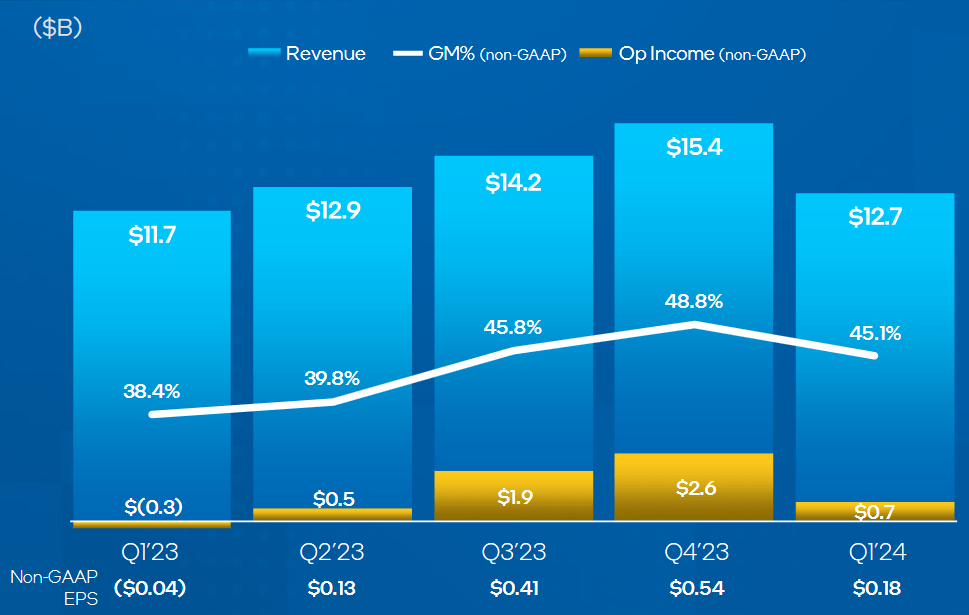
Overall, these revenue figures indicate annualized growth rates of 9% and these improvements stem largely from better performances in Intel’s artificial intelligence, personal computing, and data center segments. However, we do feel that most of this information has already been priced into the market – and we are looking for new price regions to begin adding to our long position at these discounted price levels.
1Q24 Earnings (Intel Corporation)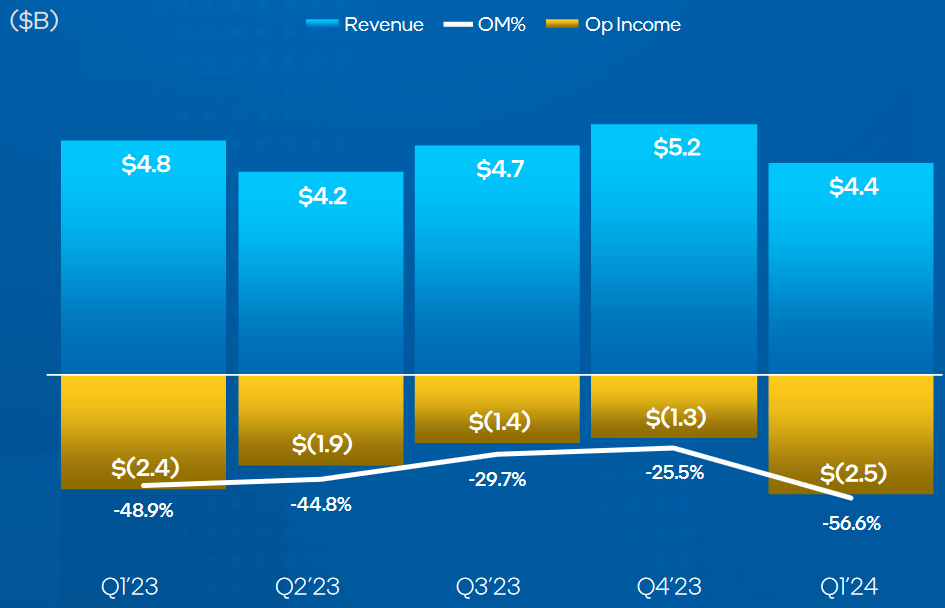
Going forward, the company’s revenue guidance for the second-quarter period indicates a top-line range of $12.5 billion to $13.5 billion, which still falls below the prior consensus estimates (13.79 billion). But perhaps most disappointing were the revenue figures from the company’s foundry unit, where Intel recorded annualized declines of 10% (at $4.4 billion). In his description of this quarterly performance, Intel CEO Pat Gelsinger explained:
We are making steady progress against our priorities and delivered a solid quarter. Strong innovation across our client, edge and data center portfolios drove double-digit revenue growth in Intel Products. With Intel 3 in high-volume production, leading-edge semiconductors are being manufactured in the U.S. for the first time in almost a decade and we are on track to regain process leadership next year as we grow Intel Foundry.
We are confident in our plans to drive sequential growth throughout the year as we accelerate our AI solutions and maintain our relentless focus on execution, operational discipline and shareholder value creation in a dynamic market.
However, given the market’s response in the trading periods that followed, it looks as though investors are not quite convinced of Intel’s turnaround prospects. Next, we will take a look at INTC price charts on various timeframes to identify potential price targets that can be used to establish contrarian positions with share prices trading at extremely depressed levels.
INTC: Monthly Chart (Income Generator via TradingView)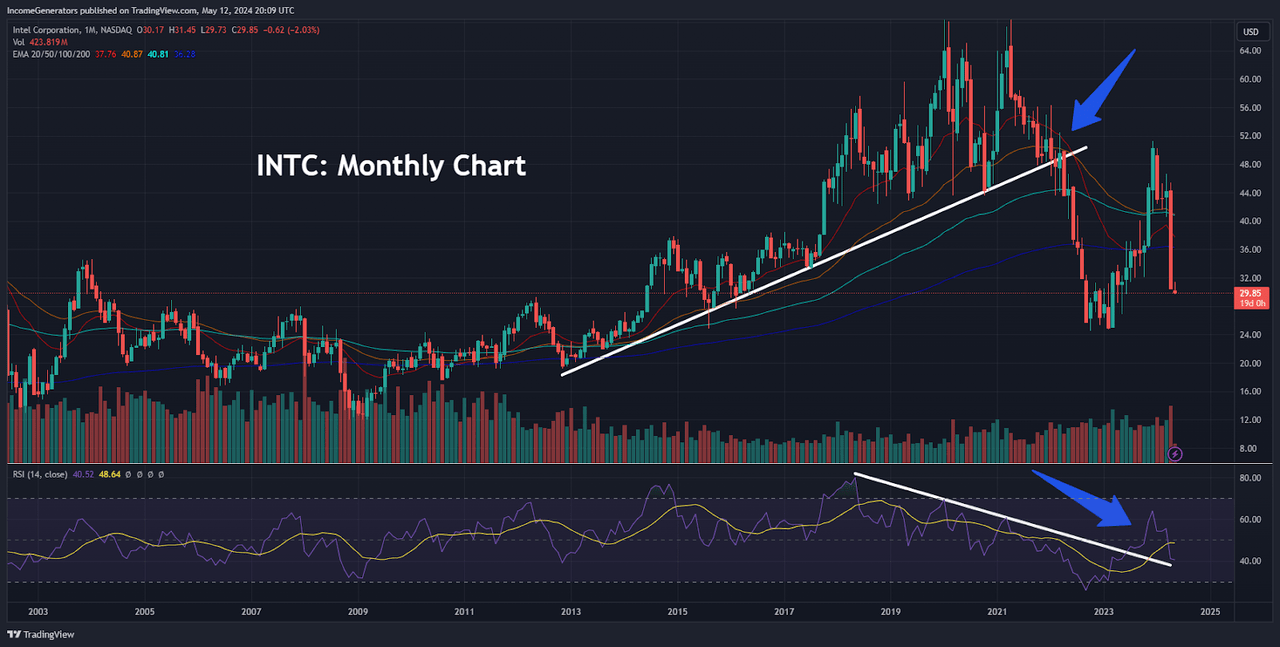
On the monthly charts, we can see that April 2024 was one of the worst stock performance periods in the company’s history. Recent selling pressure has forced share prices through all of the major exponential moving averages on this timeframe, and we are quickly approaching critical support zones as defined by the stock’s October 2022 lows.
Interestingly, we can see that monthly indicator readings in the Relative Strength Index (‘RSI’) worked as a precursor to this series of negative events, as a bearish divergence condition was clearly present during INTC’s decade-long march higher (beginning near the end of 2012). Fortunately, we are now seeing an end to these bearish RSI conditions on the monthly charts – and this indicates that the current downtrend may be reaching a point of exhaustion.
INTC: Monthly Chart (Income Generator via TradingView)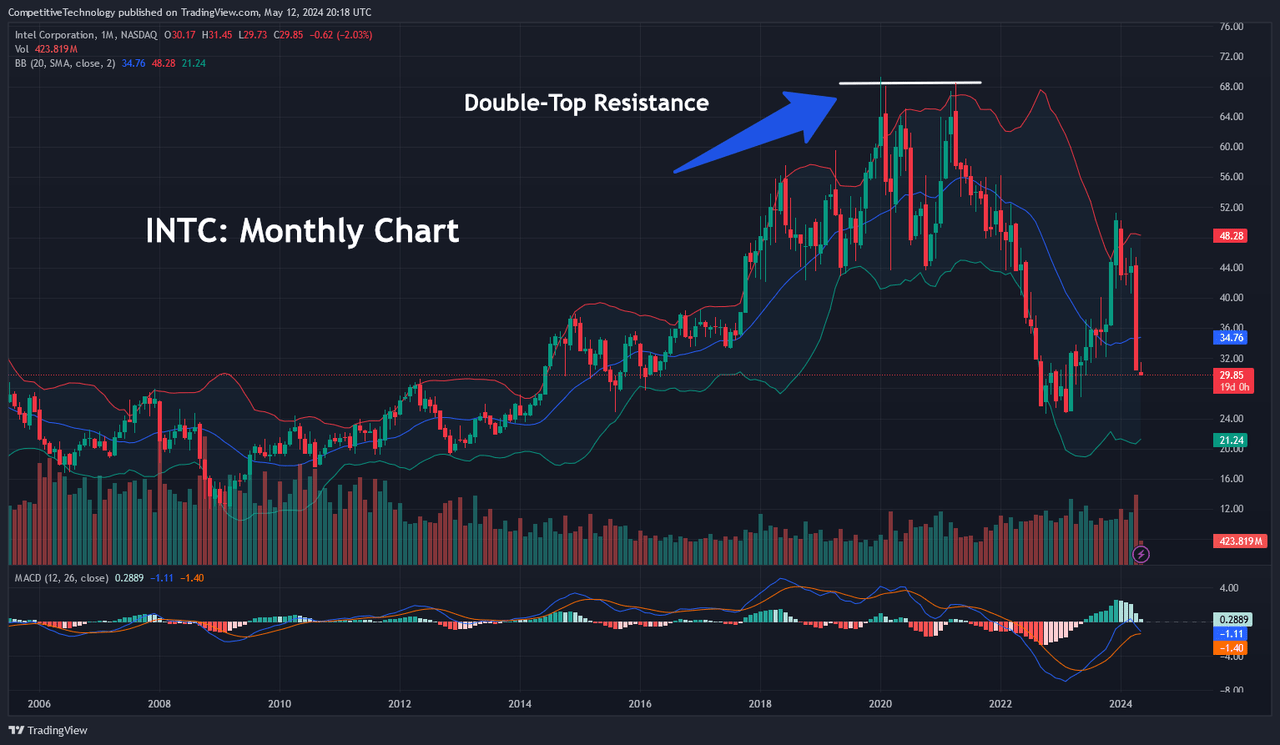
In this alternate monthly chart, we have outlined an important double-top resistance zone near $68.40, which essentially marks the spike highs from January 2020 and April 2021. Going forward, this will be the key area of resistance for bullish traders with long positions in INTC. However, we are still quite a distance from this potential resistance zone, so we will not be viewing this area as problematic until we are able to see a significant reversal in share prices.
INTC: Weekly Chart (Income Generator via TradingView)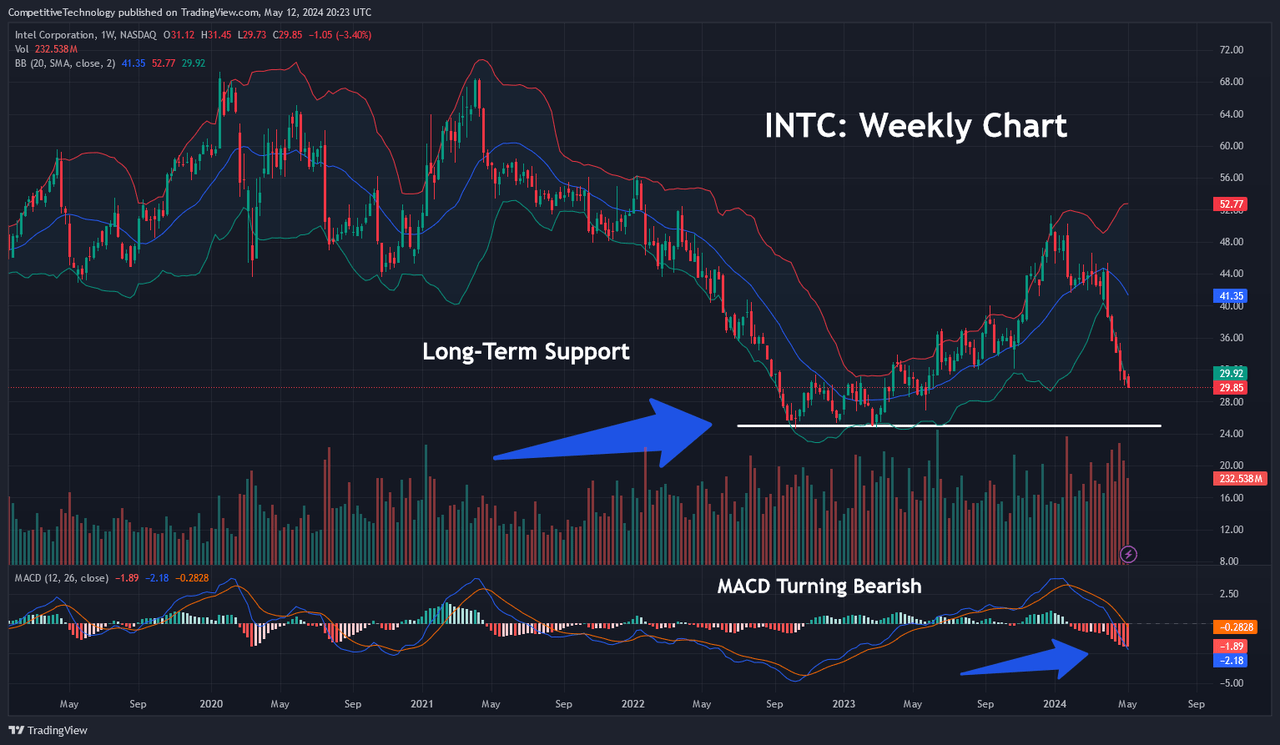
Near-term, investors will need to place a much greater level of focus on support levels, given the strongly bearish momentum that continues to characterize INTC share prices. Specifically, we are anticipating a test of support near $24.59, which marks the October 2022 lows that were tested on three separate occasions. Given the bearish readings that we are currently seeing in the weekly Moving Average Convergence Divergence (MACD) indicator, it looks likely that we will have an opportunity to re-test this support zone in the weeks ahead.
On the positive side, we can see that share prices have fallen quite sharply through the lower Bollinger Band (which does suggest that the downtrend might need a period of consolidation before this re-test of support can take place). However, we will maintain this view as long as weekly indicator readings remain negative, and share prices fail to break through near-term resistance levels near $51.30.
INTC: Weekly Chart (Income Generator via TradingView)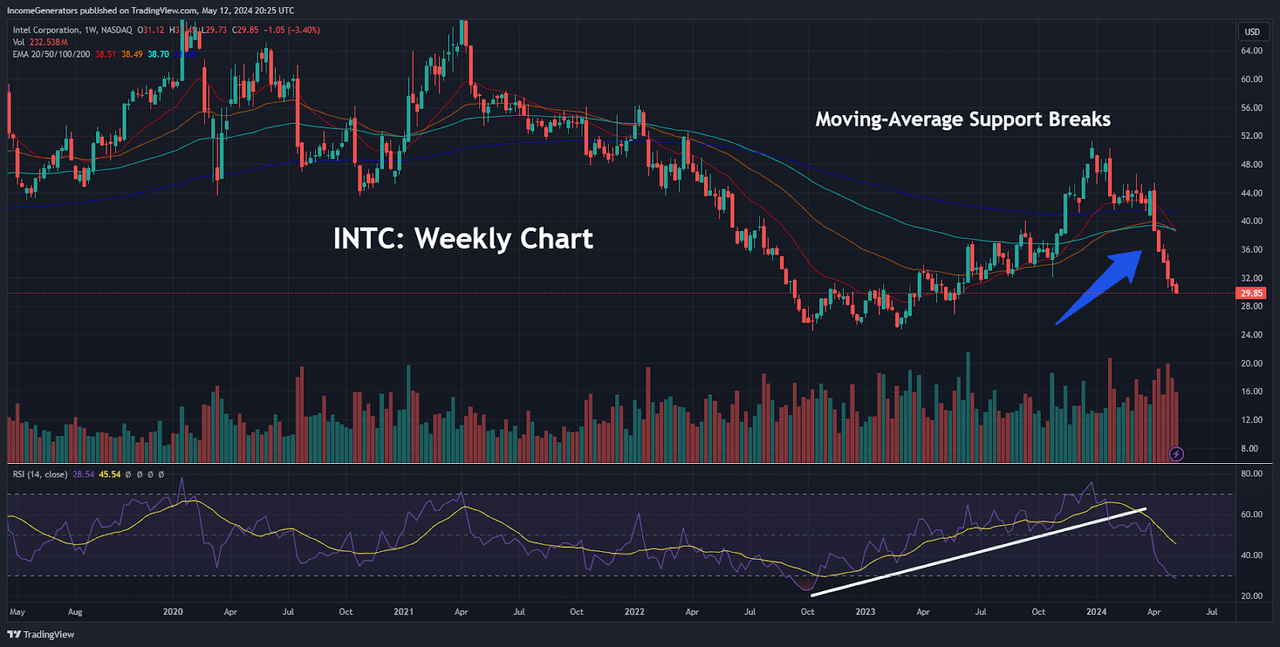
Finally, we would like to take a look at two shorter-term charts which more clearly show the current position of share prices in relation to their exponential moving averages. In the chart above, we can see the 20-week, 50-week, 100-week, and 200-week exponential moving average cluster. In this instance, each of these exponential moving averages is positioned near the $40 level, so this suggests that it might not take a great deal of buying activity to start changing the outlook toward a more favorable viewpoint.
INTC: Daily Chart (Income Generator via TradingView)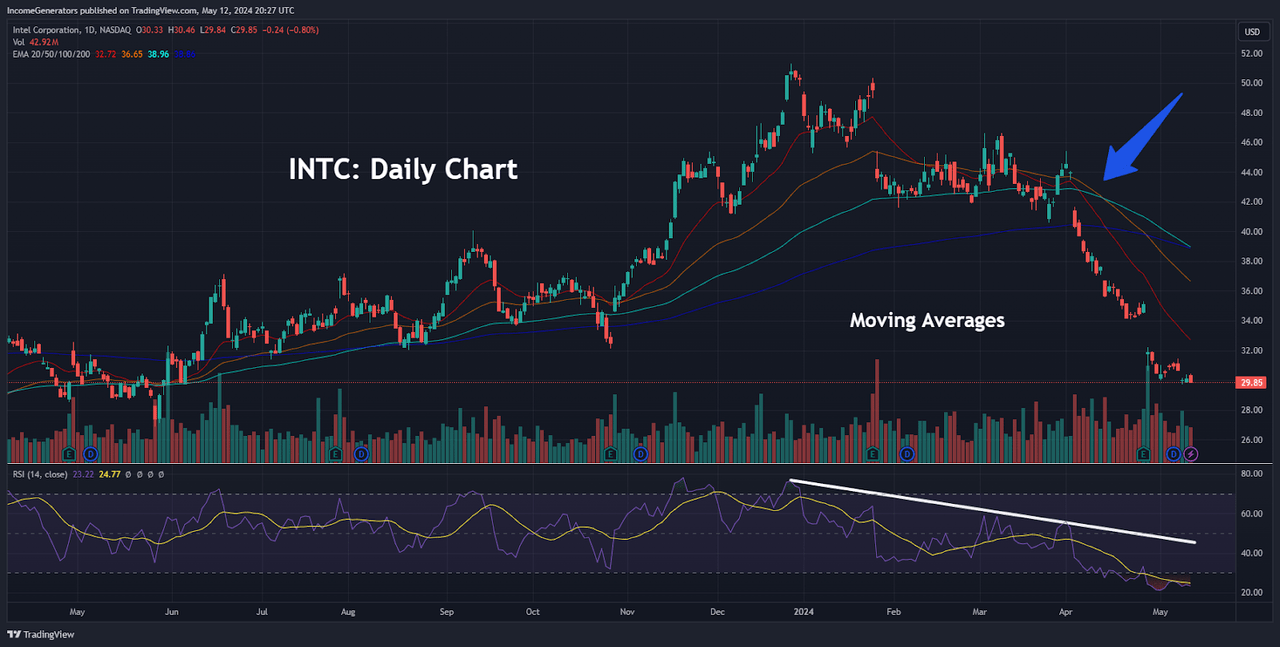
On the daily timeframes, trend activity in the exponential moving averages looks much more erratic and these signals can be viewed within the context of a bearish daily RSI reading. However, given the current slope of the 20-day, 50-day, and 100-day exponential moving averages, it is clear that share prices would not need to see very much upward momentum in order to change the outlook (and force an upside signal break).
On balance, we can see that there is clear scope for further downside activity in INTC stock values. However, given the over-extended nature of recent declines in share prices (and the close proximity that we are seeing currently in relation to our downside price target of $24.59), we will be looking for near-term entry points to add to our established long position in anticipation of upcoming reversals higher.
Following the release of Intel’s Core Ultra processors in December 2023, the company has already surpassed the 5 million milestone in the total number of artificial intelligence computer systems that have been sent globally. Before the end of this year, Intel still expects to surpass initial projections (40 million artificial intelligence computer systems), and we believe that large portions of the market are failing to grasp the long-term nature of the company’s recent advancements in the surging artificial intelligence industry.
Further technological accomplishments can be found in the Gaudi 3 AI Accelerator, which is expected to achieve faster inference levels (50% on average) and superior inference power efficiency in advanced generative artificial intelligence models when compared to Nvidia’s H100 offering, and we believe that these accomplishments are likely to support Intel share prices in the quarters ahead. As a result, we remain long the stock, and we will be looking to add to our position if we see further declines into the lower $20s.
Analyst’s Disclosure: I/we have a beneficial long position in the shares of INTC either through stock ownership, options, or other derivatives. I wrote this article myself, and it expresses my own opinions. I am not receiving compensation for it (other than from Seeking Alpha). I have no business relationship with any company whose stock is mentioned in this article.
Seeking Alpha’s Disclosure: Past performance is no guarantee of future results. No recommendation or advice is being given as to whether any investment is suitable for a particular investor. Any views or opinions expressed above may not reflect those of Seeking Alpha as a whole. Seeking Alpha is not a licensed securities dealer, broker or US investment adviser or investment bank. Our analysts are third party authors that include both professional investors and individual investors who may not be licensed or certified by any institute or regulatory body.
