Summary:
- Intel stock is currently undervalued with revenue stabilizing, despite weak earnings and bearish technical signals in the short term.
- Intermediate-term technicals show positive signs, including narrowing moving average gaps and bullish indicators, suggesting potential for a trend reversal.
- The long-term outlook remains uncertain, but bullish divergences in indicators hint at a possible bottom for Intel stock.
- Risk-tolerant investors may find a good risk/reward setup, as valuation multiples are near five-year lows despite improving revenue stability.
tupungato
Thesis
Intel Corporation (NASDAQ:INTC) investors have had to endure a lot of pain in the past few years but there may finally be some light at the end of the tunnel. In the below technical analysis I determine that despite weak charts in all time frames, there are significant indications that strength is starting to build underneath the surface. As for the fundamentals, while current earnings results are still weak, revenue seems to be stabilizing relatively well. Despite revenue being at the most stable position in years, valuation multiples are near five year lows, making the stock, in my view, undervalued currently. For conservative investors, Intel stock may still be too risky with still many bearish signals present but for investors that don’t mind the risk, now may be a great opportunity to get into the stock early to maximize gains. Therefore, I initiate Intel at a buy rating.
Daily Analysis
Chart Analysis
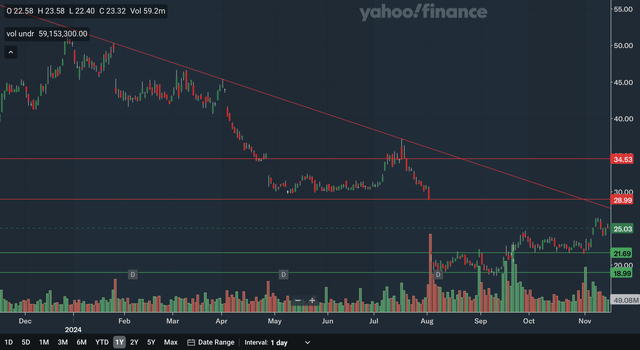
In the daily chart, the stock remains in a short term downtrend. This downtrend line has been in effect since late last year. The nearest source of resistance would be this downtrend line as it currently nearing 27.5 and dropping quite fast. This line could pressure the stock in the near future. The next level of resistance would be in the high 20s as that represents a downside gap back in early August. There should also be resistance in the mid 30s as that is another downside gap at that level. Note that there has been multiple major downside gaps this year perhaps indicating that the stock is now oversold. For support, the nearest area would be in the low 20s as that price level was resistance back in August and September and was support in October. Lastly, there is support at around 19 as that level was support in August and September. This could also be a double bottom formation, indicating that the bottom is in for Intel. Overall, I would say the daily chart is a net negative one as being in this downtrend overshadows the other signals here.
Moving Average Analysis
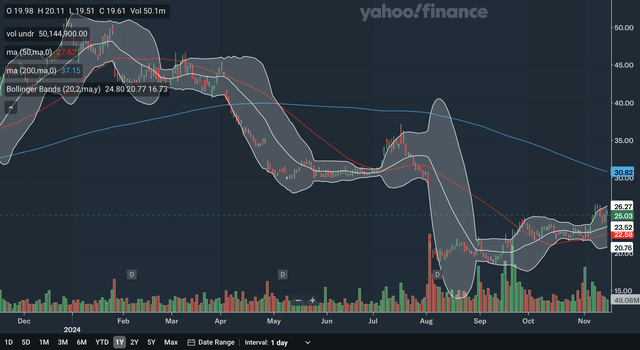
The 50 day SMA crossed below the 200 day SMA back in early May which is a bearish signal and the stock has dropped since. Currently, the 50 day SMA is closing the gap significantly with the 200 day SMA showing that bearish momentum is receding. The stock is also trading above the 50 day SMA now, another sign of strength. For the Bollinger Bands, the stock was above the upper band earlier this month, showing it was near term overbought. The 20 day midline could be the nearest MA support for Intel. If the stock does bounce off the midline, it may indicate that the stock has entered into a nearer term uptrend. From my analysis, although the 50 day SMA is still below the 200 day SMA, there are some encouraging signs emerging.
Indicator Analysis
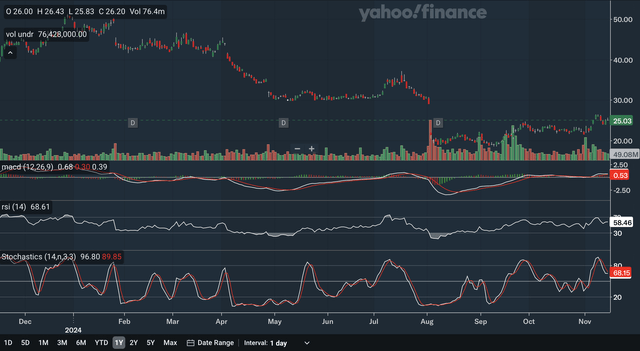
The MACD is currently still above the signal line after a bullish crossover earlier this month. The gap between the two lines has narrowed somewhat, reflecting the overbought pullback as shown by the Bollinger Bands. For the RSI, it is currently at 58.46 after reclaiming the critical 50 level recently, showing that the bulls are now relatively in control of the stock. Lastly, for the stochastics, the %K line crossed below the %D line within the overbought 80 zone earlier this month, a bearish signal. However, as you can see, the %K has stopped dropping while the %D continues its sharp descent, meaning that a bullish crossover could be imminent. As a whole, I believe these daily indicators show a slightly net positive short term picture for Intel as there were some important signs of strength here.
Takeaway
Overall, from these analyses, the short term picture is still slightly net negative in my view. However, there are also encouraging signs from all three analyses as well. The chart shows the stock is still in a downtrend but there also seems to be a double bottom. The moving averages are still in a bearish crossover but the gap is quickly tightening. Lastly, as discussed above, the indicators were also slightly net positive.
Weekly Analysis
Chart Analysis
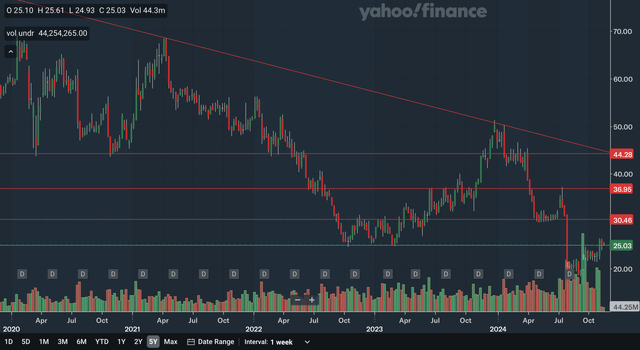
The weekly chart is another negative one for Intel. The stock remains in an intermediate term downtrend that dates back to 2021. The only area of support would be right at the stock’s current level. The mid-25s level was strong support back in late 2022 and early 2023, making this area highly significant. For resistance, the nearest zone would be at 30 as that area was strong resistance back in 2022 and 2023 and was support earlier this year. The mid-30s is also a key resistance level, as it was strong resistance in 2023 and in the middle of this year. Moving up, we have resistance in the mid-40s as that price level was key support in 2020 and 2022, and was also a bit of resistance earlier this year. Lastly, the downtrend line is also at the mid-40s and can become increasingly relevant as it continues to slope downward. Overall, the weekly chart is negative as the stock remains in a downtrend with heavy resistance above.
Moving Average Analysis
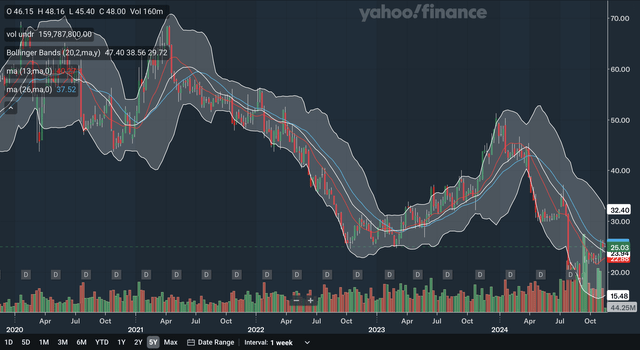
The 13-week SMA crossed below the 26-week SMA earlier this year, a bearish signal. The stock has plunged since this crossover, but lately the gap between the SMAs has narrowed considerably, again indicating receding bearish momentum. The stock trades above the 13-week SMA currently and is right at the 26-week SMA, a signal of strength. For the Bollinger Bands, there is a significantly bullish signal. The stock has reclaimed the highly important 20 week midline, an indication that the intermediate term downtrend could be ending. This midline is also now the nearest MA support for Intel stock. Despite the 13-week SMA remaining below the 26-week SMA, the overall message here is positive, as the reclaiming of the midline is too bullish of a signal to ignore.
Indicator Analysis
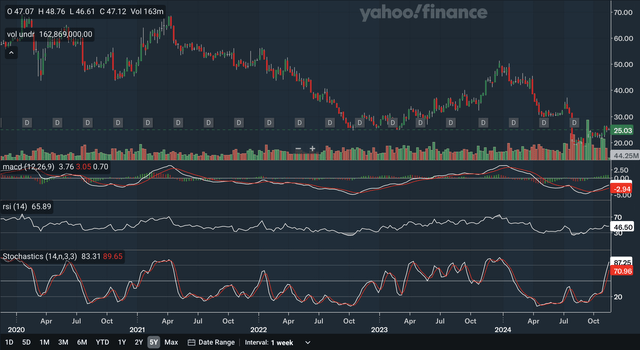
Bullish signs continue into the weekly indicators. The MACD is currently above the signal line after a bullish crossover at the start of October. The gap between the lines has been healthy as demonstrated by the strong histogram. There is also modest positive divergence with the MACD as it held above its 2022 low earlier this year while the stock plunged lower than levels seen back in 2022. For the RSI, it is currently at 46.50, still below the important 50 level. However, there is also positive divergence here as well. The RSI low this year also held above the 2022 low, a bullish signal as this could be a bottom failure swing. Lastly, for the stochastics, the %K had a bullish crossover with the %D back in October. For the first time since the beginning for the year, the %K is back in the 80 zone, showing just how bullish investors are currently. In my view, these weekly indicators are very bullish and show that the intermediate term outlook is beginning to brighten.
Takeaway
Despite the bearish weekly chart, I believe the intermediate term technical outlook has become net positive with the MAs and indicators showing important signals of strength. The chart showed the stock remains in a downtrend but the Bollinger Bands signal that this downtrend may now be ending. Lastly, as discussed above, the indicators are also highly positive.
Monthly Analysis
Chart Analysis
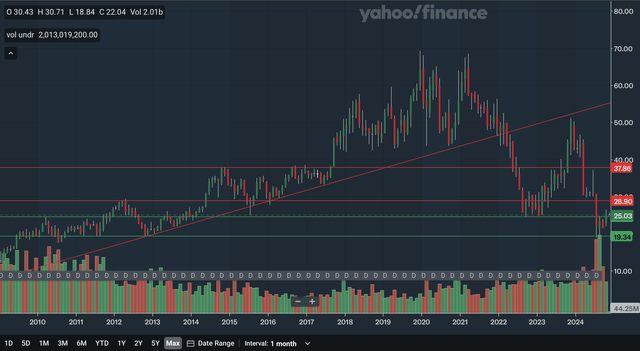
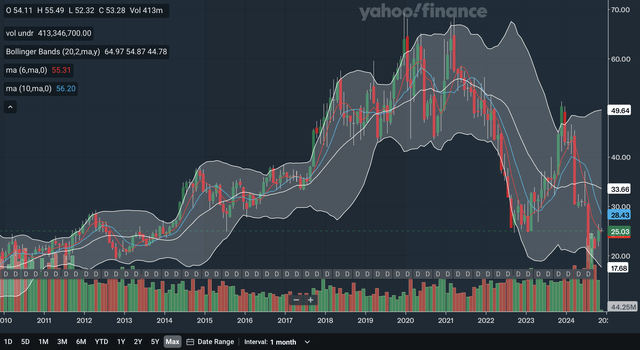
The monthly chart is also not a positive one. The stock broke an important uptrend line in 2022 that dated back over a decade. This former uptrend line actually acted as resistance back at the end of last year. The nearest support level would be at current levels. As you can see, this level’s significance stretches back for years, as it was support even back in 2015. The other support zone would be at around 20 with that level being solid support back in 2011 and 2012. As for resistance, the nearest area would be in the high 20s as that area was resistance in 2012 but was support in 2015 and 2016. The mid to high 30s is also significant resistance as it was heavy resistance in 2014, 2016, and 2017. Lastly, as discussed above, the former uptrend line is also resistance, but it is moving out of relevance for the near future. From my analysis, the monthly chart is net negative, with the stock not in any longer-term uptrend.
Moving Average Analysis
The 6-month SMA had a bearish crossover with the 10-month SMA just earlier in the year, and the stock has plunged since this signal. The gap has narrowed slightly recently, with the 6-month SMA’s trajectory improving somewhat, showing a modest decrease in bearish momentum. The stock currently trades right at the 6-month SMA. For the Bollinger Bands, the stock neared the lower band in the past few months, showing it was oversold and that a bounce was not surprising. The stock is currently still significantly below the 20-month midline, as there is not much hope for a regaining of that line in the near future. As a whole, these MAs are still net bearish in my view, as the subtle signs of strength with the SMAs are unable to counteract the overall negative picture.
Indicator Analysis
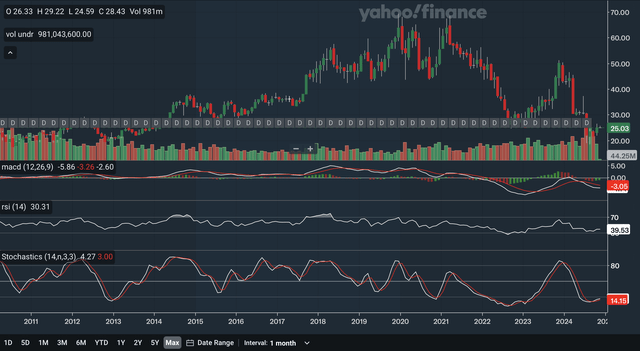
The MACD is currently below the signal line after a bearish crossover earlier in the year, but the gap is narrowing as shown by the histogram. The more important signal here is the long term positive divergence. The stock dropped below the late 2022/early 2023 lows earlier this year, but note that the MACD has held up far above its lows of late 2022. This is a significantly bullish signal that the long-term bottom may be in. The RSI, to a lesser degree, also shows this positive divergence as its low this year also held above 2022 lows. The RSI of 39.53 is still currently quite weak, however, as it remains below the 50 level. Lastly, for the stochastics, the %K has crossed above the %D within the oversold 20 zones, a highly bullish signal. In addition, the stochastics also shows the bullish divergence as its low this year also held above its 2022 lows. As a whole, I would say these monthly indicators were highly bullish, as there are many signs that the long-term bottom is in for Intel stock.
Takeaway
With the monthly chart and MAs still negative, one should not say that the long-term picture is bright. However, considering the highly bullish signals from the indicators, I would say that there is hope for Intel stock in the long term. The charts showed that the stock remained broken down from the uptrend, while the Bollinger Bands were still negative. The indicators were really the source of light here, and they show that there can still be a bright future for Intel stock.
Fundamentals & Valuation
Earnings
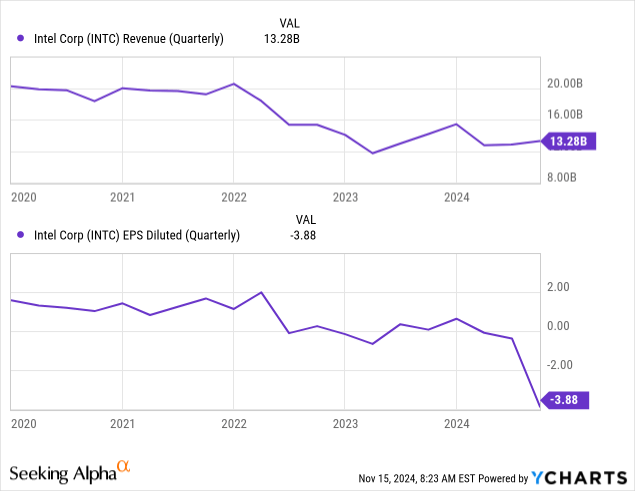
In late October, Intel released their 2024 Q3 earnings and showed weak results overall. They reported revenues of $13.3 billion, down 6% YoY. Some highlights in their revenue breakdown include Data Center and AI revenue being up 9% YoY but Intel Foundry revenue down 8% YoY. For EPS, they reported a GAAP figure of -$3.88 compared with the prior year period’s $0.07. Revenue beat expectations by $280.82 million while they missed on EPS by $3.63. Their operating margin figures are quite concerning as they reported -68.2% versus -0.1% in the prior year period. Despite these weak results, they were able to pay total dividends of $0.5 billion. As you can see in the chart above, while revenue has steadied somewhat, EPS is still highly negative and is in a potentially worrying trajectory as well.
Valuation
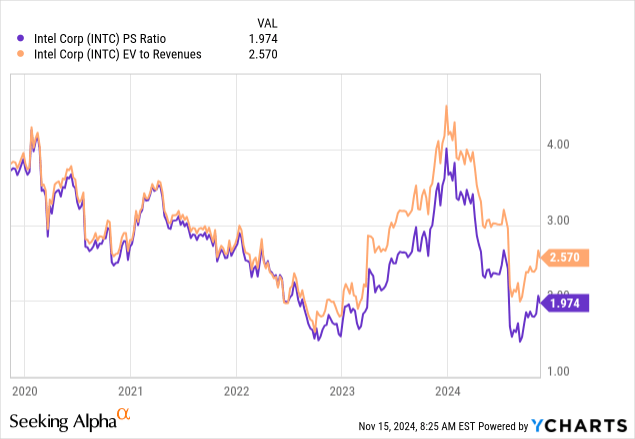
Intel’s current earnings are negative, and so the P/E ratio is not meaningful. Currently, Intel’s P/S and EV/Revenues ratios are at relatively low levels after crashing from the peak seen at the end of last year. The P/S ratio is at around 2.0 after being at 4.0 at the end of last year but has rebounded from about 1.5 seen a couple of months ago. As for the EV/Revenues ratio, it is currently at 2.57 after being over 4.5 at the end of last year. The EV/Revenues ratio was as low as 2.0 a few months ago. Both of these ratios focus on Intel’s revenues, and so we will compare it with the revenue chart above. After years of downward trajectory, revenues are finally seeming to stabilize somewhat for Intel. Despite the Q3’s YoY declines, revenue remains above 2023 lows. As discussed above, the valuation multiples are at quite low levels compared to the past five years, despite rebounding a bit lately. With revenue at the most stable position in years, I believe Intel stock is currently undervalued, as I believe its valuation multiples fail to reflect the improving trajectory of revenues.
Conclusion
While the technical analysis overall still showed a mixed picture, the important message here is that there are reasons to be hopeful for Intel stock. The short-term technicals are still slightly net negative, but the intermediate term has already turned positive. In addition, despite an uncertain long-term outlook, there are important signs of strength that could be green flags for risk-tolerant investors. For the fundamentals, while valuation multiples are near five-year lows, revenue is the most stable it has been in years, making the stock undervalued according to the P/S and EV/Revenue ratios. Overall, I believe there is no question that Intel stock is still a high-risk proposition. However, I also believe that at this juncture, investors that don’t mind the risk may be looking at a good risk/reward setup as the stock has signs of bottoming.
Analyst’s Disclosure: I/we have no stock, option or similar derivative position in any of the companies mentioned, and no plans to initiate any such positions within the next 72 hours. I wrote this article myself, and it expresses my own opinions. I am not receiving compensation for it (other than from Seeking Alpha). I have no business relationship with any company whose stock is mentioned in this article.
Seeking Alpha’s Disclosure: Past performance is no guarantee of future results. No recommendation or advice is being given as to whether any investment is suitable for a particular investor. Any views or opinions expressed above may not reflect those of Seeking Alpha as a whole. Seeking Alpha is not a licensed securities dealer, broker or US investment adviser or investment bank. Our analysts are third party authors that include both professional investors and individual investors who may not be licensed or certified by any institute or regulatory body.
