Summary:
- I own a good amount of both Berkshire Hathaway and Apple.
- As such, it has been a FAQ among the members of our investing group if we have to worry about overexposure risks.
- After all, more than 20% of Berkshire’s market cap is already tied with Apple.
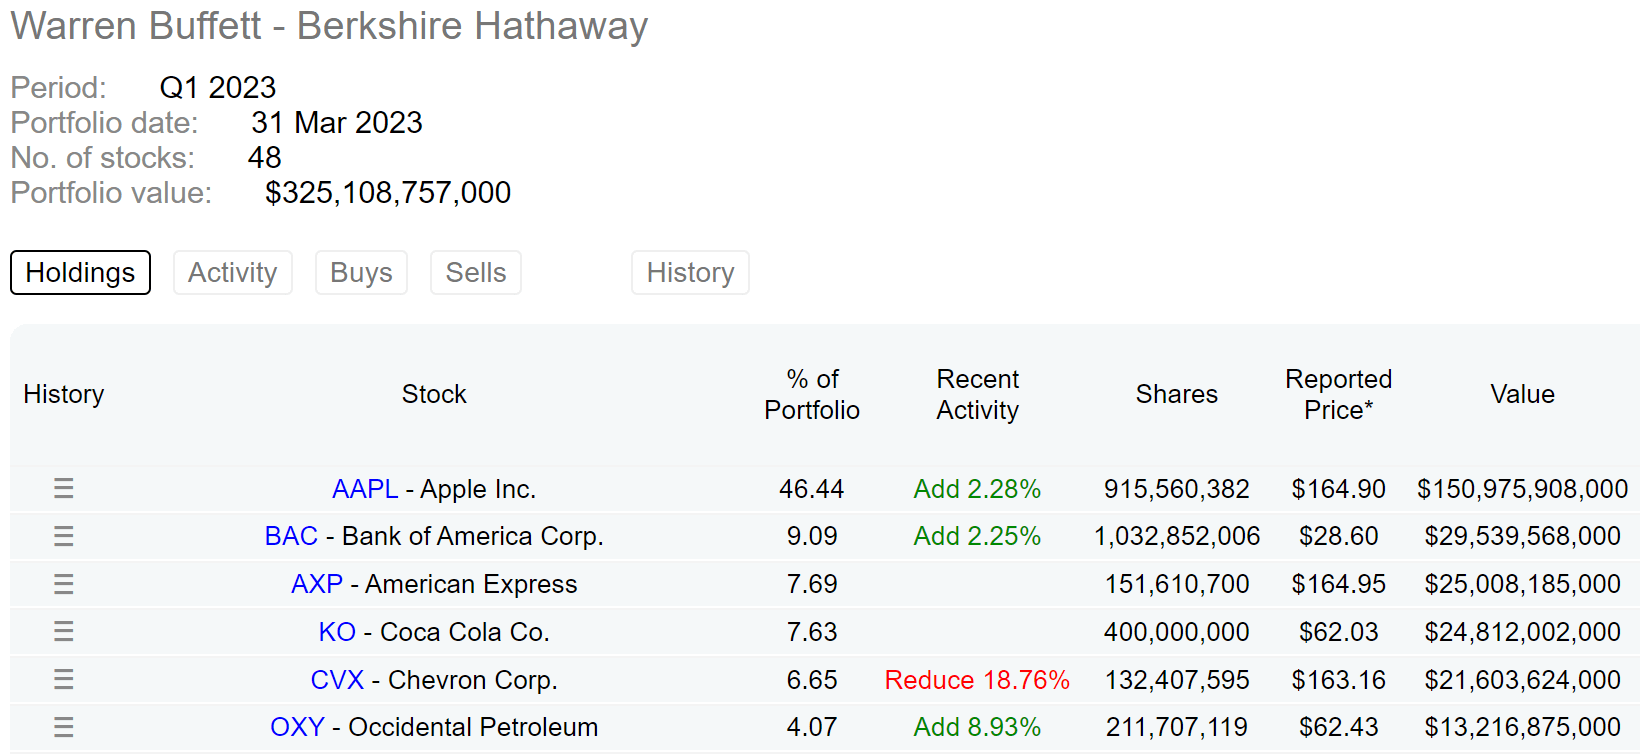
- The question just became more relevant as Berkshire’s latest disclosure showed that it further upped its Apple stake in Q1 2023.
- This article organizes my exchanges with my members in a more coherent way to show why I am not worried. Instead, I only wish to see further concentration.
designer491
Thesis
I am a long-term holder of Apple (NASDAQ:AAPL) shares, and readers following my writing know that I have also been very vocal about my bullish position. It is less publicized that I have also become a shareholder of Berkshire Hathaway (NYSE:BRK.B) recently, since around September 2022. Like many other value investors, I always have had an interest in BRK. But it is just so overpriced in my view in recent years. For example, in March 2022, I wrote an article to show how expensive it is (what I called a 3-sigma event) despite its stable earning power. Purely due to luck, the timing of that article also coincided with the peak of its stock price. Then came the corrections.
Long story short, in September 2022 amid stock market corrections, we published some posts to alert our investing group members that we have set some orders to buy APPL shares at $140 and BRK shares at $255. In the end, our AAPL order was triggered at $140 but we had to raise our bidding price to about $165 to get the BRK shares.
Since then, members of our investing group have frequently asked us about the overexposure risks. For good reasons. Specifically, we already hold some index funds like VTI as part of our core portfolio, and these indexes are already exposed to AAPL to a substantial degree (see the chart below). And secondly, the exposure of BRK to AAPL is even more dramatic. As of this writing, more than 21% of BRK’s market cap is in AAPL after it further increased its exposure by 2.28% in Q1 2023 (see the second chart below)
The goal of this article is to compile the FAQ exchanges with my members in a more coherent way. And the thesis is to show why I am not worried. Instead, I only wish to see further concentration. In a nutshell, my core arguments will be twofold: A) I view the overall market as a deworsification compared to AAPL or BRK, and B) simple math will show that the double-compounding between BRK and AAPL is even more powerful than the compounding power at either place alone.
Source: Author Source: DataRoma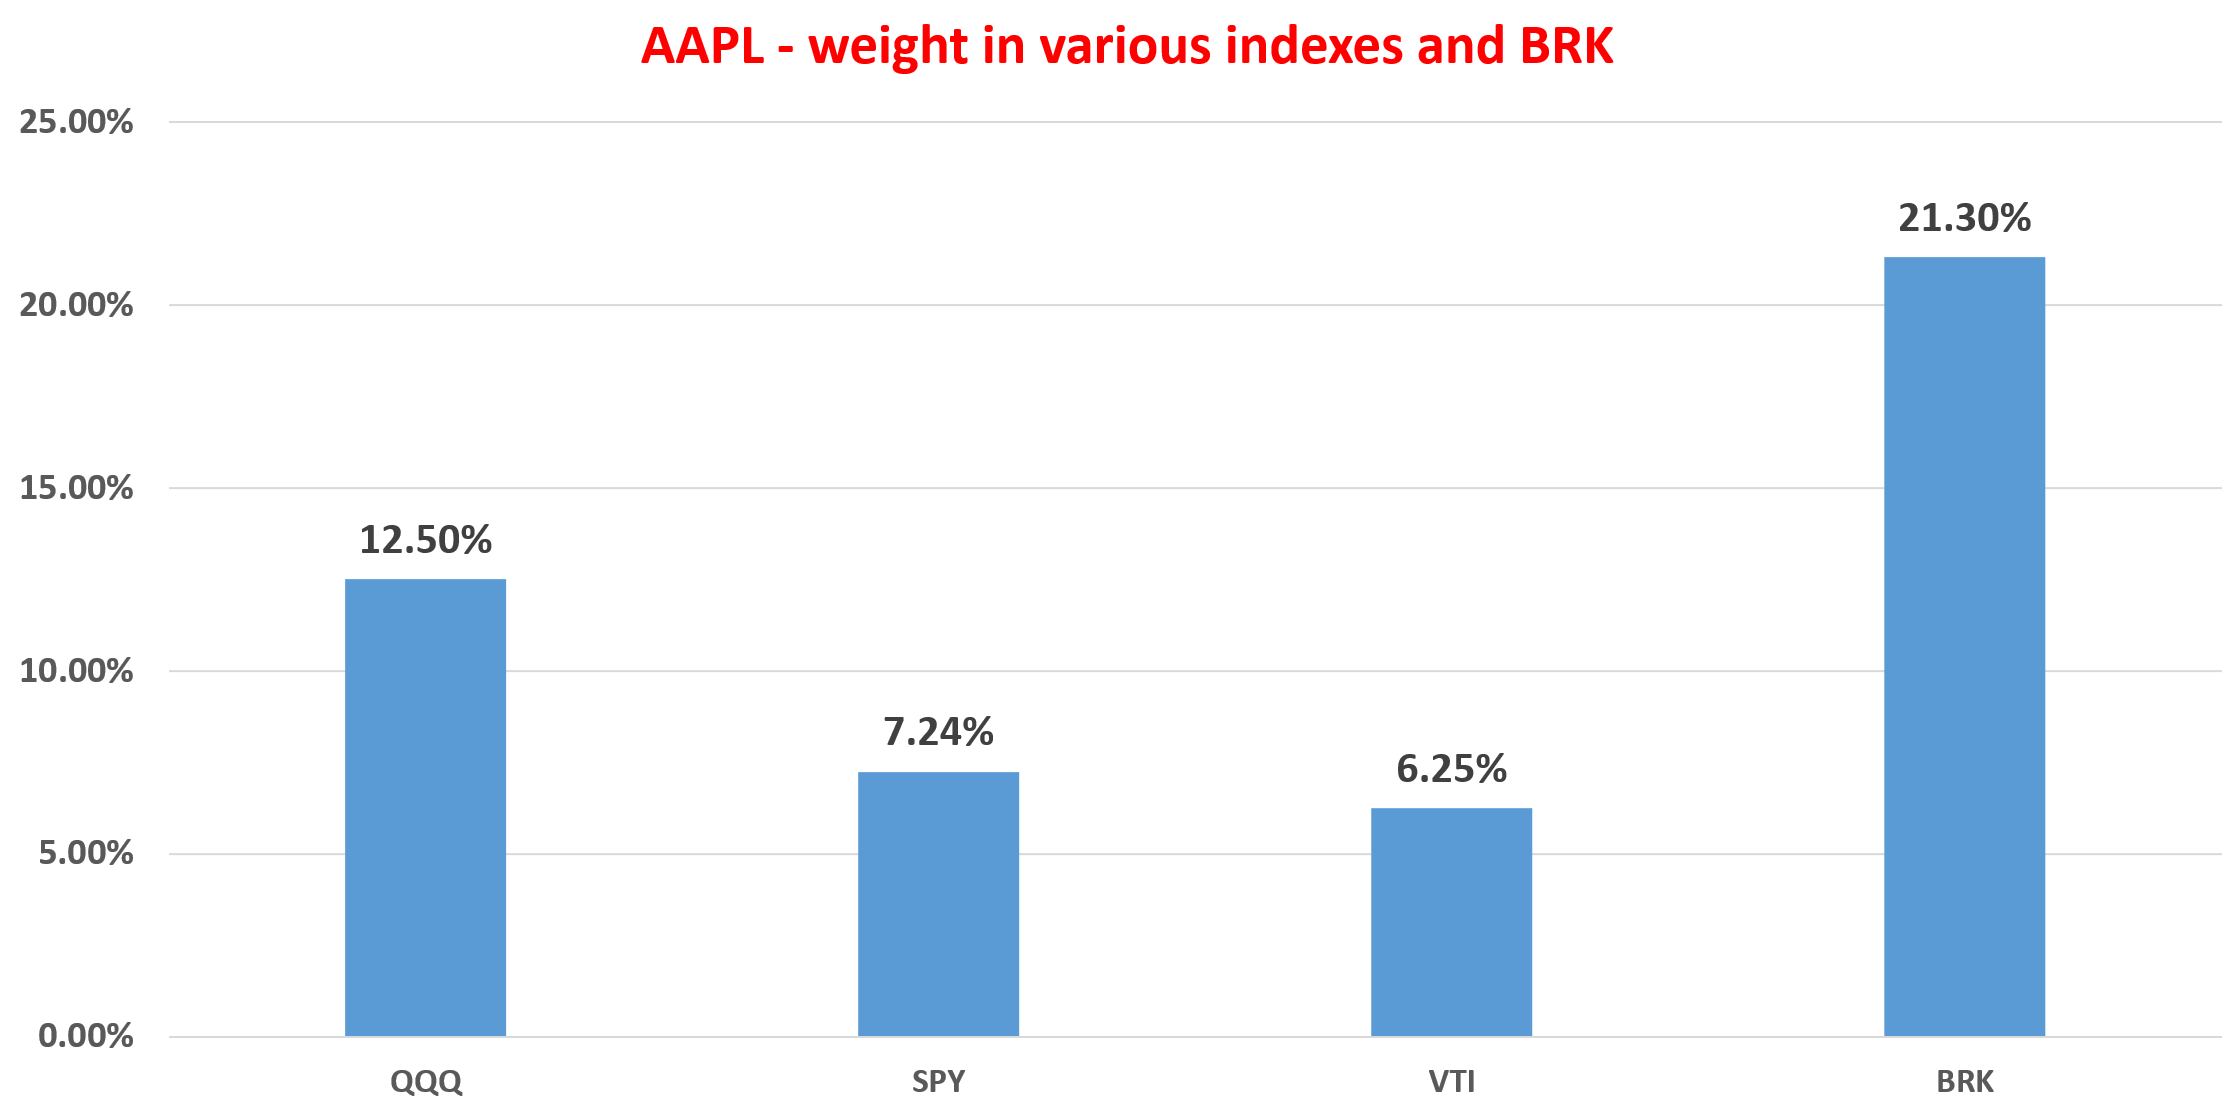
AAPL, BRK, and Li Lu
But before anything else, we want to emphasize that risk tolerance is completely individual. Chances are that you already have a good amount of exposure to AAPL without holding any AAPL or BRK shares. As seen in the chart above, the NASDAQ 100 index (approximated by QQQ) has a 12.5% exposure to AAPL, the S&P 500 (represented by SPY) about 7.24%, and the US total market index (represented by VTI) about 6.25%.
We are very aware of our risk tolerance ourselves, and we won’t let others’ risk tolerance represent ours either, which brings me to talk about Li Lu’s position. As shown in the chart below, his Himalaya Capital Management holds a total of 6 positions (if you consider GOOGL and GOOG to be equivalent). And three of these 6 positions are BRK, BAC, and APPL. Bear in mind that BAC and APPL are by far the largest two positions in BRK’s equity portfolio. As our readers know, we like a concentrated portfolio ourselves, and we share many of the core investing principles that Li Lu practices. But we are very aware that we cannot tolerate concentration risks at Li Lu’s level.
With this disclaimer, we will move on to explain why I am not concerned about BRK’s overexposure to AAPL at all. And maybe my thoughts also happen to overlap with some of Li Lu’s.
Source: DataRoma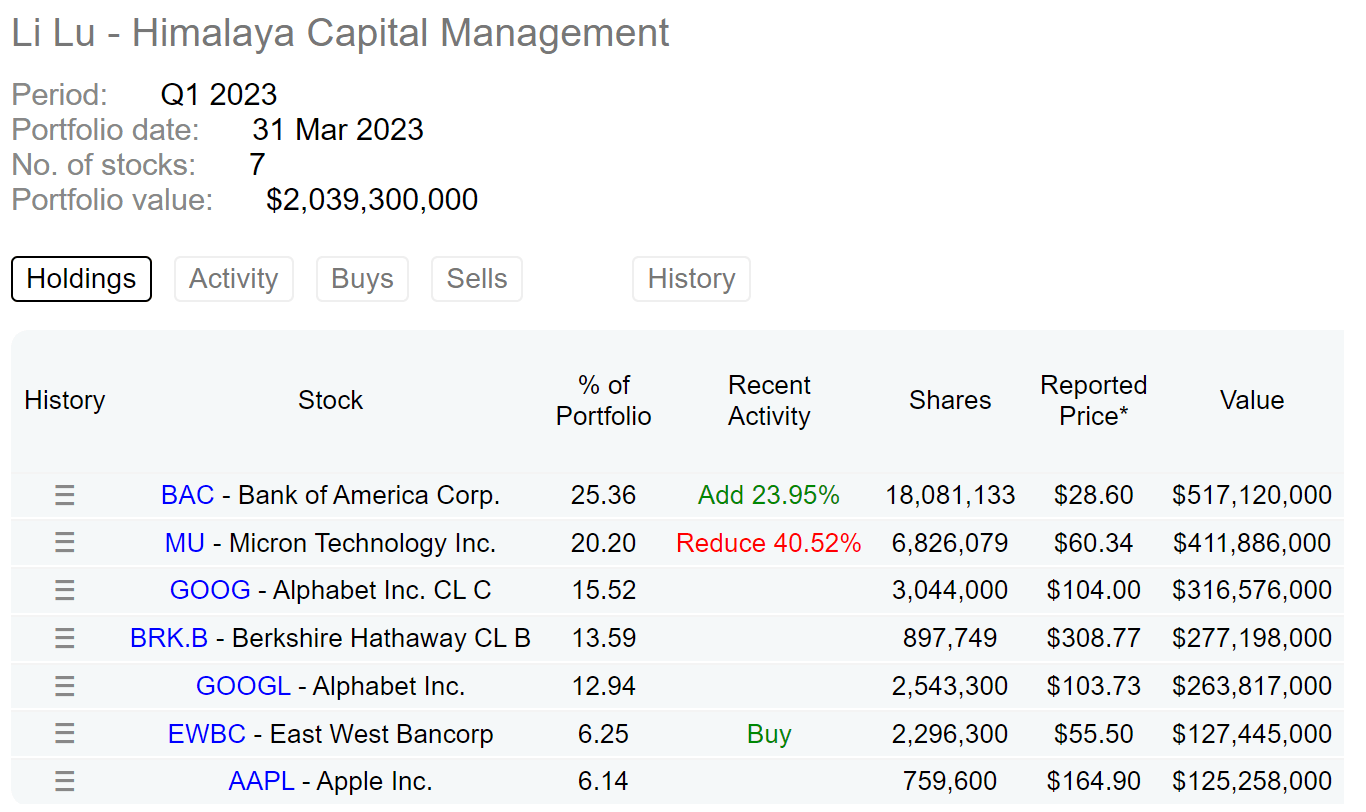
Diversification vs. deworsification
The following two charts provide a comparison of the fundamentals between AAPL, BRK, and the S&P 500 index. The comparison includes various aspects ranging from valuation, and financial strength, to profitability. Note that the data used in my estimations are gathered from various sources including Seeking Alpha, Yahoo Finance, FRED, and also MULTPL.com.
As seen, in terms of valuation, AAPL’s P/E ratio is indeed higher than the overall market, by about 23%. However, when considering leverage-adjusted multiples like the EV/EBIT ratio, AAPL’s premium is lower than what is on the surface, only about 19% higher than the overall economy. I view such a premium as easily justifiable given its financial strength and profitability. Regarding financial strength, AAPL outperforms most businesses in the S&P 500 index. For example, when looking at debt coverage, which is calculated by dividing EBIT income by net interest expenses, AAPL’s ratio is around 25.19x, more than double my estimate for the S&P 500 averages (about 10.23x). In terms of profitability, AAPL’s superiority is even more pronounced. Its operating margin and net profit margin are about 2x and 3x higher. And its ROCE (return on capital employed) is about 5x higher.
Source: Author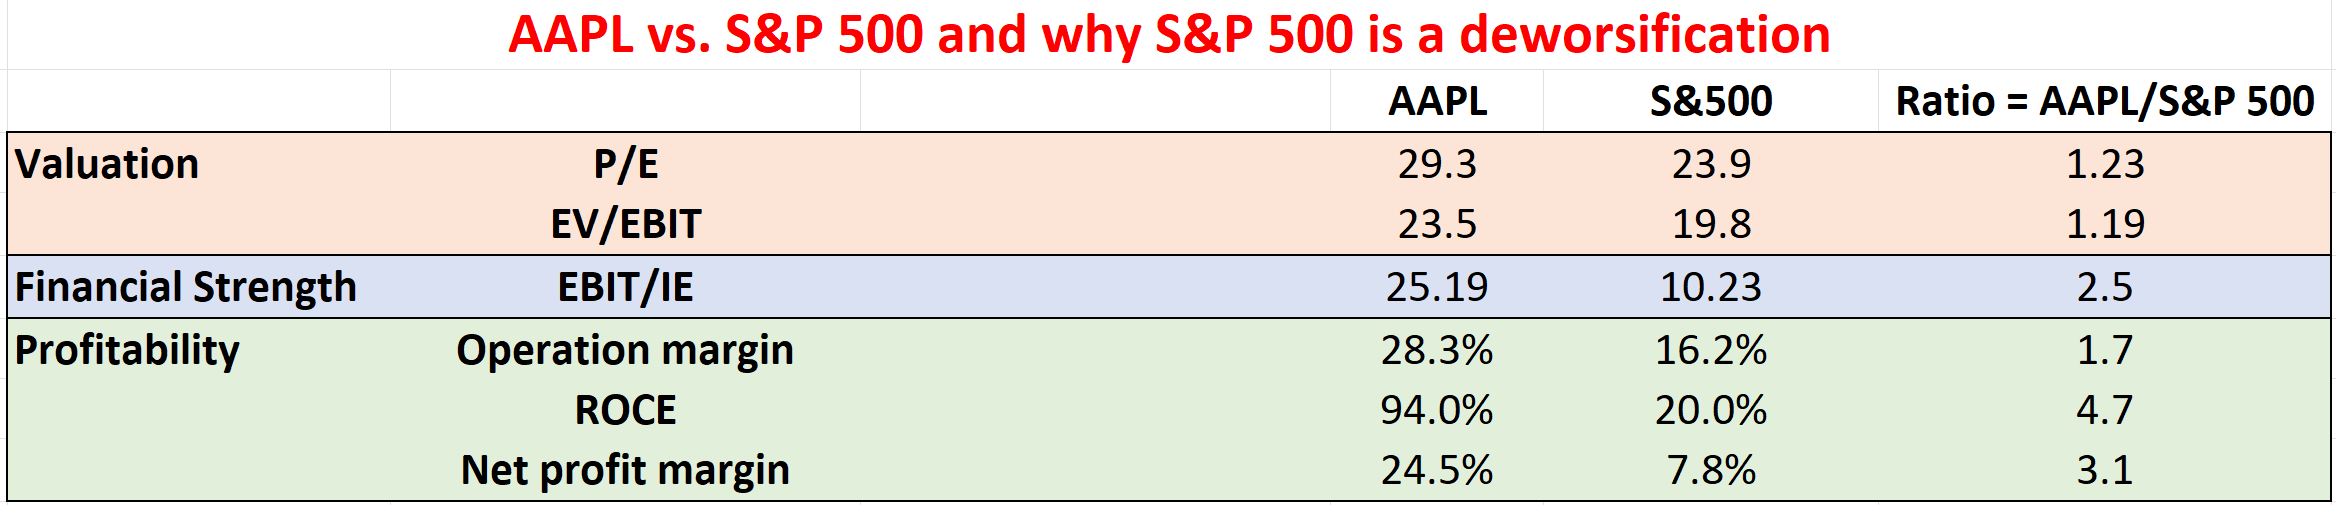
The picture for BRK is similar as shown in the second chart below. Due to its unique capital structure and insurance business, EV/EBIT and EBIT/IE ratios do not apply here. But overall, my takeaway is that BRK also offers superior quality compared to the overall market at roughly half of the P/E multiple. Note there is a bit of confusion regarding BRK’s P/E ratio among some investors. Most websites quote a P/E ratio of ~20x for BRK (e.g., Yahoo and Seeking Alpha).
However, this is a completely incorrect multiple in my view. My approach to compute its P/E is: A) first take the worth of its equity portfolio and cash position out of its market cap (or stock price if you do it on a per-share basis), and B) then dividend the answer from A by its operating income. Of course, there will be some uncertainties in both steps depending on how you value the equity portfolio, how much of its cash is “cash” rather than insurance float, et al. But my estimate of its P/E is in the range of 10x to 12x from this approach.
Source: Author.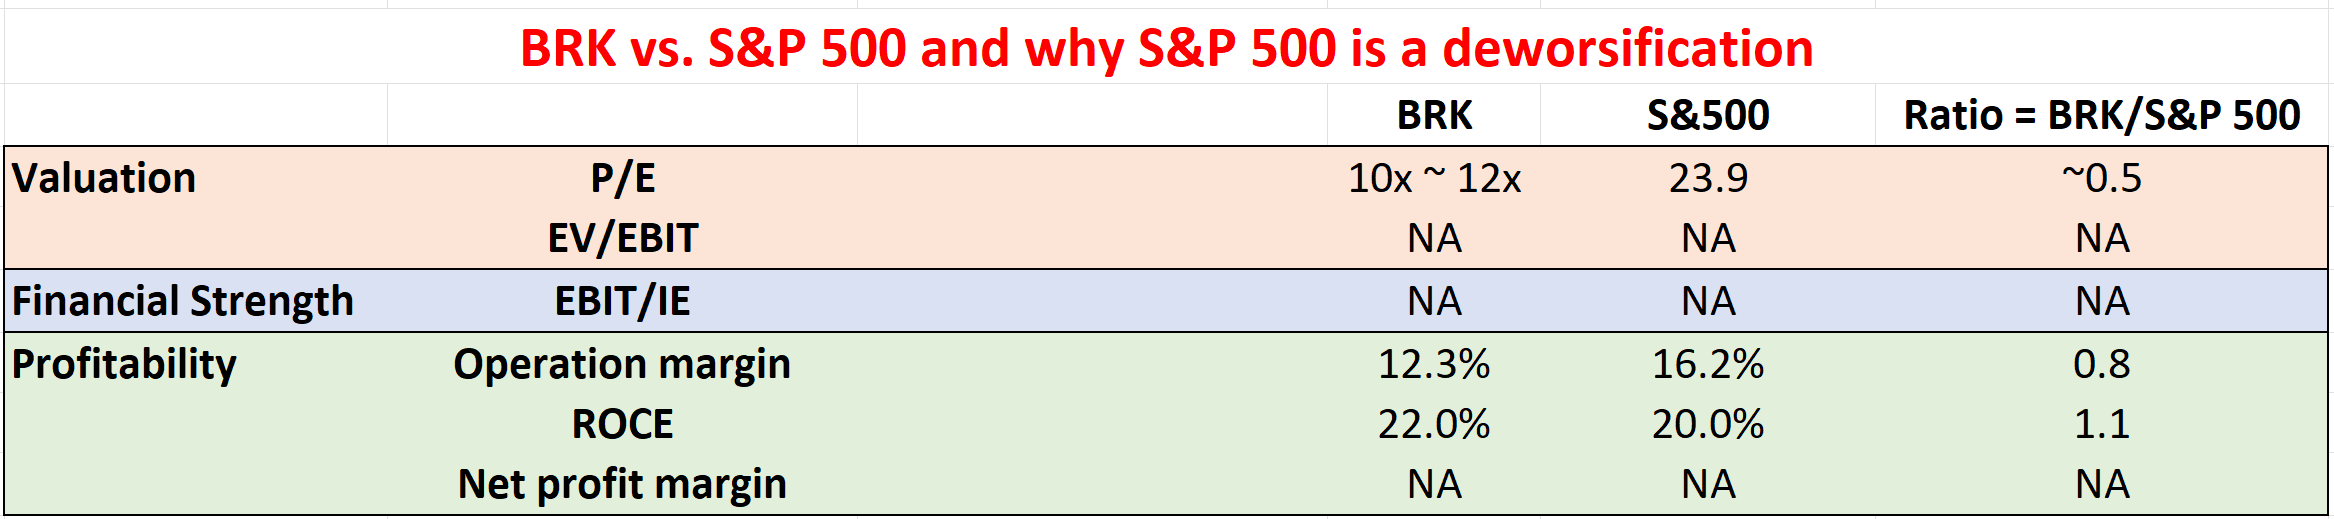
Basic math fact about compounding: 1+1>2
Putting aside valuation issues, most of us would agree that both AAPL and BRK are good compounders. So, I am not going to further add on. Here, I will focus on a simple math fact about compounding (or exponential growth): the benefits from double compounding are larger than the simple sum of the parts (aka 1+1>2).
Take the issue of stock repurchase as an example. Both companies are committed to stock repurchases (quietly aggressive in my view) are seen from the chart below. BRK and AAPL have nothing to do with each other, then a 1% buyback at BRK will benefit BRK shareholders by 1% (you now own 1% more of BRK). But if BRK owns a good chunk of AAPL and AAPL also buys back 1% of its shares, then as a BRK shareholder, your benefits are suddenly more than 2% (i.e., more than 1% + 1%). The simple math fact behind this is 101%*101% is larger than 102% by a tiny extra amount (by 0.01%).
But do not be under-impressed by this tiny extra amount because compounding works in a highly nonlinear way over time. And as BRK continues to add more AAPL shares (I wish), the “extra” amount will become amplified, as illustrated in the next table.
Source: Seeking Alpha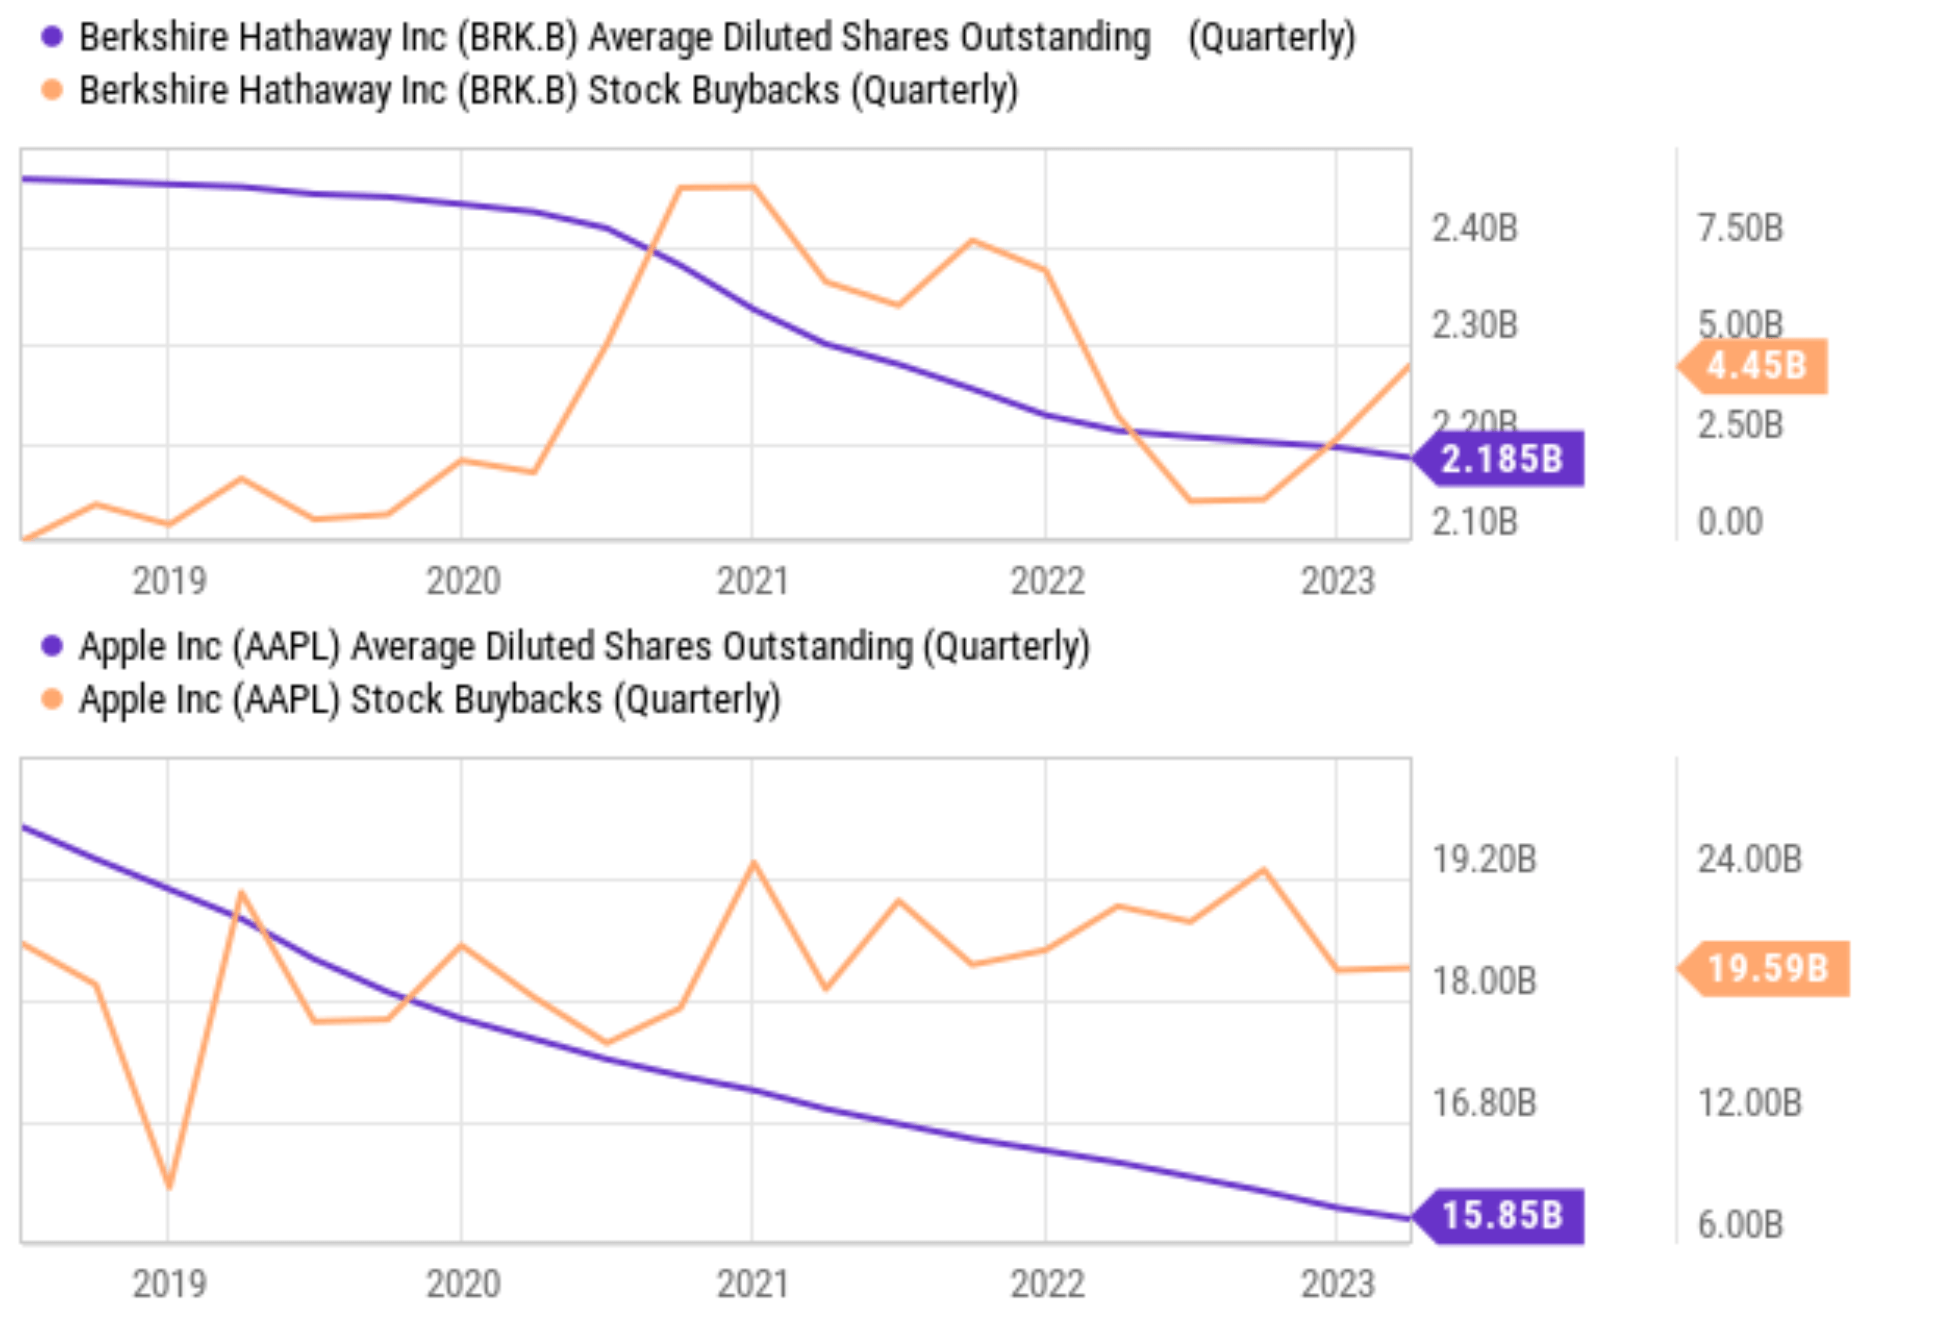
The table shows BRK’s projected ownership of AAPL’s owner’s earnings (“OE”) assuming the current pace of share repurchase continues at both places. The projection is based on a couple of key assumptions (listed below), which are of course all open to debate. However, tweaking these assumptions won’t change the essence of the math about the BRK-AAPL double-compounding itself.
- Assumption 1: Both BRK and AAPL will continue utilizing a consistent percentage of their operating cash flow for share repurchases. The assumed percentage is 78% for AAPL and 68% for BRK, which reflects the average observed in recent years.
- Assumption 2: AAPL’s OE is projected to grow at a compound annual growth rate (“CAGR”) of 7.4% according to consensus estimates.
- Assumption 3: The average repurchase will happen at a price of 25x OE for AAPL shares (about its current market valuation) and at a price of 8x operating cash flow plus book value for BRK (following the valuation method I mentioned above).
Under these assumptions, a few key observations from the projections to highlight the overpowered double-compounding:
- AAPL’s outstanding shares are expected to decrease by another 16.8% over the next 5 years. Simultaneously, BRK’s share count is projected to decline by an additional 11.6%.
- However, the fraction of AAPL shares owned in each BRK share would increase by 36%, more than the sum of 16.8% and 11.6%.
- At the same time, BRK’s ownership of AAPL’s OE would reach an astounding $11.6 billion in five years (the row highlighted in red), a 76.5% increase compared to BRK’s claim to AAPL’s earnings today. To put things under perspective, BRK’s average operating cash flow is “only” about $20B on average in recent years.
Source: Seeking Alpha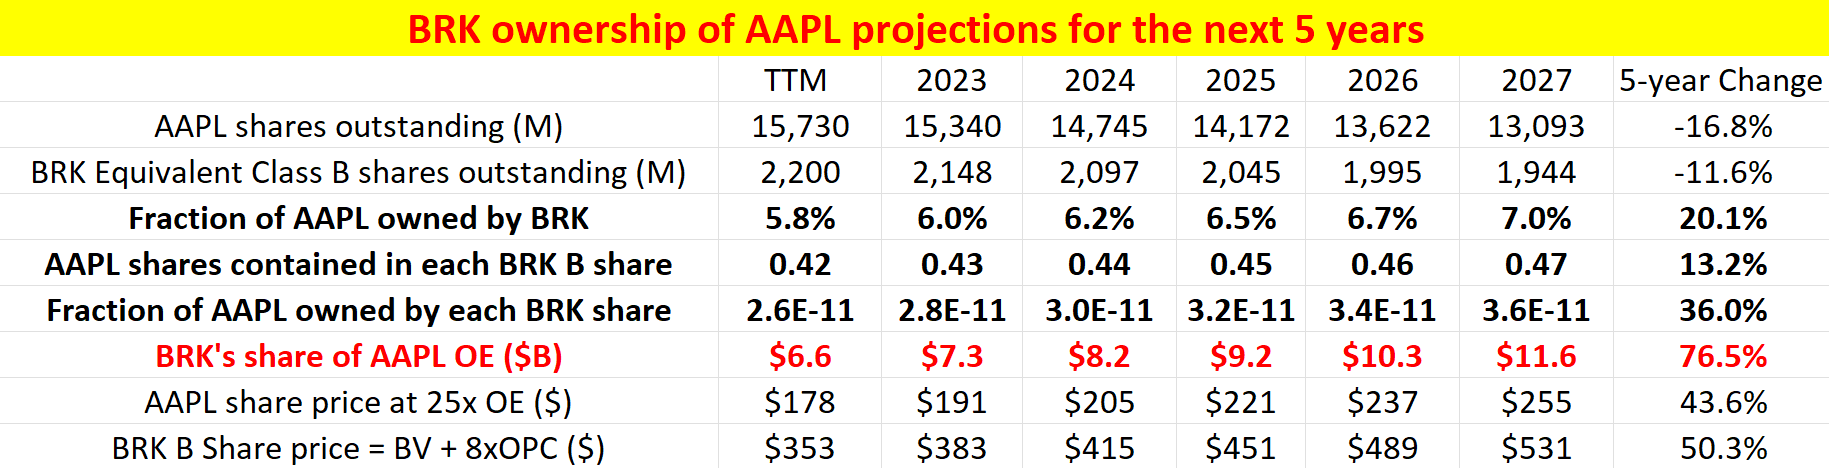
Risks and concluding thoughts
Here, I won’t discuss the general or specific risks associated with either BRK or AAPL. These risks are (have been) the topics of many other SA articles. in this article, I will focus on the risks specific to the core thesis: the concentrated exposure of BRK to AAPL. To reiterate, risk tolerance varies among individual investors. And undoubtedly, many investors (myself included) have AAPL exposure beyond traditional wisdom. Ray Dalio showed the chart below in his book Principles, suggesting that the benefits of diversification only begin to level off with about 12 stocks assuming that their correlation is low. Roughly speaking, this translates into a rule of thumb of limiting exposure to any one stock to about 8%. In AAPL’s case, the market indices mentioned above already exceed or approach 8%. And BRK’s exposure far exceeds this level. Depending on your risk tolerance and your specific holdings, there could be good reasons to de-Apple. Besides selling AAPL or BRK, other ideas include replacing some of QQQ or SPY with an Equal Weight ETF such as RSP.
However, for those who can tolerate the risk (like Li Lu or myself), there are good reasons to embrace such overexposure and hope for even more. As discussed in this article, there are good data to support the argument that the overall market is a deworsification compared to AAPL or BRK. And given the aggressive buybacks and growth projections, the benefits from the double-compounding are even more powerful than at either place separately.
Source: Ray Dalio’s Principles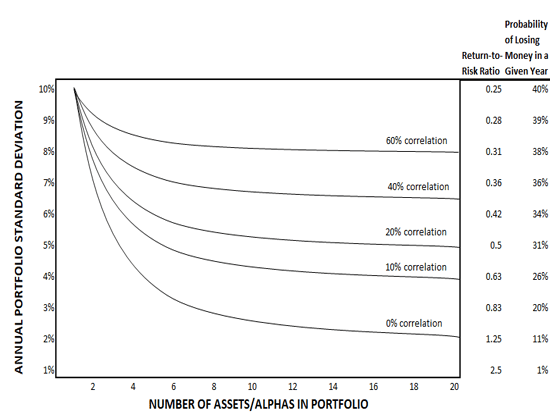
Analyst’s Disclosure: I/we have a beneficial long position in the shares of AAPL, BRK.B either through stock ownership, options, or other derivatives. I wrote this article myself, and it expresses my own opinions. I am not receiving compensation for it (other than from Seeking Alpha). I have no business relationship with any company whose stock is mentioned in this article.
Seeking Alpha’s Disclosure: Past performance is no guarantee of future results. No recommendation or advice is being given as to whether any investment is suitable for a particular investor. Any views or opinions expressed above may not reflect those of Seeking Alpha as a whole. Seeking Alpha is not a licensed securities dealer, broker or US investment adviser or investment bank. Our analysts are third party authors that include both professional investors and individual investors who may not be licensed or certified by any institute or regulatory body.
As you can tell, our core style is to provide actionable and unambiguous ideas from our independent research. If your share this investment style, check out Envision Early Retirement. It provides at least 1x in-depth articles per week on such ideas.
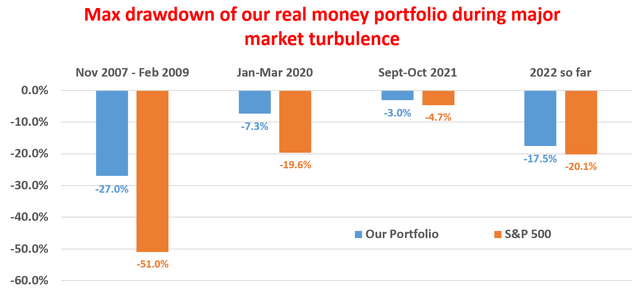
We have helped our members not only to beat S&P 500 but also avoid heavy drawdowns despite the extreme volatilities in BOTH the equity AND bond market.
Join for a 100% Risk-Free trial and see if our proven method can help you too.