Summary:
- Eli Lilly has been outperforming the S&P 500.
- The company’s blockbuster drug Mounjaro has been approved in China, resulting in high demand and a strong earnings report.
- The five-year target price for Eli Lilly has been raised to $1,455 based on conservative earnings projections and a multiple of 40X.

jetcityimage
I first wrote about Eli Lilly (NYSE:LLY) on Sept. 11, 2023, in an article titled “Eli Lilly Stock Hit New All-Time Highs: Is It Still a Buy?” At the time, the stock was trading at $595.56 per share and its blockbuster diabetes drug Mounjaro had not yet been approved for weight loss. Although it was almost certain that an approval was coming.
I put out a buy recommendation and a five-year price target of $1,020, which was 74% above where the stock was trading at that time. It also became the biggest holding at my advisory practice. The stock is now trading at $831.26 and is up 40.32% since that article. By contrast, the S&P 500 is up 17.74%.
The stock has delivered some alpha since then. Will it continue to deliver alpha?
Just under two months after I wrote my first article on Lilly, the company’s blockbuster drug Mounjaro (active ingredient tirzepatide) was approved for weight loss under the brand name Zepbound. This created demand for the drug to soar, and in fact, is creating a demand that’s hard to keep up with.
Since my first article on the stock, the company has announced two stellar earnings reports. This is what they looked like:

LLY Earnings Report
Not only did sales and earnings beat analysts’ consensus estimates, but they also showed acceleration in growth in both. Additionally, the stock has been rewarded with an expanding multiple (PE ratio). The stock has traded at a PE between 67 -125 over those two quarters.
This is well above its 5-10 year average multiple, but with a blockbuster drug like Zepbound, shareholders are going to be rewarded with a much higher multiple. When growth rates expand, multiples expand. From my perspective, both sales and earnings are just beginning to take off the runway.
I wrote a follow-up article on the stock on Feb. 8, 2024. It was titled: “Will Eli Lilly and Company Become a Trillion-Dollar Baby?”
The stock was trading at $735.68 at the time and it was continuing to hit new all-time highs. In that article, I raised my five-year target price to $1,318 per share from my previous target price of $1,020. This revision was based on higher earnings estimates, growth rate, and multiple expectations since the previous article. This target price would easily take Lilly to one-trillion in market cap, and beyond. It currently trades at a market cap of about $790 billion.
I also mentioned in my February article that Lilly was still the largest holding at my firm, with NVDA as the second largest, and that we still had a Buy rating.
Continue reading as I introduce my latest 5-year target price.
Why follow up on this fast-growing story?
The stock is breaking out to new all-time highs, its diabetes drug was approved in China, which leads the world in diabetic cases, the company just had another blowout earnings report, and we’re once again adjusting our five-year target price.
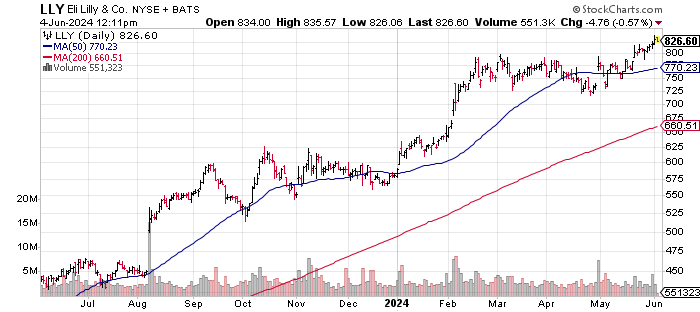
First, here’s a graphic of the stock hitting new, all-time highs.

StockCharts.com
“I don’t like to buy stocks hitting all-time highs, they are too expensive,” you say. That all depends on the valuation (target price) of the stock going forward. Most times, stocks hitting new highs have better upside potential than stocks hitting new lows. It all comes down to valuation, not price action.
Before we look at the current valuation, let’s first look at the stock’s past performance (momentum/alpha).

Best Stocks Now App
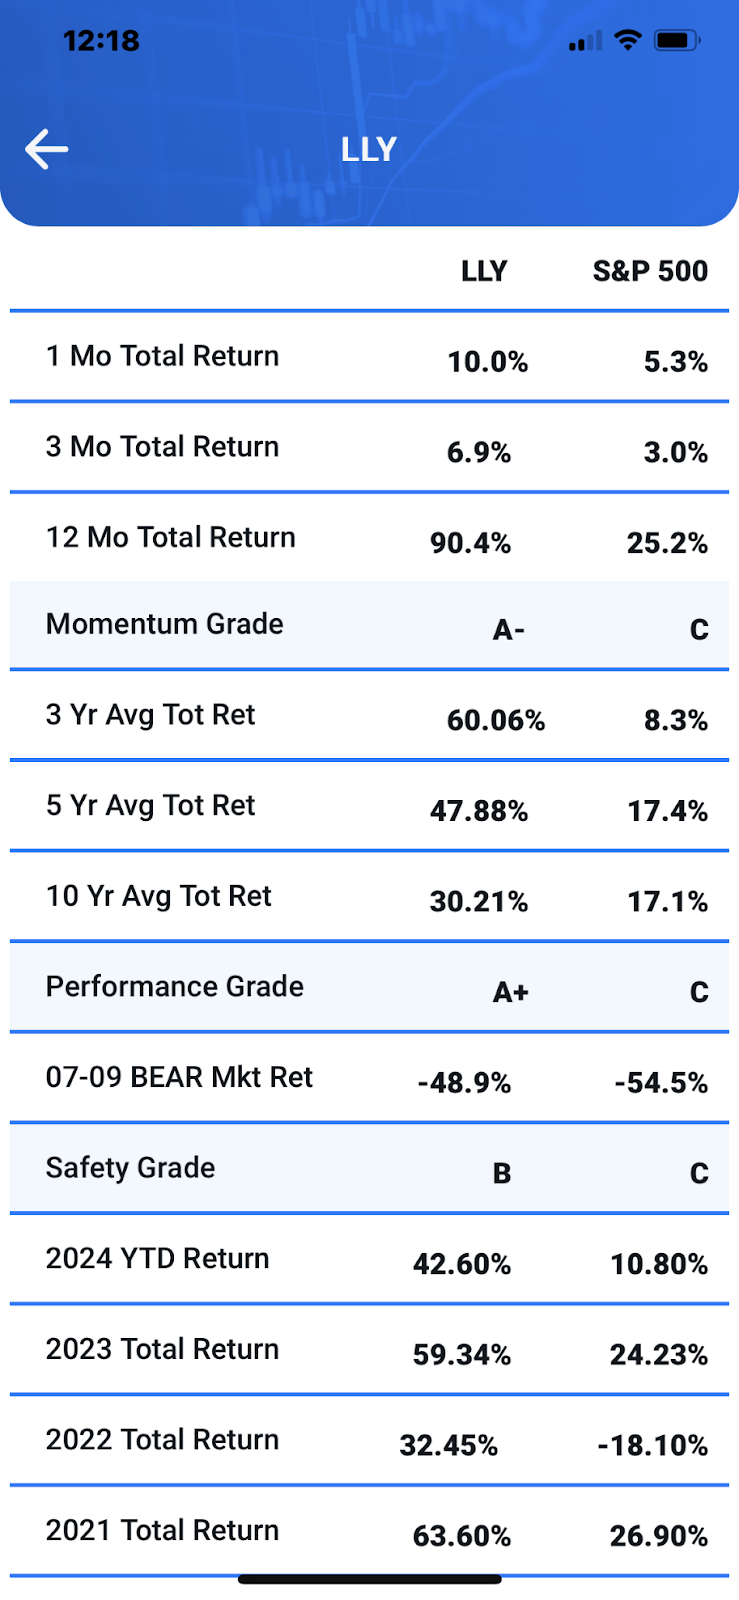
As you can see from the graphic above, the stock has clobbered the S&P 500 over the last one, three, five, and 10 years. It has also had four very good individual years in a row.
I’m certain you’re familiar with the saying: “Past performance is no guarantee of future performance.” However, performance is one half of the algorithms in my proprietary stock ranking formula. When compared against the 5,300 in my database, LLY earns a performance grade of A+.
For an indication of future performance, we look to valuations. I have been in the industry for 25 years, and in my early years as an analyst, I learned to do five-year valuations, as it was the most logical course of action. If we’re going to project five-year growth rates, then why not five-year price projections. Not only is this a logical approach, but it also takes the emotion out of owning stocks.

Best Stocks Now App
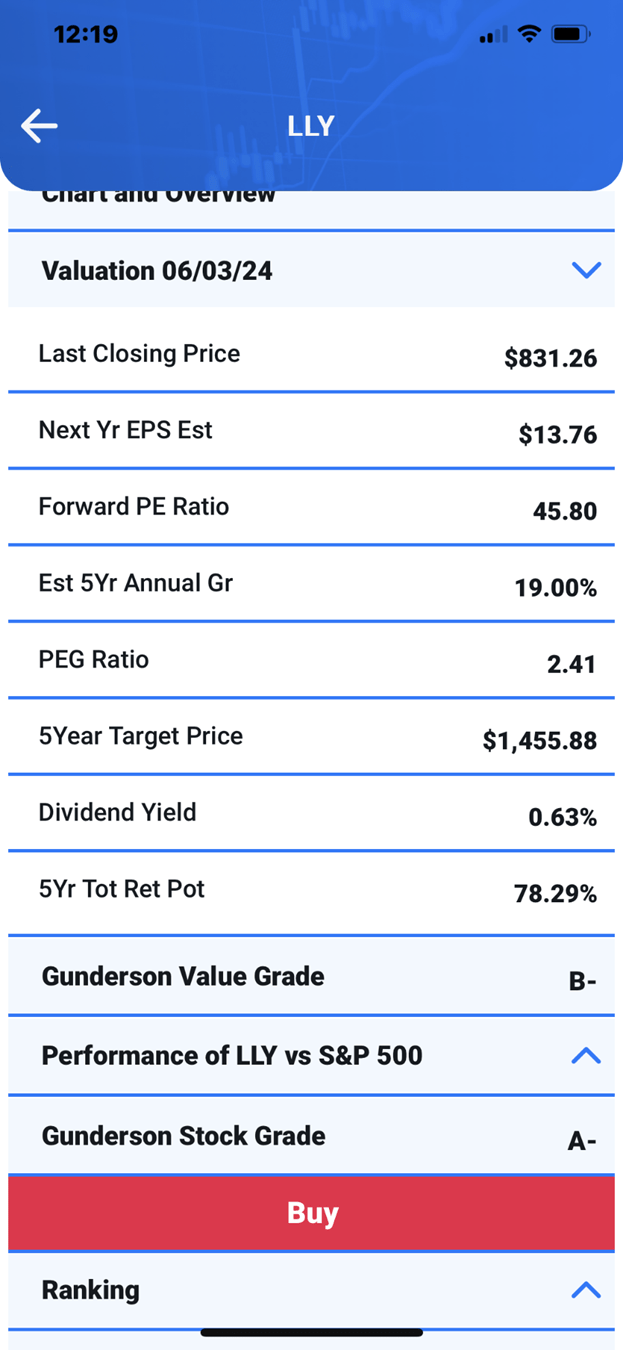
Based on $13.76 in earnings this year, $19.14 next year, and a projected five-year growth rate of 19% per year (this is very conservative), I am raising my five-year target price to $1,455. I’m using a multiple of 40X on future earnings (look at where the multiple is now). This gives the stock 78.3% upside potential. I required 75% or more. LLY still meets this criteria.
Valuation is the other half of my quant system. Other quant systems are momentum based only, but I choose to rely on both momentum and valuation to strengthen my strategic approach.
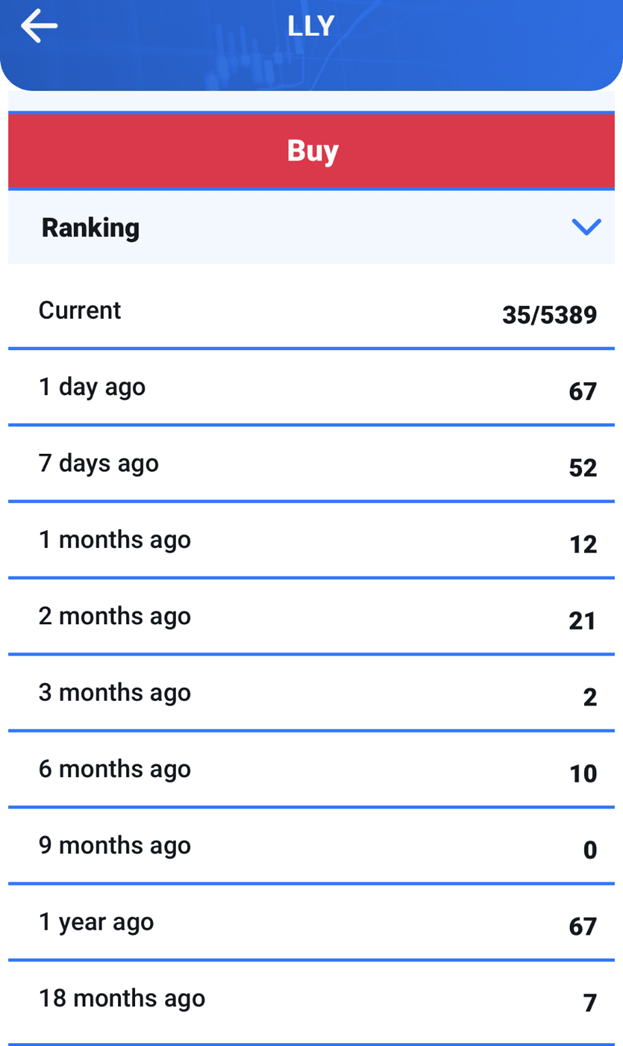
We still have a Buy rating on the stock, and it’s currently ranked at No. 35 out of 5,389. Ranking history below:

Best Stocks Now App
It’s important to note that adverse effects from the drug, competition with a better drug, or the overall economy may impact Lilly’s overall performance and stability in the market.
Lilly continues to be the largest overall holding at my firm. We also own Lilly’s main competitor, and I plan to discuss that in more detail soon. And as always, I’d encourage you to check out my previous articles in relation to the current performance of those holdings. I’m committed to everything possible to continue delivering alpha.
Analyst’s Disclosure: I/we have a beneficial long position in the shares of LLY, NVDA either through stock ownership, options, or other derivatives. I wrote this article myself, and it expresses my own opinions. I am not receiving compensation for it (other than from Seeking Alpha). I have no business relationship with any company whose stock is mentioned in this article.
Seeking Alpha’s Disclosure: Past performance is no guarantee of future results. No recommendation or advice is being given as to whether any investment is suitable for a particular investor. Any views or opinions expressed above may not reflect those of Seeking Alpha as a whole. Seeking Alpha is not a licensed securities dealer, broker or US investment adviser or investment bank. Our analysts are third party authors that include both professional investors and individual investors who may not be licensed or certified by any institute or regulatory body.
Best Stocks Now Premium gives you access to Bill Gunderson, professional money manager & analyst with 23 years of experience.
You get Bill’s daily “live” buys and sells in his four portfolios: Emerging Growth, Ultra-Growth, Premier Growth, and Dividend & Growth. These portfolios have done very well since their 1/1/2019 inception.
JOIN NOW to get daily “live” buys and sells, weekly in-depth market-timing newsletter, access to Bill’s proprietary database with daily rankings on over 5,000 securities, and a daily live radio show!
