Summary:
- NIO’s nearer-term technicals are bright as the chart, moving averages, and key indicators show bullish signals for its stock.
- The longer-term technicals are more mixed as the charts show that the stock remains in a downward channel despite recent strength.
- NIO’s financials are improving as the company returns to growth. In addition, the Chinese Government’s stimulus measures could boost its business.
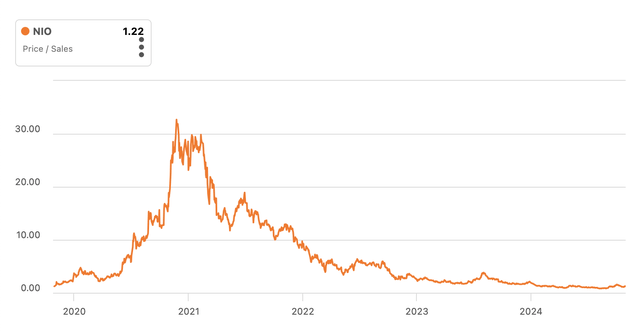
- The stock is undervalued as its P/S ratio sits at rock bottom levels despite a brightening outlook for NIO’s business.
- The stock is currently a buy for investors that have a high risk tolerance as the many bullish signals are met with a still uncertain long-term picture.
skynesher/E+ via Getty Images
Thesis
Down over 90% from its all-time highs, is NIO Inc. (NYSE:NIO) stock finally waking up? In the analysis below, I determine that the short term is getting increasingly bright for NIO, but the longer term still remains quite uncertain as the stock remains in a downtrend. An even longer term monthly analysis has not been provided as NIO only went public back in 2018. As for the fundamentals, NIO’s most recent earnings were quite resilient as growth returns to the business. Furthermore, the stock’s valuation is currently at rock bottom levels and I believe there is an opportunity for multiple expansion due to NIO’s improving financials and China’s economic recovery after the Central Government recently released stimulus measures. So back to the question. I believe NIO stock is showing some signs of finally snapping out of this downtrend and waking up, but the long-term technicals remain net negative. For conservative investors, this stock is definitely not a buy yet, but for risk-takers, this could be an opportunity to get in early. Therefore, I initiate NIO at a moderate buy rating.
Daily Analysis
Chart Analysis
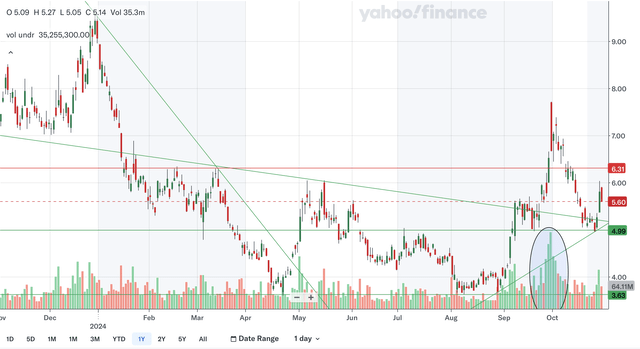
The daily chart is quite positive for NIO. Firstly, the stock broke out of a steep downtrend back in late April this year, which ended the strong downtrend. Then, in September, the nearer term less steep downtrend line was also broken, ending any short-term downtrend NIO is in. Instead, the stock is now in an early uptrend dating back to late August. The only area of resistance identified is at around 6.3 as that area was significant resistance early this year. As for support, the closest area would be the former downtrend line that is nearing 5.0. It could soon drop below the other areas of support, however. The next area of support would be the new uptrend line that has just passed 5.0. Even though this line has not been touched 3 times for confirmation, this could be an important line in the near future. We also have support at the psychologically important 5.0 level. This area was support in both September and October and was also resistance during the middle of the year, making it an important area. I have circled the volume during the recent surge amid China’s announcement of fiscal stimulus. The volume was by far the highest during the past year and could signal the stock is finally waking up. Lastly, a double bottom may have formed as the August trough held at around the same level as the April trough, forming another support area in the 3.6s. Overall, in my view, the daily chart for NIO is a positive one as the near-term downtrends have ended while the stock has close support underneath.
Moving Average Analysis
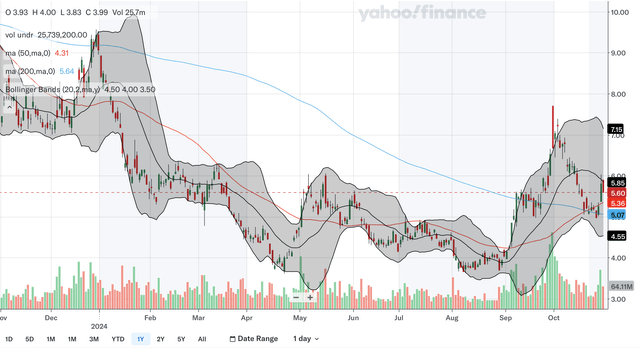
The 50-day SMA and the 200-day SMA had a golden cross just earlier this month, which is a highly bullish signal. The 50-day SMA has widened the gap considerably with the 200-day SMA since the crossover, showing that the bullish momentum has been relatively sustained. The stock currently trades above both of the moving averages with the 50-day SMA acting as support quite near the stock in the 5.3s. For the Bollinger Bands, after exploding through the upper band back in September, the stock has failed to bounce off the 20-day midline and instead, that line acted as resistance just now. This is a potentially worrying sign as the midline is supposed to act as support in an uptrend. As discussed above, NIO may be entering a nearer-term uptrend, but the Bollinger Bands signal here puts that uptrend into question. Overall, I would say the moving averages still reflect a net positive short-term picture for NIO, but the Bollinger Bands’ red flags show that investors should practice caution.
Indicator Analysis
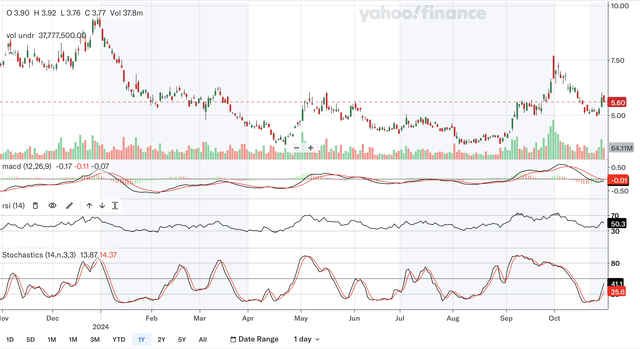
The MACD is currently below the signal line, but a bullish crossover seems to be imminent as the histogram looks bullish. As discussed in the chart analysis, a double bottom may have formed after the August trough held at the same level as the April trough. The MACD confirms this as it had a positive divergence since the MACD had a higher reading in August than it did in April. For the RSI, it is currently at 50.3, just reclaiming the critical 50 level, showing that the bulls may have regained control of the stock. The RSI also shows a bit of a positive divergence as it too recorded a higher level in August than it did in April. Lastly, for the stochastics, the %K recently crossed above the %D within the oversold 20 zone, a highly bullish signal. The %K is continuing to widen the gap with the %D, reflecting strong momentum. In my view, these daily indicators have been very positive for NIO as there is really not much to complain about here.
Takeaway
All three of the daily analyses show a positive short-term technical outlook for NIO. The chart shows that the stock has broken out of any near-term downtrends and that a double bottom may have formed. The moving averages just entered into a golden cross and the 50-day SMA is nearby support for the stock currently. Lastly, for the indicators, all three showed positive signals that the stock could be ready to advance.
Weekly Analysis
Chart Analysis
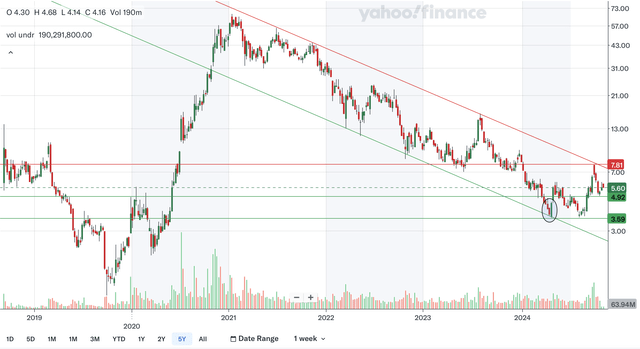
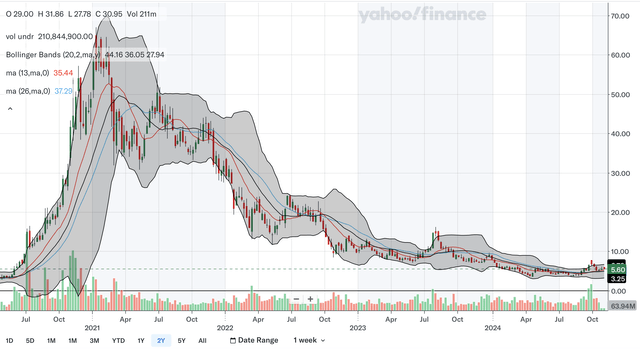
Note that the above chart is on a logarithmic scale to better show NIO’s longer-term trends. Despite the positive short term, NIO is still in a longer-term downtrend as it remains bound within a downward channel. This channel dates back to 2021 and the stock has bounced off the upper and lower channel lines multiple times in the past few years. In fact, the recent surge was halted right at the upper channel line, showing this channel is still highly intact. The nearest area of resistance would be the upper channel line that is currently nearing 7.0 and falling relatively fast. The stock could be weighed on by this line in the near future. The other resistance area identified is in the 7.8s as that area was also resistance recently and back in 2018 and was support in 2023. For support, the nearest area would be in the 4.9s. This is the same area identified in the daily analysis, but you can see here its significance dates back to 2020 as it was resistance back then. We also have support at around 3.6 which was also identified in the daily analysis, but as you can see here, that level was resistance in 2019 and support in early 2020. Lastly, the lower channel could be support, but it is miles down due to the log scale and is quickly sloping downward. I have circled a bullish engulfing pattern above, and it could potentially show the turning of the tide. From my analysis, the longer-term chart is still a net negative one for NIO as the stock being bound in this downward channel overshadows the positive signs here.
Moving Average Analysis
The longer-term moving averages are a bit more positive than the chart analysis. If you look very closely at the chart above, the 13-week SMA is above the 26-week SMA, which is a positive signal. It’s quite hard to see here, but there was a bullish crossover quite recently, and since then, the gap has widened, indicating resilient bullish momentum. The stock is currently trading relatively near the 13-week SMA. For the Bollinger Bands, the stock recently bounced off of the 20-week midline, which is a good sign. The recent rally on stimulus news also saw the stock break above the upper channel, and so a correction was to be expected as the stock was overbought. The correction holding above the midline could indicate that an uptrend may be brewing. Overall, the weekly moving averages and Bollinger Bands show positivity for the longer run as they refute the chart’s negativity.
Indicator Analysis
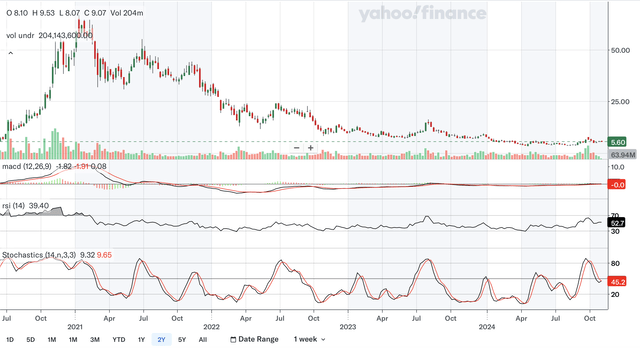
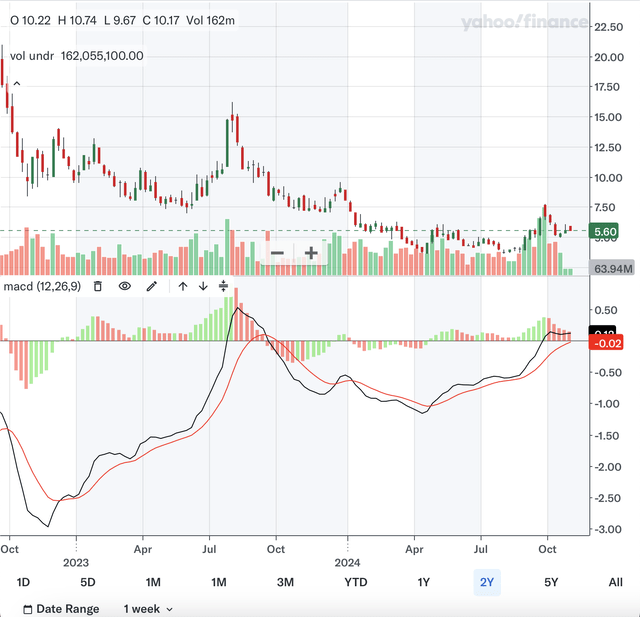
The MACD is hard to see in the above chart, so I have included a zoom-in of the MACD. The MACD crossed above the signal line earlier in the year which was a bullish signal. After the gap between the lines widened during the stimulus rally in late September, the gap has narrowed a bit as shown by the histogram and could signal a decrease in bullish momentum. The positive divergence, as discussed in the daily analysis, is also present here as the MACD has consistently climbed since the trough in April. For the RSI, it is currently at 52.7 and it’s holding above the all-important 50 level showing that the bulls have been resilient. The RSI also shows a positive divergence as it has also trended higher ever since the low in April. Lastly, for the stochastics, a bullish crossover is imminent as the %K regains its upward trajectory while the %D continues to fall. Although the crossover will not occur in the oversold 20 zone, it is a bullish signal nonetheless. In my view, these indicators are still net positive despite some signs of weakness as demonstrated by the MACD histogram.
Takeaway
The longer-term technical outlook is a mixed picture for NIO. The weekly charts show that NIO remains bound in a worrisome downward channel despite its recent strength. The moving averages are much more positive as there was a bullish crossover and the Bollinger Bands midline has acted as support. Lastly, the indicators were also mainly positive despite a decrease in bullish momentum along with the recent post-stimulus correction. If I had to make a decision, I would say the longer term is still net negative for NIO as the downward channel somewhat overshadows the other signals here.
Fundamentals & Valuation
Earnings
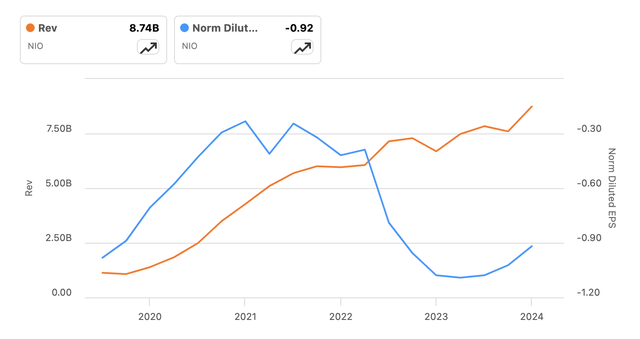
NIO most recently reported earnings in September for their 2024 Q2 and showed resilient results. They had a total of 57,373 vehicle deliveries in the quarter, up 143.9% from the year-ago period’s 23,520. In terms of financials, they reported total revenues of $2.4 billion, up 98.9% YoY while reporting an adjusted net loss of $624.1 million, narrowing the loss by 16.7% compared with the prior year period. The revenue figure above managed to beat expectations by $18.13 million, but the EPS of -$0.31 missed slightly by $0.01. As you can see in the chart above, it looks like things are back to trending in the right direction for NIO in terms of their financial results. Other highlights in their Q2 earnings include a vehicle margin of 12.2%, up from 6.2% YoY, and a gross margin of 9.7% versus the prior year period’s 1.0%.
Valuation
The most relevant ratio for NIO is the P/S ratio as the company has not been profitable. As you can see above, the ratio is at rock bottom levels compared to its history. After being over 30 in late 2020, the ratio has collapsed and is currently at only 1.22. Despite the company’s struggles in recent years, I believe this multiple contraction is an overreaction and the stock is quite cheap currently. As discussed above, the company’s financials have been resilient as of late and the trajectory of the results has been improving. In addition, even though there is heavy competition in the Chinese EV market, it is still one of the largest EV markets in the world. The EV revolution is nowhere near complete and with the recent stimulus measures, consumer confidence may soon recover in China and potentially boost NIO’s growth prospects. A P/S of 1.22 by itself is a very low figure. When considering that its financials are back in the right direction and that the re-acceleration of the Chinese economy can boost its business, I believe it is clear that NIO is currently undervalued. Seeking Alpha currently has a B valuation rating for its stock, confirming my evaluation.
Conclusion
Uncertainties remain for NIO as there are still longer-term bearish signals, but investors with high-risk tolerance should definitely consider adding NIO to their portfolios for an opportunity to get in early. The nearer-term technicals are quite bright as the chart, moving averages, and indicators are bullish for the stock. However, in the longer term, the stock remains in a downtrend despite positive signals from moving averages and key indicators. As for the fundamentals, the stock is dirt cheap as its P/S ratio has collapsed in recent years. With the business returning to growth and China’s economy getting brighter, I believe the stock is undervalued relative to its potential. Since the longer-term technicals still reflect uncertainty for the stock, I believe NIO is a buy for major risk-takers who want to maximize their potential reward.
Editor’s Note: This article discusses one or more securities that do not trade on a major U.S. exchange. Please be aware of the risks associated with these stocks.
Analyst’s Disclosure: I/we have no stock, option or similar derivative position in any of the companies mentioned, and no plans to initiate any such positions within the next 72 hours. I wrote this article myself, and it expresses my own opinions. I am not receiving compensation for it (other than from Seeking Alpha). I have no business relationship with any company whose stock is mentioned in this article.
Seeking Alpha’s Disclosure: Past performance is no guarantee of future results. No recommendation or advice is being given as to whether any investment is suitable for a particular investor. Any views or opinions expressed above may not reflect those of Seeking Alpha as a whole. Seeking Alpha is not a licensed securities dealer, broker or US investment adviser or investment bank. Our analysts are third party authors that include both professional investors and individual investors who may not be licensed or certified by any institute or regulatory body.

