Summary:
- PayPal stock remains a buy, with significant gains achieved from previous recommendations, but faces potential short-term resistance and risks.
- The financial sector’s growth contrasts with rising household debt and declining savings, raising concerns about consumption sustainability.
- PYPL is recovering from a downtrend, aiming for a long-term uptrend, but caution is needed as it encounters critical resistance levels.
- Investors should follow a contingency plan, taking profits or setting stop losses, and wait for potential retracement before adding new positions.

imaginima
PayPal Holdings, Inc. (NASDAQ:PYPL) has been on my buy ratings list since I wrote the first article on the company in November 2023. Investors who followed my last assumption of an adequate entry point could achieve significant performance, at low risk. However, the outlook for PYPL may shift, potentially introducing new risks. Nevertheless, a thorough analysis and a well-crafted contingency plan can equip investors to navigate even the most challenging situations. This article will explore potential short-term and longer-term opportunities and threats while providing a detailed analysis to complete the investment case.
A Macro Perspective
The positive momentum in the financial sector has led to a protracted expansion over the past year, only second to the technology sector, which has primarily outperformed all other groups. Insurers in property and casualty have led the rally, followed by asset management companies and diversified banks. In contrast, shell companies and actors in mortgage financial services are the only two losers over the past year, the latter industry losing a massive 32% of its valuation. Insurance companies, financial data providers, and stock exchange operators have recently shown relative strength. In contrast, shell companies and actors in mortgage financial services continue to lag, the latter losing 8% in the current week and 15% over the past month. Financial conglomerates and banking institutions have also shown some signs of weakness. Typically, those companies are susceptible to interest rate changes and become more relevant to the extremes of a stock market cycle.
With the US consumer having boosted its consumption pace through significant debt accumulation, the debt carried forward has reached new record levels. Credit card balances have risen to $1.1T, with an increase of $27 billion in Q2 2024, marking a 5.8% rise compared to last year. Auto loan balances grew by $10B, reaching $1.63T. Mortgage balances grew by $77B, reaching $12.52T by the end of June. In total, household debt increased to $17.80T in the second quarter, with an overall delinquency rate unchanged from the previous quarter, with 3.2% of outstanding debt currently in some stage of delinquency. The personal savings rate continued to drop, standing at 3.4% by the end of Q2, at levels seen during the financial crisis of 2008, raising questions about the consumer’s economic health and the sustainability of the consumption pace.

finviz

finviz
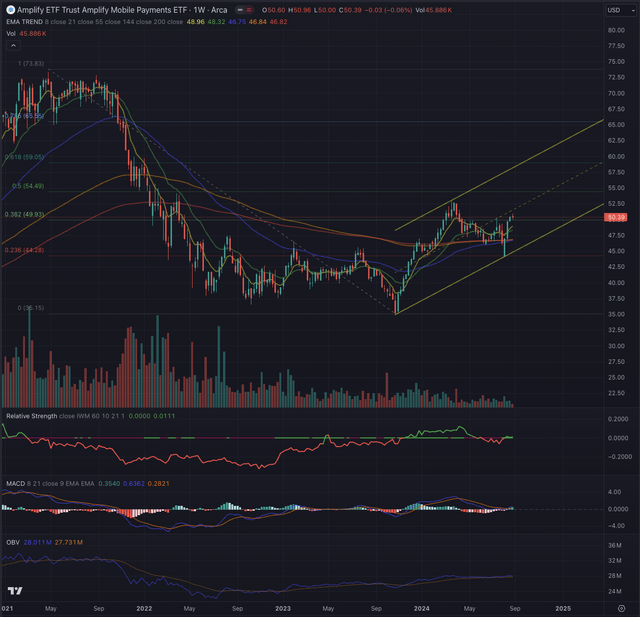
The Amplify Mobile Payments ETF (IPAY) has continued recovering after bottoming in October 2023, breaking above its 200-day Exponential Moving Average [EMA] while confirming this breakout and forming an uptrend channel. The industry benchmark isn’t showing strong momentum. Still, it seems to be set for a moderate positive performance as observed in the relative strength when compared to the broader equity market, represented by the iShares Russell 2000 ETF (IWM), the positively crossing Moving Average Convergence Divergence [MACD], and consistent buying pressure, as indicated by the uptrending On Balance Volume [OBV] indicator.

Author, using TradingView
IPAY is in a long-term uptrend, and until its price isn’t breaking down from the trending channel, it is expected to set higher lows and higher highs, with a first target seen at $54.50 and successively towards $59 if the momentum can keep up.
Where are we now?
In my last article on PayPal, published on February 27, 2024, I rated the stock as a buy position and defined the overhead targets through important price ranges.
“PYPL left two massive gaps between $60.65 and $62.85 and between $68.24 and $72.48. These gaps are in confluence with targets identified based on liquidity pools left in the Fair Value Gaps [FVG]”
I suggested that if PYPL maintained the achieved important levels, the stock could finally break out from its EMA55, which has been a strong trailing resistance and hasn’t been consistently overcome since April 2020.
“In my base scenario, PYPL is on its way to establishing a new uptrend. Here, the lower high around $55.85, and more importantly, the area below $54.78, should be maintained for this assumption to be confirmed. In this scenario, I consider the discussed price ranges as my targets and would see PYPL breaking out from its EMA200 on the daily chart and EMA55 on its weekly chart, setting a significant milestone for further upside potential.”

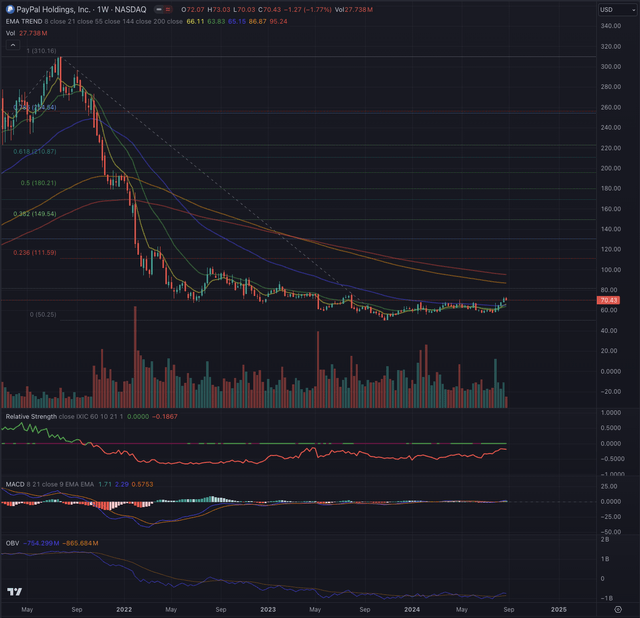
Author, using TradingView
Shortly after, the stock surged to a new high, filling the first gap and partially covering the second. Within two legs down, PYPL has then defined a higher low while maintaining the critical support levels. This was a perfect entry point for investors closely following the price action, with solid support and building positive momentum. The stock has finally reached my second target, filling the second-mentioned gap and confirming the uptrend channel for the third time while establishing a new high at $73.25.
PYPL is still underperforming the broader technology market, the Nasdaq Composite (IXIC), or, more narrowly, the Nasdaq-100 tracked by the Invesco QQQ ETF (QQQ), and buying pressure is still sluggish, as observed in the flat OBV. However, as shown in its price action and the prolonged flat MACD, the stock has bottomed. It is overcoming significant overhead resistance, a sign it could be set up for entering a new uptrend cycle.
Although these observations were made from PYPL’s weekly chart, it is essential to zoom in and verify them on the daily chart. This shorter time frame offers a clearer perspective on the structure of the recent rally, which can’t be observed in detail on the weekly chart. By studying the daily chart, I can better evaluate the stock’s dynamics and determine whether its current path is sustainable or if a corrective phase could be on the horizon.
What is coming next?
Investors who followed my assumptions and invested in PYPL had two significant opportunities to achieve a performance between 20% and 28% in the past six months. The actual situation is more tricky.

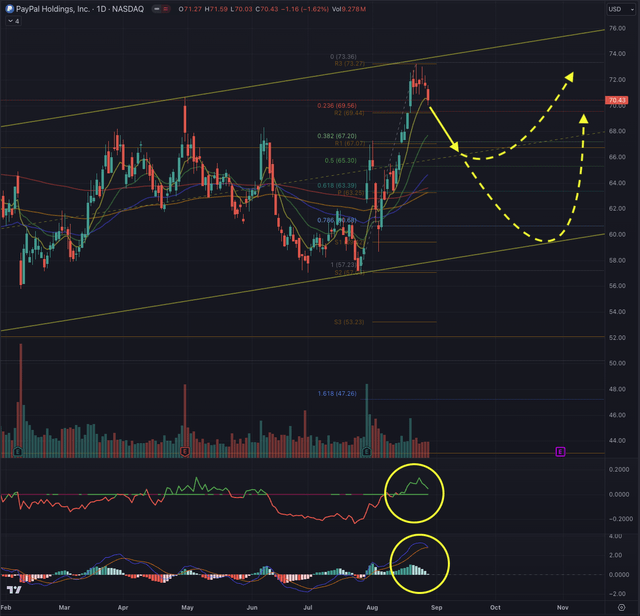
Author, using TradingView
On the daily chart, the stock is stalling at the upper limit of the trending channel, and at this point, chances are high it is poised to retrace from there. This assumption is supported by the reversing MACD and the inverting relative strength, signals I am closely considering in such situations as they show the stock’s strength relative to the broader technology market or the intrinsic momentum that could help overcome such a critical resistance level.
So, how do we trade such a situation? As a new investor interested in exposure to PYPL, I wait until the stock retraces to at least $66.76, filling a gap between $67.05 and $66.47 or between $65.30 and $63.40. If the stock reaches this range, due diligence is necessary to establish if the negative momentum is still too intense and if more downward pressure could be ahead. I would then look at the lower end of the trending channel, where a significant price imbalance hints at liquidity pools, as this is the ultimate chance for PYPL to confirm its ascension and a very lucrative entry point. Investors who aren’t proficient with the price action signals and the candlesticks could observe the MACD to confirm their entry point, as this indicator would invert when the uptrend is on its way again. As a first target in an upward movement, I would consider the range between $76 and $77, while further upside potential in case of a breakout of the uptrending channel, is quantified within $83 and $84.
As a shareholder interested in the long term, I want to protect my profits. Nothing is set in stone in the markets, and proper risk management is paramount to stay consistently profitable in the long run. Investors who entered around my previous entry signal have a comfortable profit cushion and could take some profits off the table or set a stop loss below $63 or further down at break even. I would wait until the mentioned levels are reached to load up on new positions. At the same time, it’s imperative to avoid a bull trap at this point, as if the technology market is set for a major downturn, PYPL would likely follow and break under critical support levels.
All elements considered, PYPL is in a medium-term uptrend, trying to emerge from its long-term downtrend, with massive potential on the upside if it succeeds in its intent. My observations lead me to maintain PYPL’s buy rating under the discussed assumption and categorically follow my contingency plan.
The bottom line
Technical analysis is a crucial tool for investors, increasing their chances of success by helping them navigate the complexities of listed securities. Like consulting a map or using a GPS on an unfamiliar journey, incorporating technical analysis into investment decisions offers a strategic guide. I utilize techniques rooted in Elliott Wave Theory and apply Fibonacci principles to assess potential outcomes based on probabilities. This approach helps validate or challenge potential entry points, considering factors such as sector performance, industry trends, and price action. My goal in using technical analysis is to thoroughly evaluate an asset’s condition and derive likely outcomes informed by these methodologies.
The financial sector has experienced strong growth over the past year; however, as household debt reaches record levels and consumer savings decline, concerns arise about the sustainability of current consumption trends.
PYPL has shown potential within this landscape, particularly as it recovers from its downtrend and seeks to establish a new long-term uptrend. While recent gains present opportunities, caution is advised as the stock faces critical resistance. While I continue to rank PYPL as a buy position, investors should remain vigilant and strictly execute their contingency plan.
Analyst’s Disclosure: I/we have no stock, option or similar derivative position in any of the companies mentioned, and no plans to initiate any such positions within the next 72 hours. I wrote this article myself, and it expresses my own opinions. I am not receiving compensation for it (other than from Seeking Alpha). I have no business relationship with any company whose stock is mentioned in this article.
All of my articles are a matter of opinion and must be treated as such. All opinions and estimates reflect my best judgment on selected aspects of a potential investment in securities of the mentioned company or underlying, as of the publication date. Any opinions or estimates are subject to change without notice, and I am under no circumstance obliged to update or correct any information presented in my analyses. I am not acting in an investment adviser capacity, and this article is not financial advice. This article contains independent commentary to be used for informational and educational purposes only. I invite every investor to do their research and due diligence before making an independent investment decision based on their particular investment objectives, financial situation, and risk tolerance. I take no responsibility for your investment decisions but wish you great success.
Seeking Alpha’s Disclosure: Past performance is no guarantee of future results. No recommendation or advice is being given as to whether any investment is suitable for a particular investor. Any views or opinions expressed above may not reflect those of Seeking Alpha as a whole. Seeking Alpha is not a licensed securities dealer, broker or US investment adviser or investment bank. Our analysts are third party authors that include both professional investors and individual investors who may not be licensed or certified by any institute or regulatory body.
