Summary:
- Texas Instruments Incorporated held an off-cycle capital management update this week, providing some new data points for investors.
- Capex for 2026 is now flexible and will adjust according to the demand environment.
- Management provided some revenue and cash flow scenarios, which I used to judge whether the stock is a buy today.
Monty Rakusen
Introduction
Texas Instruments Incorporated (NASDAQ:TXN) (“TI”) held an off-cycle capital management update yesterday. My impression is that not much has changed concerning the last capital management update the company held in February, but there was some interesting new information. The first thing management shared was a snapshot of the present and future of the industry. It’s no secret that the industry is currently going through a downcycle, but it was interesting to hear that units shipped are presently not only significantly below the 2022 peak but also below 2019 levels:
Texas Instruments Presentation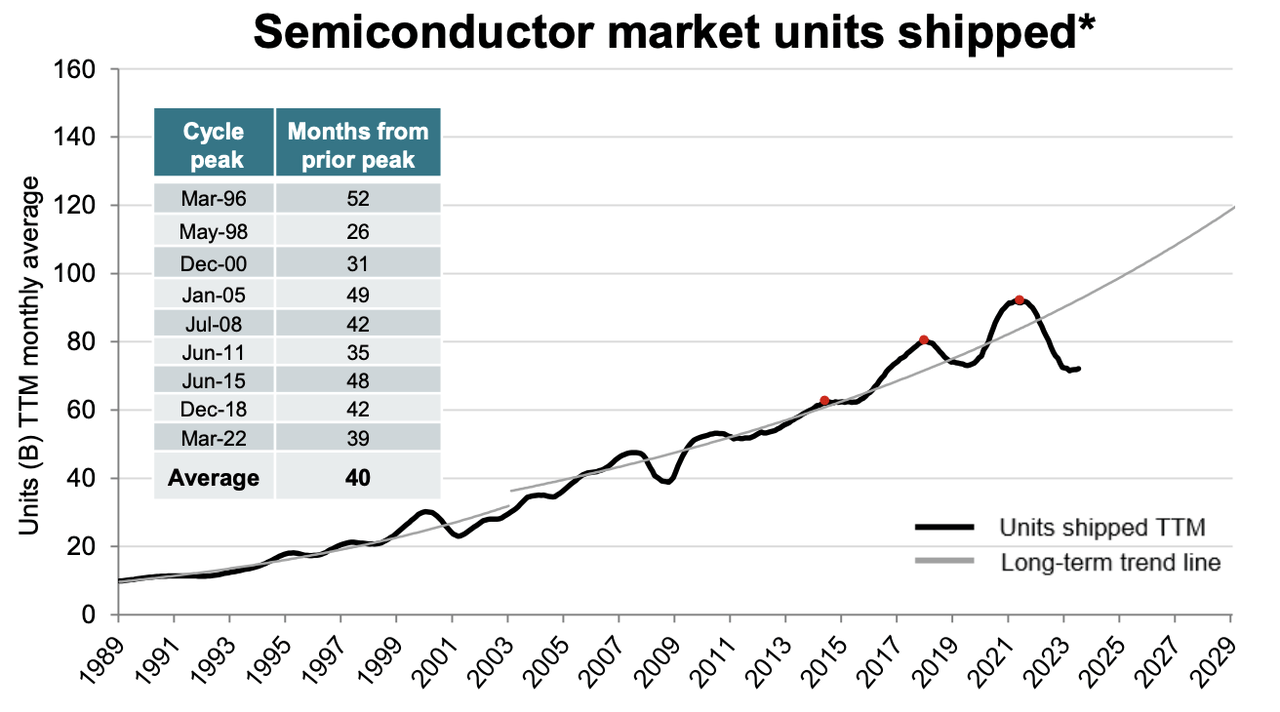
Management then shared something that we already knew: they expect industrial and automotive to continue their strong growth going forward, which is why they have over-exposed the company to those areas:
Texas Instruments Presentation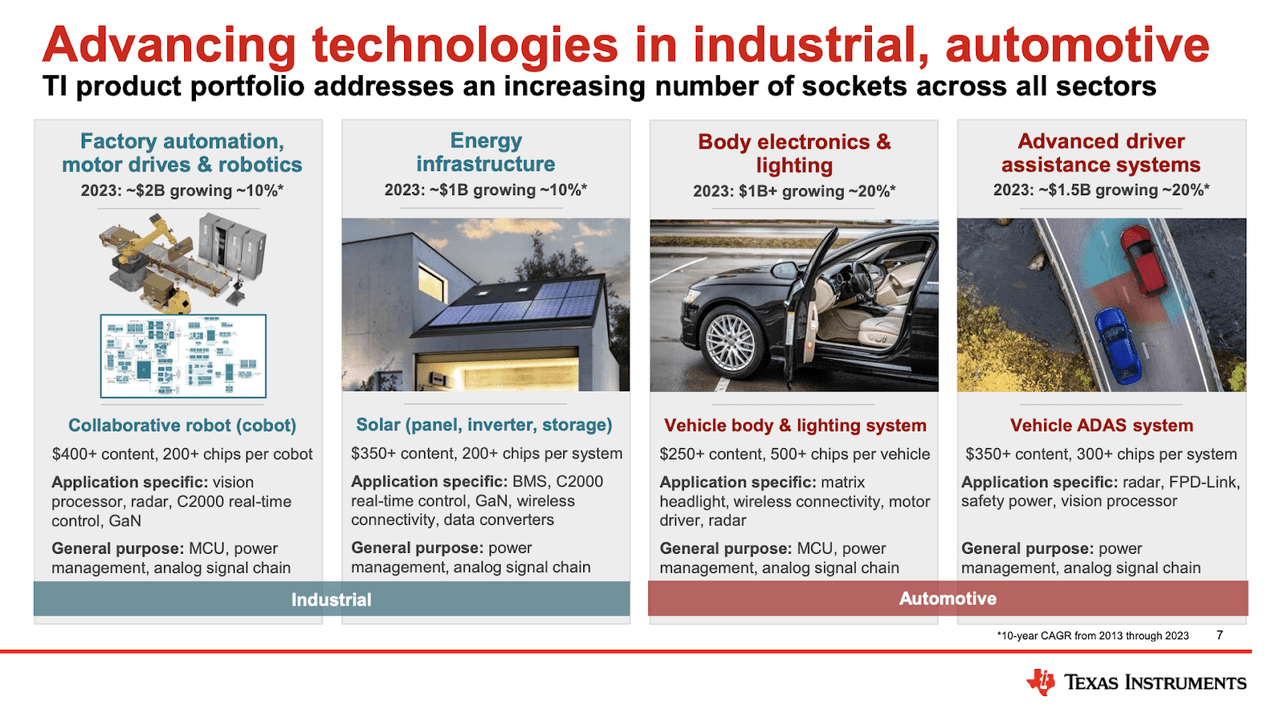
What changed?
There were two main changes concerning the company’s last capital management update (held in February):
-
Capex for 2026 is now flexible, and key metrics are expected to “outperform.”
-
Management shared different revenue and free cash flow per share scenarios.
Let’s start with #1, which is pretty straightforward. During February’s capital management update, management shared that Capex would average $5 billion per year until 2026 (included):
Texas Instruments Presentation (February)
The landscape remains relatively similar, but 2026 is no longer a “fixed-capex” year. TI now expects Capex in 2026 to be somewhere between $2 billion and $5 billion, depending on the circumstances.
Texas Instruments Presentation
This shouldn’t have surprised investors, as they had hinted at it previously but had not translated it into a chart. Many attribute this change to the arrival of Elliott, the activist investor. Management, however, noted that it’s simply an update based on having more visibility into 2026 today than when they laid the plan out. The truth is probably somewhere in between.
Note, though, that the above shows gross capital expenditures. While these might appear very significant, we must remember that the company will receive somewhere between $7 and $9 billion in Government aid (investment tax credits and direct grants) to conduct this capacity expansion plan.
We also got a more detailed calendar for the capacity expansion plan:
Texas Instruments presentation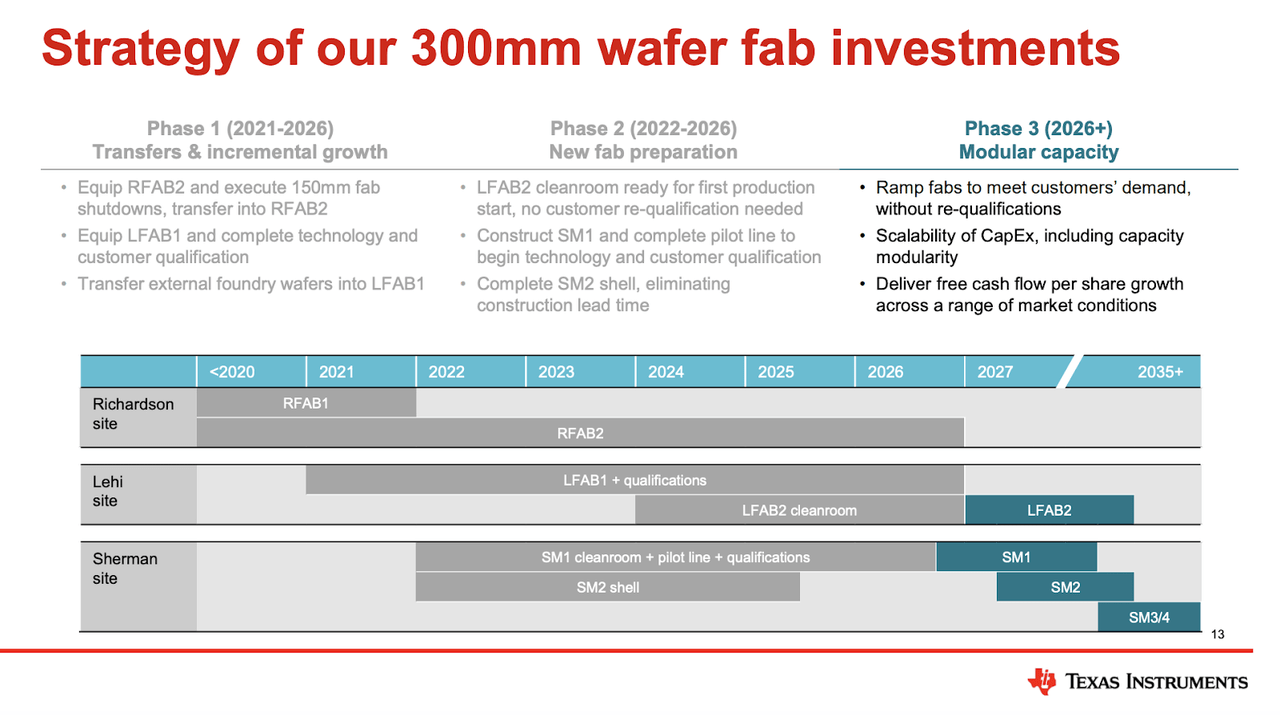
The one thing I’d highlight from the above is that Phase 3 is pretty flexible because the foundations (i.e., the costliest and most time-consuming tasks) of LFAB2, SM1, and SM2 will be laid in Phase II. This means the company will be in a pretty good position to service post-2027 demand without having a bloated cost structure if this demand doesn’t materialize. Management even noted that from 2027 onwards, Capex could go as low as maintenance Capex if the conditions warrant it. This is obviously good because Free Cash Flow should be less volatile than what we’ve experienced lately.
Management also mentioned that capacity additions have become more efficient and productive due to improved throughput levels (this is good commentary on ASML). This translates into lower Capex than previously anticipated and outperforming its prior key metrics expectations. Management mentioned in February that they expected to achieve the following by 2026:
Texas Instruments February Capital Management Update
Now, management expects further improvements across the % of internally manufactured and assembled wafers and wafers manufactured in 300mm:
Texas Instruments presentation
Again, this is good news because vertical integration and 300mm wafers benefit the company’s performance, even though these benefits are not evident (or even act as headwinds) during downturns.
The second thing that changed concerning the capital management update held in February is that management changed its “revenue supported metric” for outright revenue and free cash flow scenarios:
Texas Instruments presentation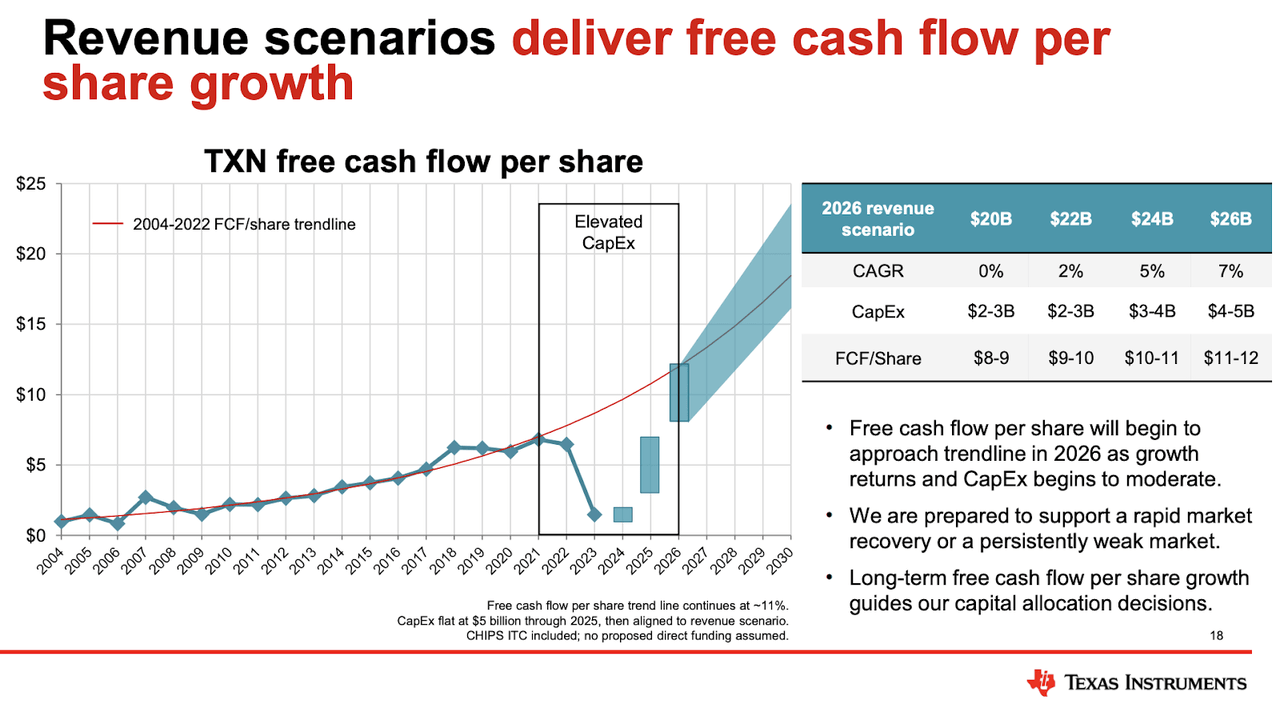
We can see four 2026 scenarios in the table above, from more “pessimistic” to more “optimistic.” I’ll focus on what management believes to be the “worst-case” scenario because it needs context. The CAGRs shown in the table above refer to the growth rate that would be achieved compared to the prior cycle peak (2022), so it’s not a CAGR calculated based on where the company is today. Management received some questions about this. Analysts believe TI will finish this year around $15.7 billion in revenue, meaning that $20 billion by 2026 corresponds to a 13% CAGR from current levels. Some analysts believe this to be a tad optimistic as a worst-case scenario, and while I might agree, it’s interesting to see that $20 billion is right around what analysts expect TI to generate in 2026…
FinChat
The number requires further context, though. Despite being in a downturn, we must not forget that there’s a secular trend underlying the analog industry. This means that subsequent peaks should be higher than former peaks. This has happened in the past. While it’s tough to envision it while touching the depths of a downturn that has brought units shipped below 2019 levels, I don’t think there’s a reason to believe this will change going forward. The “worst-case” scenario assumes one of two things…
-
2026 will not be a peak year
-
Assuming it’s a peak year, there will be no growth from peak to peak.
Given the industry’s secular nature, I’d say the most probable assumption is the first one. Management is making no efforts here to time the cycle; they simply have provided a range of revenue outcomes that translate into FCF/share scenarios (which they can control to a greater extent).
The other thing to consider (which management rightly pointed out) is that the 2022 peak might have been underestimated. Management argued that supply was so tight they had to give up business. This means that if they would’ve had ample supply, they would’ve sold more and therefore would’ve generated more revenue. This ultimately means that we might still be below a full recovery even if the company lands at $20 billion in revenue by 2026. Analysts, however, rightly pointed out an unusual pricing environment during the supply crunch, meaning that the pricing lever might have been overstated (something I agree with).
What’s probably more interesting about management’s expectations is that despite there being a 30% variation between the high and low-end revenue scenarios, the variability in free cash flow is expected to be around the same. This is not normal for a company perceived as capital-intensive with a fixed-cost operating model, but management attributes it to two things…
-
The Capex flexibility I discussed above
-
Cash flow margins going back to where historically they have been (worth remembering that TI has built significant inventory, which has penalized cash flow conversion).
Another essential thing to note is that the above FCF scenarios do not include any money related to direct grants. The company signed a preliminary agreement to receive $1.6 billion from the Government on Friday, but the terms of this agreement are not yet firm, leading management to exclude them. $1.6 billion is not peanuts, as it could potentially finance more than half of the expected Capex in the low-end scenario.
The different FCF scenarios translate to the current 2026 FCF multiples:
-
$20B revenue scenario: 24x
-
$22B revenue scenario: 21x
-
$24B revenue scenario: 19x
-
$26B revenue scenario: 18x.
The $20 billion revenue scenario does seem pessimistic, despite such a sharp recovery being inconceivable for many at the bottom of a cycle. This is something that typically happens in cyclical industries, and it’s why such companies tend to trade discounted during certain periods, but is Texas Instruments going through such a period?
The company has historically traded at a FCF multiple of 20x. Assuming this stays constant in 2026, we can expect the following stock price returns by 2026 (there’s a lot of assuming here…)
Made by Best Anchor Stocks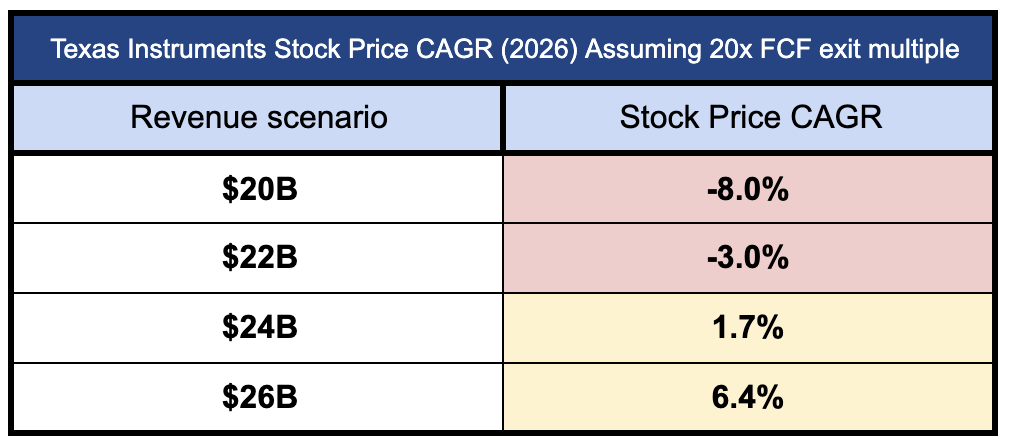
To this, we must add the current 2.6% dividend yield, which should land us in the following total return estimates…
Made by Best Anchor Stocks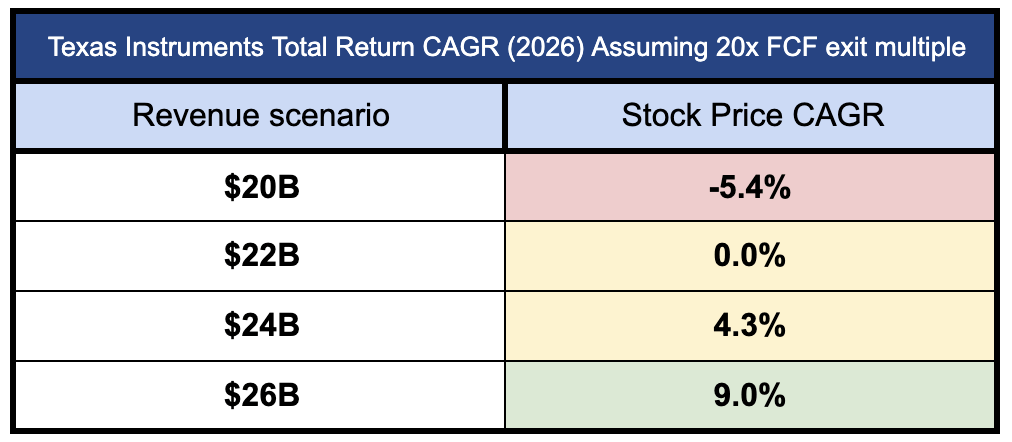
The “most optimistic scenario” does not get us to a double-digit return. However, we must remember that the company’s Free Cash Flow numbers exclude any direct grants from the Chips Act. Should the company receive, say, $1.5 billion in direct grants in 2026, this would translate into an additional $1.6 in Free Cash Flow per share, which would make the total return look as follows:
Made by Best Anchor Stocks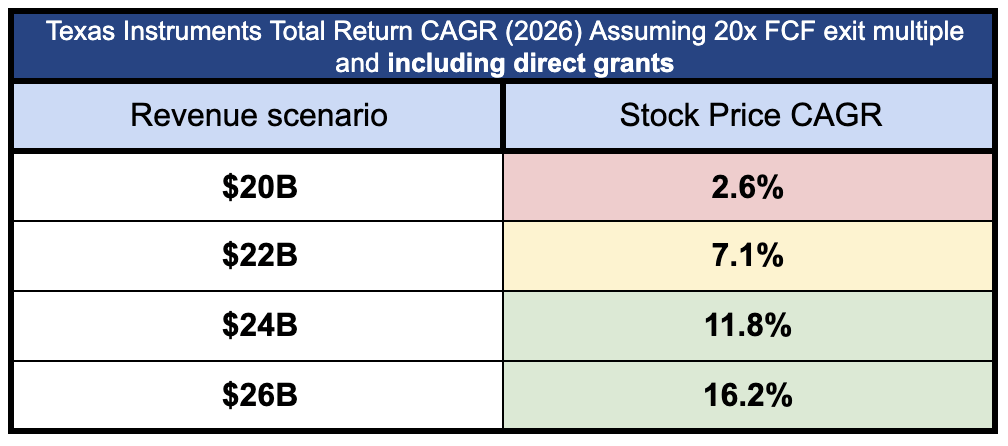
These numbers seem much more appealing, but the timing of such grants is also uncertain, so there’s no guarantee they would be included in the 2026 numbers. This should not be a game changer for investors looking more than 2 years ahead.
I don’t think the company is extremely expensive here, but I also don’t think it offers an outstanding risk-reward. As I shared on an article with subscribers, my buy point is around $160 (I used 2030 numbers in that exercise). If we use $160 to calculate potential returns, ignoring the direct grants, we get to the following return scenarios (I obviously used a higher dividend yield to account for the lower stock price):
Made by Best Anchor Stocks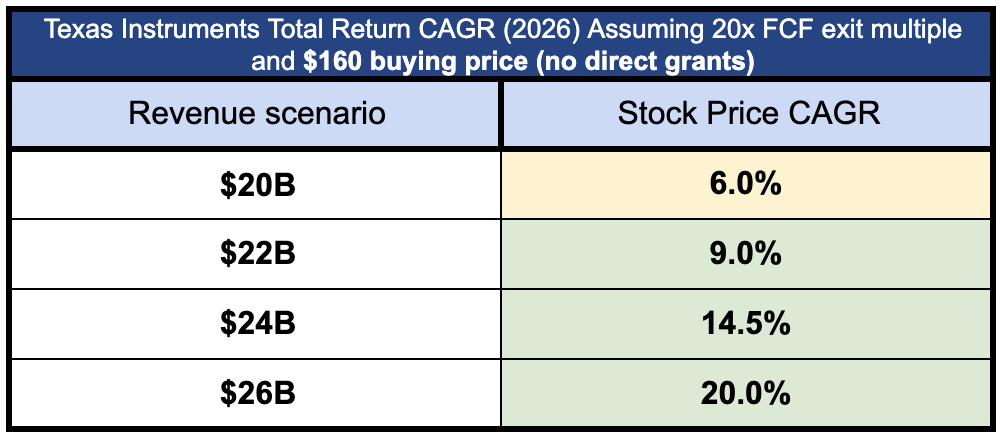
These seem much more appealing, and I would say that I might have been too pessimistic with my $160 estimate. The reason lies in the conservative assumptions I baked into my 2030 exercise, where I used a conservative revenue projections but coupled it with the high-end of capital intensity. Based on management’s comments during this capital markets update, this scenario is very unlikely to happen, as Capex can even go as low as maintenance Capex if revenue is not supportive.
I would consider adding to my Texas Instruments Incorporated position anywhere below $170. I believe this level provides attractive risk-adjusted returns going forward.
In the meantime, keep growing!
Analyst’s Disclosure: I/we have a beneficial long position in the shares of TXN either through stock ownership, options, or other derivatives. I wrote this article myself, and it expresses my own opinions. I am not receiving compensation for it. I have no business relationship with any company whose stock is mentioned in this article.
Seeking Alpha’s Disclosure: Past performance is no guarantee of future results. No recommendation or advice is being given as to whether any investment is suitable for a particular investor. Any views or opinions expressed above may not reflect those of Seeking Alpha as a whole. Seeking Alpha is not a licensed securities dealer, broker or US investment adviser or investment bank. Our analysts are third party authors that include both professional investors and individual investors who may not be licensed or certified by any institute or regulatory body.
Best Anchor Stocks helps you find the best quality stocks to outperform the market with the lowest volatility/growth ratio. We look for top-notch quality compounders, with solid growth and lower volatility than you would expect.
Best Anchor Stocks picks have a track record of revenue growth combined with below-average volatility. Since the inception in January 2022, our portfolio has beaten the market by a significant margin.
There’s a 2-week free trial, so don’t hesitate to join Best Anchor Stocks now!
