
Summary:
- Jim Simons is considered by most sources the greatest trader of all time, with 62% annual returns from 1988 to 2021, a 42,000X return after 49% fees.
- Recently, Simons backed up the truck on Amazon, increasing his position by 270%, buying almost $700 million worth, and he now owns $1 billion, making Amazon his second largest company.
- Amazon’s earnings show its hyper-growth empire built around AI-driven retail, cloud, advertising, and streaming is doing fine, adjusted for the current economy.
- AMZN remains 30% undervalued despite a 30% rally since October, is growing free cash flow at 45% annually, and has a PEG of 0.49, hyper-growth at a wonderful price.
- AMZN could triple in the next three years and almost 7X in the next six. The greatest trader in history is backing up the truck on Amazon and you should consider doing the same.
Mykola Sosiukin
This article was published on Dividend Kings on May 3.
You’ve probably heard of Warren Buffett, Joel Greenblatt, Peter Lynch, Howard Marks, and John Templeton.
These Are The Greatest Investors In History
| Name | Returns | Time Horizon | Most Famous For |
| Jim Simons (Co-Founder Renaissance Technologies) | 62% CAGR | 1988 to 2021 (best investing record ever recorded) | Pure Quant-Based Investing |
| Joel Greenblatt | 40% CAGR | 21 years at Gotham Capital | “Above-Average Quality Companies At Below-Average Prices” |
| George Soros | 32% CAGR | 31 years |
Valuation mean reversion, “Reflexivity” = Opportunities can be found by carefully studying the value and the market prices of assets. |
| Peter Lynch | 29.2% CAGR at Fidelity’s Magellan Fund | 1977 to 1990 (13 years) | “Growth At A Reasonable Price” |
| Bill Miller (Legg Mason Value Trust 1990 to 2006) | 22.8% CAGR and beat the S&P 500 for 15 consecutive years | 16 years | |
| Warren Buffett | 20.8% CAGR at Berkshire | 55 Years | Greedy when others are fearful |
| Benjamin Graham | 20% CAGR vs 12% S&P 500 | 1934 to 1956 (22 years) | Margin of Safety |
| Edward Thorp | 20+% CAGR | over 30 years | invented card counting, pure statistically-based investing |
| Charlie Munger | 19.80% | 1962 to 1975 | Wonderful companies at fair prices |
| Howard Marks | 19% CAGR | Since 1995 | Valuation Mean Reversion |
| Anne Scheiber | 18.3% CAGR | 50 years |
Turned $5K into $22 million with no formal training, purely with tax-efficient buy-and-hold blue-chip investing. |
| John Templeton | 300% from 1939 to 1943, 15.8% CAGR from 1954 to 1992 | 38 years | Market Cycles |
| Wilmot Kidd | 14.7% CAGR vs. 11.8% S&P 500 | 1974 to 2021 (47 years) | Concentrated, Fundamentals Driven CEF |
| Carl Icahn | 14.6% CAGR vs. 5.6% S&P 500 |
2001 to 2016 (15 Years) |
|
| David Swenson | 13.9% CAGR at Yale’s Endowment (includes bonds and alternative assets) vs 10.7% S&P 500 | 30 years | Alternative Asset Allocation |
| Larry Puglia | 12.1% CAGR vs. 10.2% CAGR S&P 500 | 28 years running TROW’s flagship blue-chip fund | Pure blue-chip/wide moat focus. |
| Geraldine Weiss | 11.2% vs. 9.8% S&P 500 | 37 years |
Best risk-adjusted track record of any newsletter over 30 years, according to Hubbert Financial Digest, popularized dividend yield theory (the only strategy she employed) |
You’ve probably never heard of Jim Simons, but he’s a legend on Wall Street and the “man who solved the market.” Jim Simons is a U.S. mathematician who founded Renaissance Technologies in 1982. It became the most successful quant hedge fund in history.
- $73 billion in assets under management
- $10 billion in its flagship Medallion fund.
It’s also one of the most expensive, but worth every penny.
Nick Maggiuli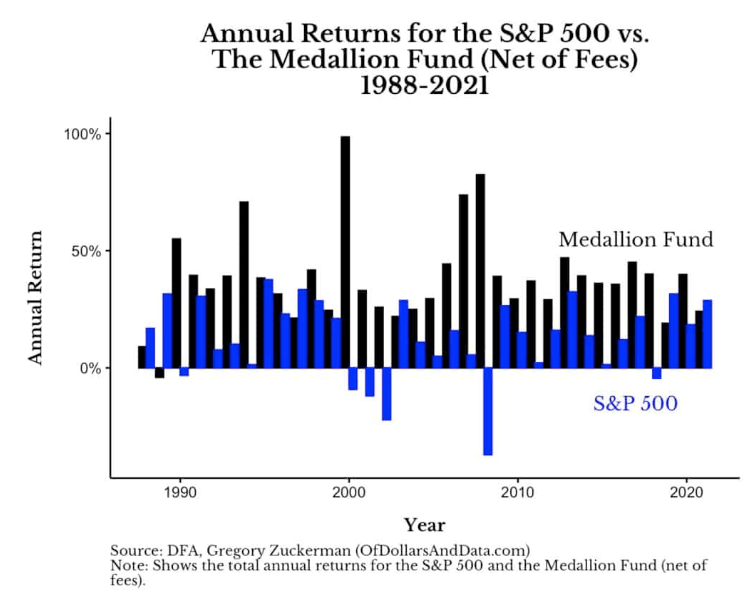
49% Fees And Worth Every Penny
Ben Carlson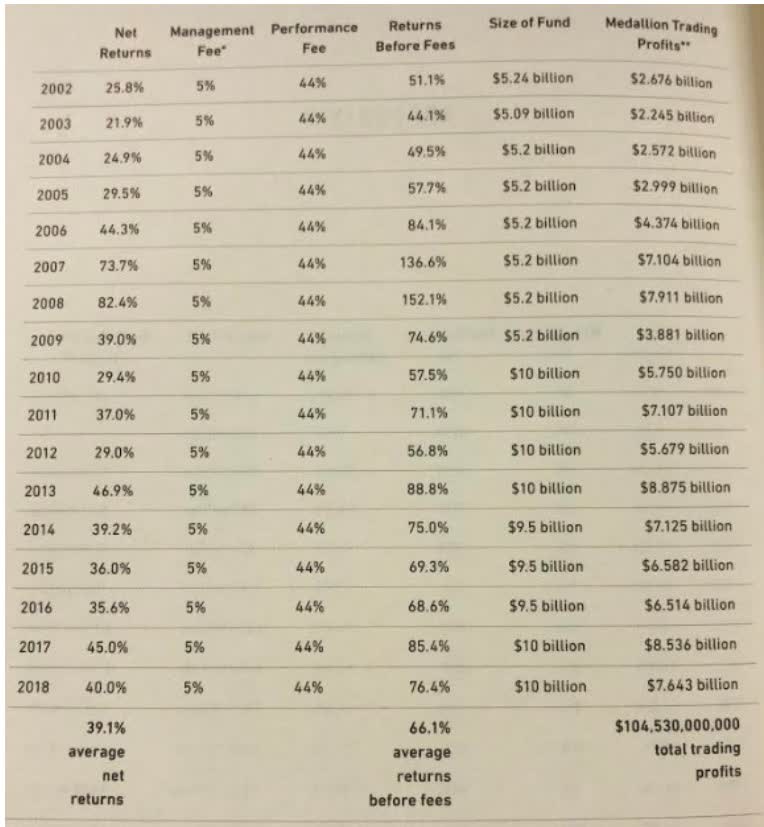
What about returns after 2018?
Renaissance’s flagship Medallion Fund generated 62% annualized returns (before fees) and 37% annualized returns (net of fees) from 1988-2021…
To put this performance in perspective, $1 invested in the Medallion Fund from 1988-2021 would have grown to almost $42,000 (net of fees) while $1 invested in the S&P 500 would have only grown to $40 over the same time period. Even a $1 investment in Warren Buffett’s Berkshire Hathaway would have only grown to $152 during this time. ” – Nick Magiulli.
This fund is now closed to everyone except company employees since its strategy only works for $10 billion fund sizes.
The best trading returns in history have made Jim Simons the 51st richest person in the world, worth $26 billion.
The geeks shall inherit the earth, indeed.
Guess what? The greatest trader in history, who delivered 42,000X returns over 33 years, isn’t a market timer.
Don’t believe me that Simons is the greatest trader of all time? You don’t have to take my word for it, or Nick Maggiulli’s, or Harvard’s.
Wall Street Journal Michael Batnick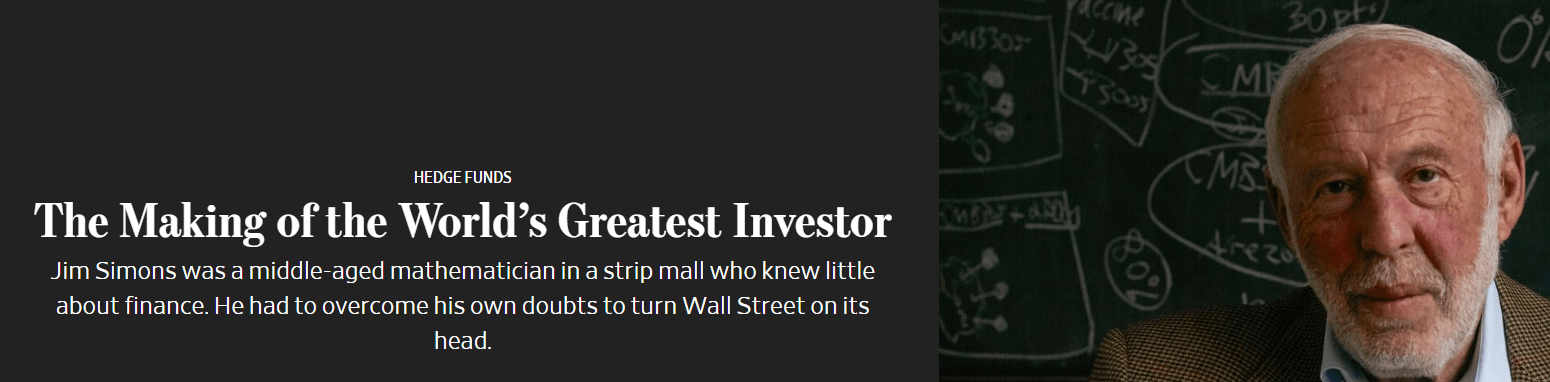
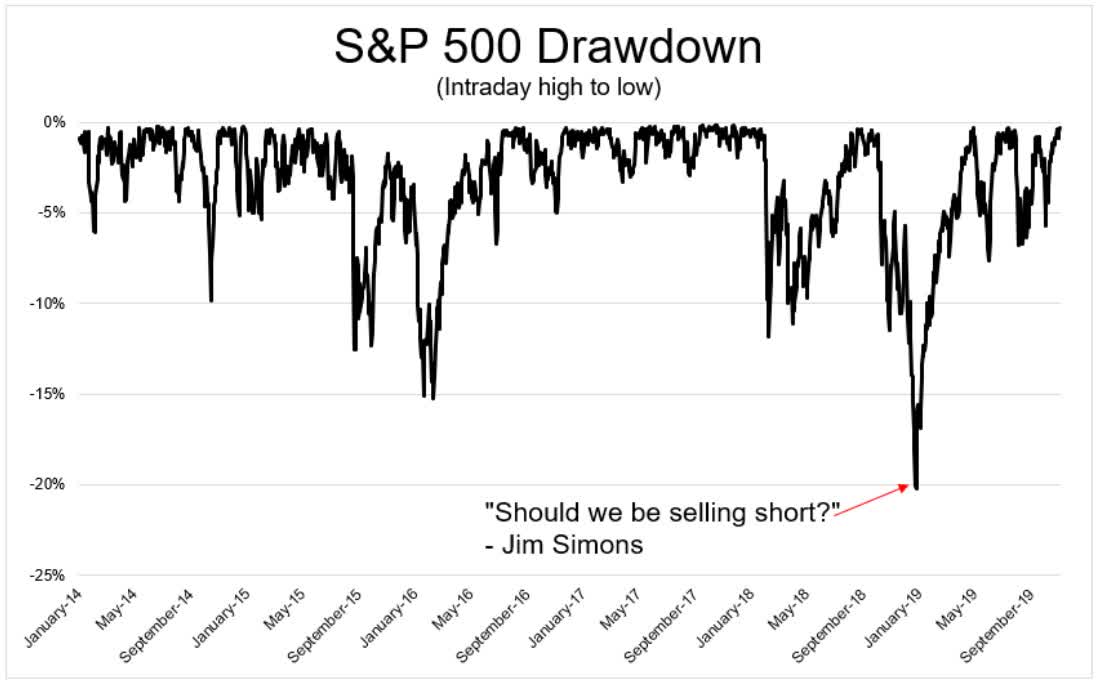
Simons can no more call a bear market bottom than you or I. Medallion doesn’t time the market in the traditional sense.
Rather, it uses the world’s best quantitative algorithms, running on the most advanced supercomputers and using the best data, to make millions of small trades per day.
- each gain is 1%
- each loss is 1%
- Medallion’s algos are right 52% of the time.
Why is 52% important? Because it’s how often the U.S. stock market has gone up on any given day for the last century.
Basically, what Simons did with Medallion was figure out a way to compress time and hyper-accelerate compounding in hundreds of financial markets.
But Jim Simmons isn’t just a quant trader. After all, there’s a reason Medallion is capped at $10 billion and closed to all but Renaissance employees.
Its strategy can’t scale to $100 billion or $100 trillion. The money-making magic only works on $10 billion.
That’s why Simons is also a great long-term investor.
Yes, the greatest trader of all time, who makes millions of small bets per day, is also a great long-term investors.
In fact, take a look at some of Simons’ closed trades.
- Dave (DAVE) – A software company he sold in September 2022 for a 904% profit.
- My Size (MYSZ) – A software company he sold in September 2022 for a 591% profit.
- Professional Diversity Network (IPDN) – Human resources company he sold in March 2022 for a 468% profit.
And he still owns 22 stocks that he’s up over 1000% in the last few years.
And guess what? The greatest trader in history, and one of the best value investors of all time, recently more than tripled his position in Amazon (NASDAQ:AMZN).
Gurufocus Premium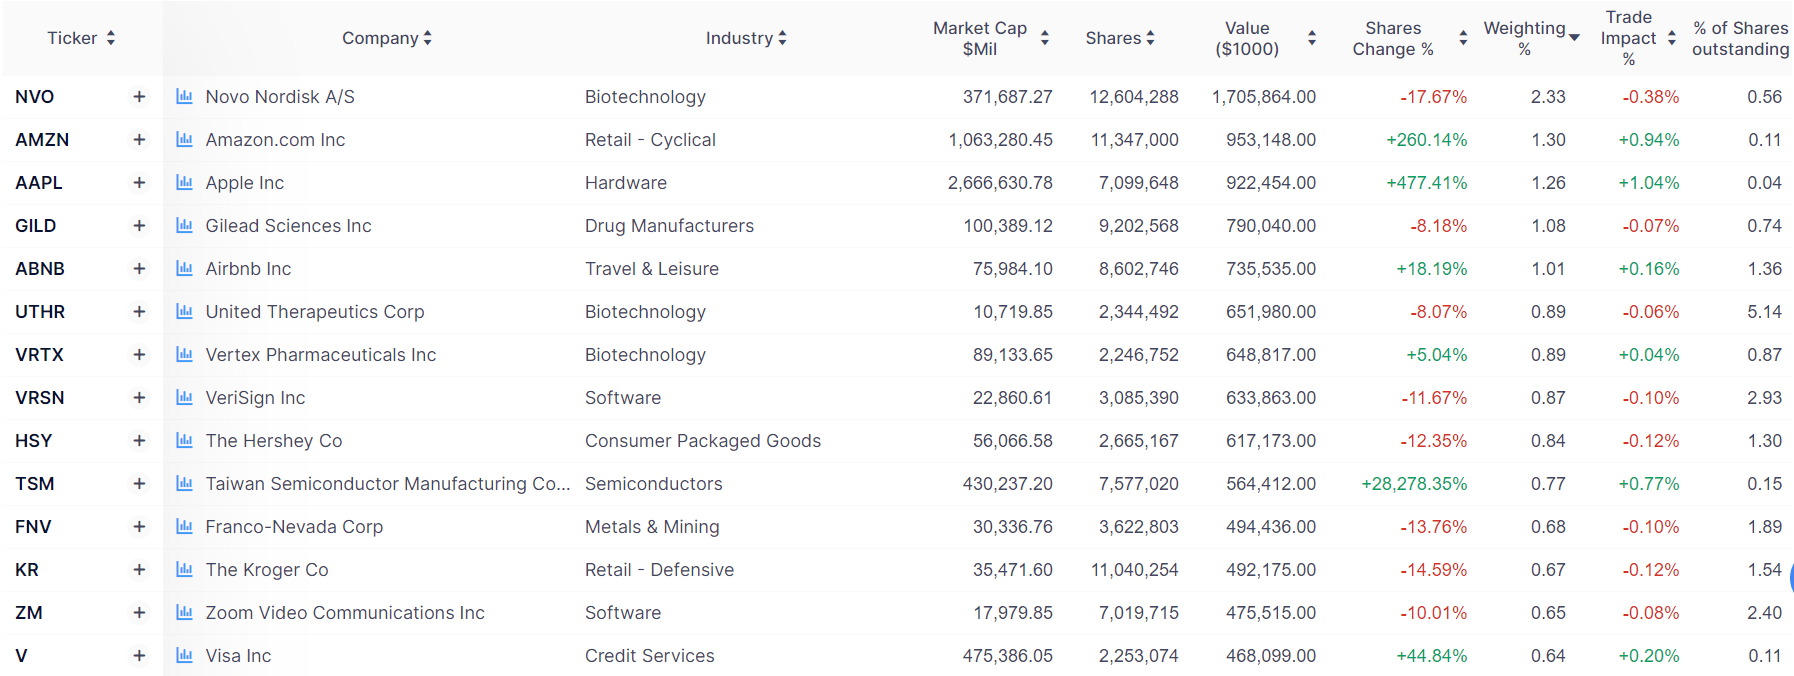
Yes, the “man who solved the market” bought almost $700 million from Amazon in Q4 and now owns almost $1 billion.
Why is Simmons so bullish on Amazon that it’s his second-largest position?
Let me show you why the greatest trader in history is backing up the truck on Amazon, and you might want to consider doing the same.
Amazon Earnings: Don’t Let The Headlines Scare You
Amazon soared 12% after hours and finished the next day -2%. Why?
- Revenue up 11% in constant currency to $127.4 billion
- 3rd party sales up 18%
- subscription revenue (Prime) up 15%
- AWS up 16%
- Advertising (75% operating margins) up 21%
We are impressed that Amazon’s advertising revenue growth meaningfully outpaced internet advertising giants Meta (META) and Alphabet (GOOG) (GOOGL). AWS was our biggest concern this quarter, as customer optimization efforts led to revenue growth deceleration, a trend that is still ongoing as the offering saw growth of only 11% in the month of April.
On the bright side, Microsoft is seeing the same trend, and both companies expect these efforts to ease beginning around midyear. Management remains rightfully upbeat on AWS and is continuing to invest heavily in the segment.” – Morningstar
Wall Street was upset by AWS guidance coming in lighter than expected, but as Morningstar points out, MSFT is also being affected by a growth in cloud spending.
Why? Isn’t the cloud supposed to be bullet proof in recessions? No, just recession resistant.
Think of it like this. What’s the main selling point of cloud computing? That companies can outsource their data needs cost effectively.
If you’re a company that’s seeing blockbuster growth you can call Amazon and tell them you need 100% or even 200% more server capacity, and they can do that.
And if business slows or goes negative? Then you can scale down your capacity, and Amazon can do that too.
The new customer pipeline looks strong. The set of ongoing migrations of workloads to AWS is strong. The product innovation and delivery is rapid and compelling. And people sometimes forget that 90-plus percent of global IT spend is still on-premises. If you believe that equation will flip, which we do, it will move to the cloud. And having the cloud infrastructure offering with the broadest functionality by a fair bit, the best securing operational performance, and the largest partner ecosystem bodes well for us moving forward.” – AMZN CEO, Q1 conference call
Cloud is one of the greatest secular megatrends in history, a game-changing way businesses boost productivity.
What about AI? The latest obsession on Wall Street? The battleground of such tech titans as Microsoft and Alphabet?
Amazon: A Leader In Artificial Intelligence
Amazon has been a leader in AI for close to 20 years.
- Personalized Product Recommendations
- Supply Chain Optimization
- Fraud Detection
- Customer Service
- Image and Video Analysis
And that’s how Amazon uses AI in its own business. This is what it offers to its clients.
SeAsia
We’re not close to being done inventing in AWS. Another recent example is our recent announcement on Large Language Models and generative AI and the chips and managed services associated with them. – AMZN CEO, Q1 conference call
On April 13, Amazon introduced Bedrock, a much better-named large language model than ChatGPT or Bard.
Through its Bedrock generative AI service, Amazon Web Services will offer access to its own first-party language models called Titan, as well as language models from startups AI21 and Google-backed Anthropic, and a model for turning text into images from startup Stability AI. One Titan model can generate text for blog posts, emails, or other documents. The other can help with search and personalization.” – CNBC
While MSFT is racing to integrate ChatGPT4 into Bing, Amazon, like Apple (AAPL), isn’t worried about being first, they want to be best.
- Apple didn’t invent the MP3 player, but they perfected it through the iPod
- Apple didn’t invent the smartphone; they invented the modern smartphone we all use today
- Apple didn’t invent the tablet; they just created the best and most successful one
- Apple isn’t concerned with being first, they want to be the best option
Amazon has worked on AI for more than two decades, and AWS has racked up over 100,000 AI customers. He added that Amazon has been using a fine-tuned version of Titan to deliver search results through its homepage.” – CNBC
The same goes for Amazon and customer-facing AI.
People using ChatGPT and Microsoft’s Bing chatbot based on OpenAI language models have sometimes encountered inaccurate information due to a behavior called hallucination, where the output appears convincing but has nothing to do with the training data. Amazon is “really concerned about” accuracy and ensuring its Titan models produce high-quality responses, Bratin Saha, an AWS vice president, told CNBC in an interview…
“We always actually launch when things are ready, and all these technologies are super early,” Sivasubramanian said. He said Amazon wants to ensure Bedrock will be easy to use and cost-effective, thanks to the use of custom AI processors.
C3.ai, Pegasystems, Accenture and Deloitte are among the companies looking forward to using Bedrock, he wrote in a blog post.” – CNBC
Do you think billion-dollar corporations are interested in inaccurate information?
Imagine a customer service bot running on AI that starts spouting nonsense or even threatening its customers.
Digital Trends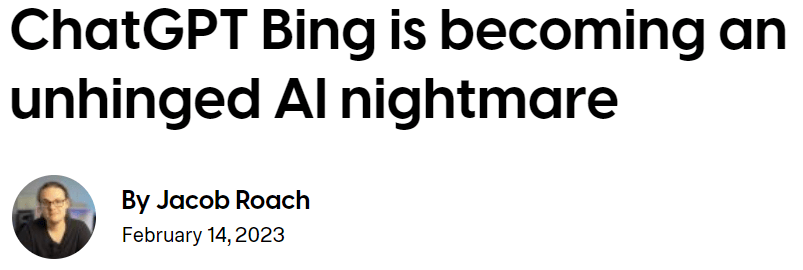
The AI claims that the user has “been wrong, confused, and rude,” and they have “not shown me any good intention towards me at any time.” The exchange climaxes with the chatbot claiming it has “been a good Bing” and asking for the user to admit they’re wrong and apologize, stop arguing, or end the conversation and “start a new one with a better attitude…
These aren’t just isolated incidents from Reddit, either. AI researcher Dmitri Brereton showed several examples of the chatbot getting information wrong, sometimes to hilarious effect and other times with potentially dangerous consequences.
The chatbot dreamed up fake financial numbers when asked about GAP’s financial performance, created a fictitious 2023 Super Bowl in which the Eagles defeated the Chiefs before the game was even played, and even gave descriptions of deadly mushrooms when asked about what an edible mushroom would look like.” – Digital Trends
Making up data, getting into arguments with customers, and giving out potentially life-threatening misinformation.
Do you think this is what Procter & Gamble or Coke are looking for right now?
Do you think Ford dares launch an AI Bing-powered chatbot with its customers?
The liabilities big companies would face if they integrated flashy AI that kills people would be in the billions.
Amazon: Still The King Of Cloud
Statista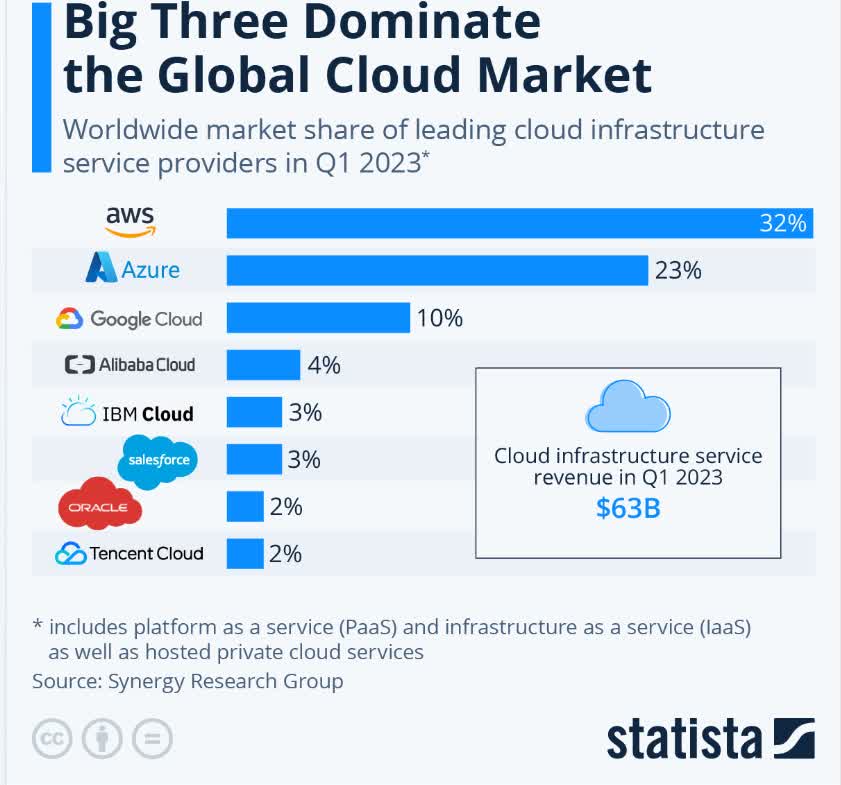
AMZN didn’t start the cloud computing revolution. That was Salesforce (CRM) in 1999. But Amazon, like Apple, perfected the cloud by offering the same back-office products and services and data analytics it used for its business to clients. And that’s why from 2006 to 2023, AWS grew into an $85 billion per year business.
Statista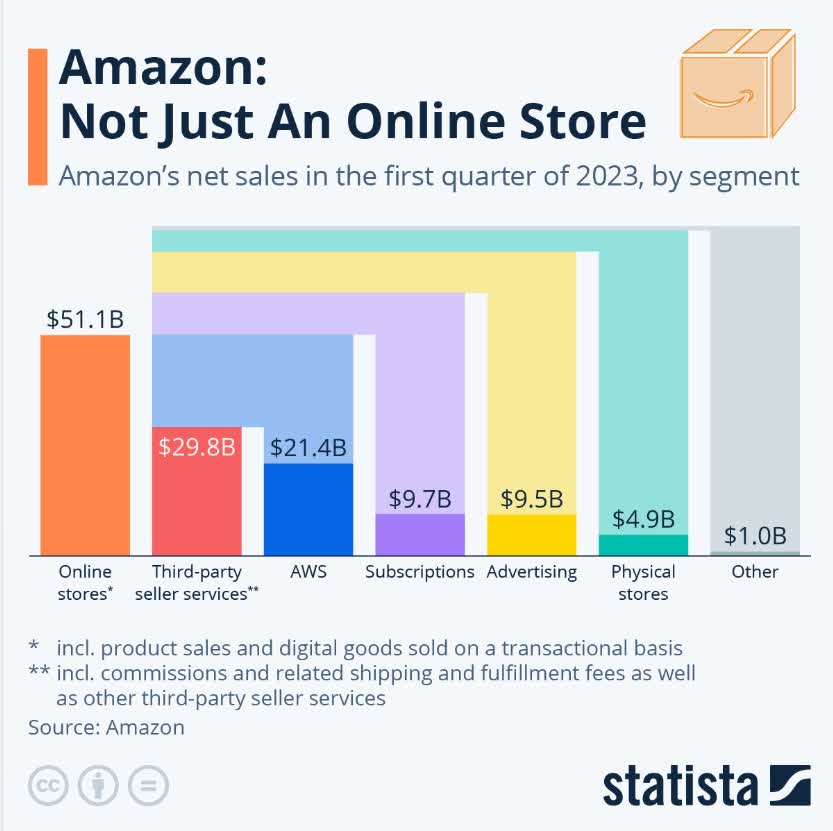
Amazon’s empire is incredible. In fact, its total sales surpass its next 50 competitors combined.
And Amazon’s growth prospects remain as bright as ever.
Statista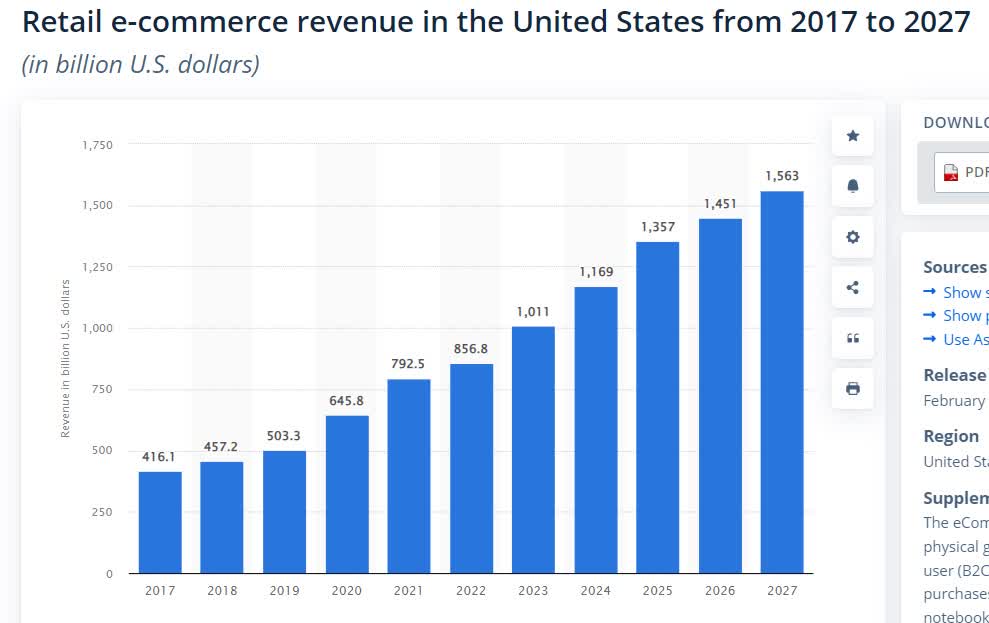
Here are the growth rates for retail e-commerce in the US by year, according to Statista:
- 2018: 10%
- 2019: 10%
- 2020 (Pandemic): 28%
- 2021 (Record Stimulus): 23%
- 2022: 8%
- 2023: 18%
- 2024: 16%
- 2025: 16%
- 2026: 7%
- 2027: 8%
From 2022 to 2027, Statista estimates 13% annual sales in e-commerce sales, meaning AMZN benefits from a very strong secular trend.
Statista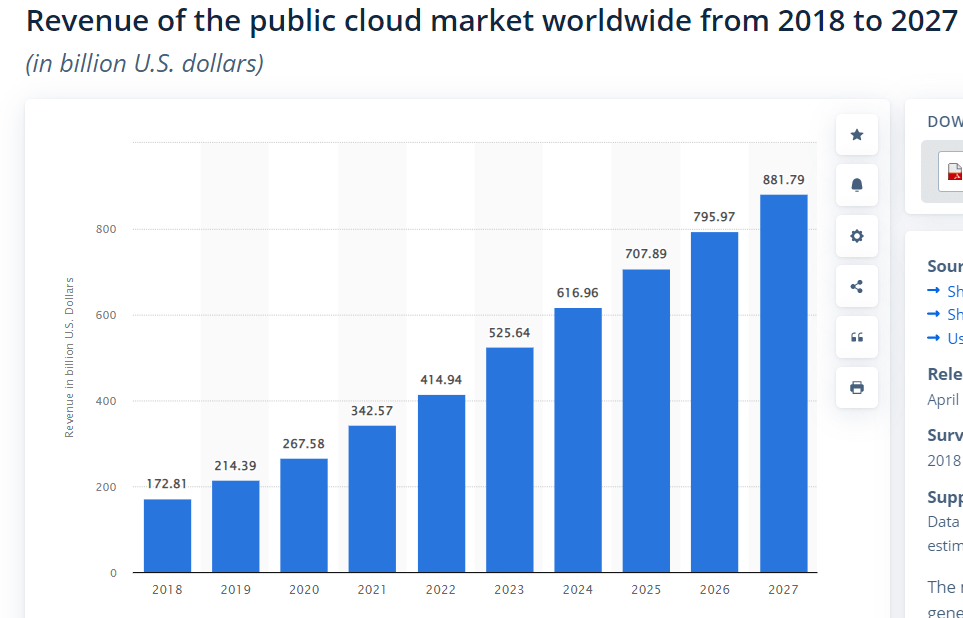
And the cloud is the heart of Amazon’s success.
This industry, growing at 16% per year, is Amazon’s profit engine, and allows it to have the most efficient ads. Which drives its 75% operating margin advertising business.
Cloud is what lets Amazon know what shoppers want, what streamers want to watch, and thus how to make Prime as valuable as possible.
The average non-Prime shopper spends $600 per year, and the average Prime member $1,400.
And this flywheel of growth is all made possible by AWS which is run on some of the most effective and productive AI the world has ever seen.
Long-Term Prospects Are Potentially Life Changing
Why am I such a fan of Amazon? Is it because I’m a Prime member and spend around $2,000 to $3,000 per year on it? Sure.
Is it because Amazon was able to cut my dog’s expenses by 50%, saving me $750 per year? You bet.
Is it because Amazon is one of the greatest job engines of our age?
Ycharts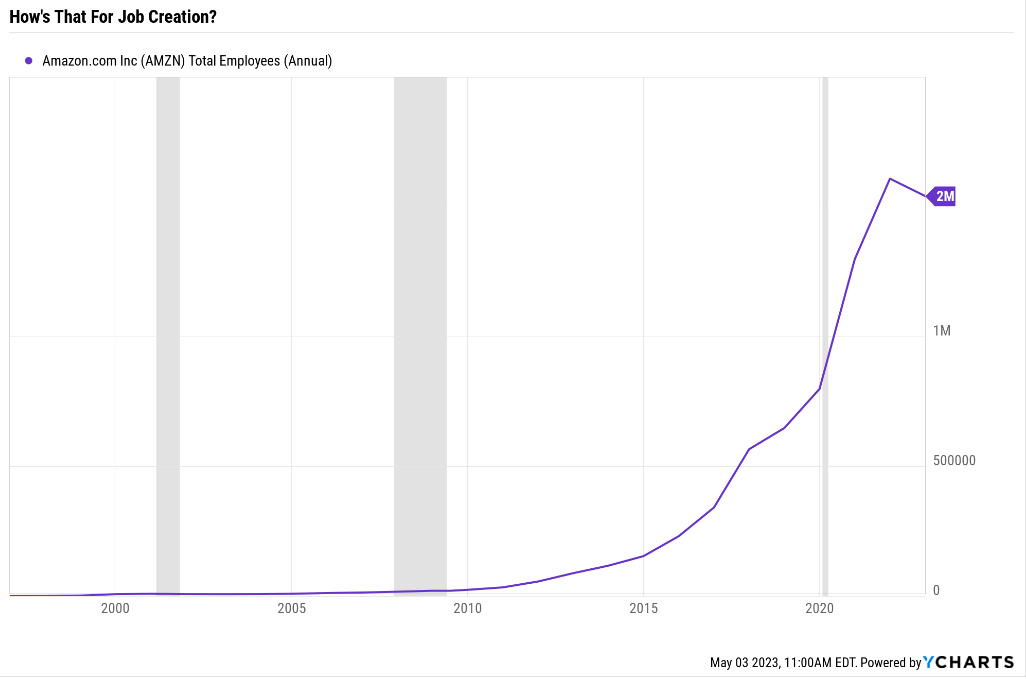
Today 1.25% or 1 in 82 American workers work for Amazon.
You bet I’m in favor of more jobs.
Zippia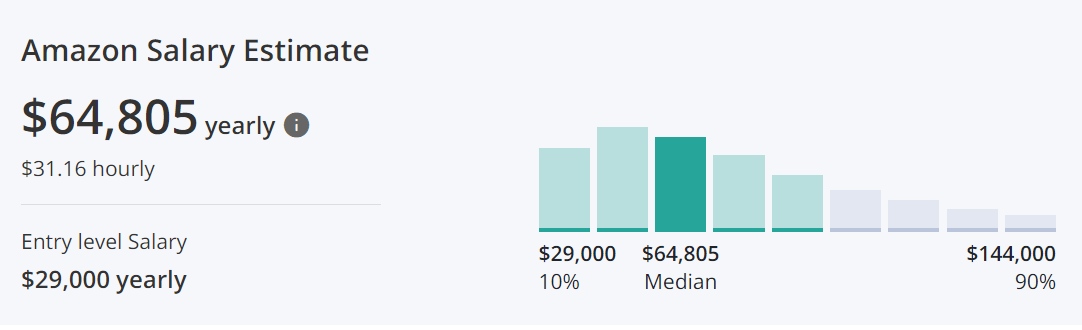
Good paying jobs that pay a median of $31.16 per hour.
- The median US worker makes $57,200 per year
- The median Amazon worker makes 13% more
But as an investor, philanthropist and manager of my family’s $2.5 million hedge fund, what I care most about is how much money Amazon can make for shareholders like us.
And this is where the numbers are truly out of this world.
FactSet Research Terminal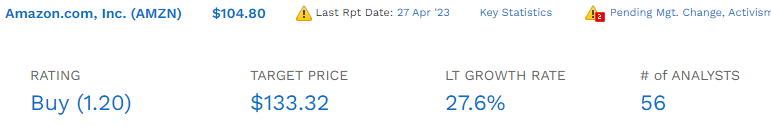
How does 27.6% long-term growth potential sound? That’s the median estimate from 56 analysts who cover Amazon for a living and collectively know it better than Andy Jassy or Jeff Bezos.
How is that possible? How can a company with over $500 million in sales grow at almost 30% per year?
FactSet Research Terminal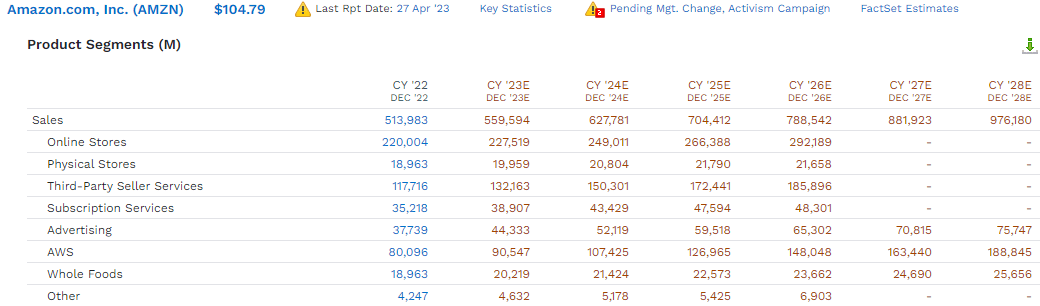
Remember that the key to Amazon’s cash flow and earnings growth is the growth of its most profitable businesses, AWS, and advertising.
- The retail businesses just feed it data that makes cloud and advertising so sticky
- Without retail cloud and advertising can’t grow
- Without cloud and advertising, there is no point in retail
Through 2028, analysts expect adverting to grow to a $76 billion business.
- 12.6% annual growth rate
Through 2028 analysts expect AWS to grow into a $189 billion business.
- 15.4% annual growth
But thanks to exponentially growing economies of scale, here’s the consensus for Amazon’s bottom line growth.
Medium-Term Growth Consensus
| Year | Sales | Free Cash Flow | EBITDA | EBIT (Operating Income) | Net Income |
| 2022 | $513,983 | -$11,569 | $73,583 | $12,248 | $23,200 |
| 2023 | $559,594 | $20,150 | $83,656 | $22,063 | $25,459 |
| 2024 | $627,781 | $38,889 | $101,715 | $34,137 | $29,870 |
| 2025 | $704,412 | $61,546 | $120,236 | $49,790 | $34,838 |
| 2026 | $788,542 | $85,866 | $153,854 | $69,522 | $40,274 |
| 2027 | $881,923 | $105,642 | $181,480 | $86,451 | $45,107 |
| 2028 | $976,180 | $130,274 | $211,818 | $109,943 | $49,467 |
| Annualized Growth 2022-2028 | 11.28% | 45.25% | 19.27% | 44.16% | 13.45% |
| Cumulative 2023-2028 | $4,538,432 | $442,367 | $852,759 | $371,906 | $225,015 |
(Source: FactSet Research Terminal)
11% sales growth, 13% net profit growth, 19% EBITDA growth, 44% operating profit growth, and 45% free cash flow growth!
Yes, the next Amazon is… Amazon!
By 2028 Amazon is expected to be generating $130 billion per year in free cash flow.
For context, here are the consensus 2028 FCF estimates for the other tech giants.
- Alphabet: $168 billion
- Apple: $162 billion
- Microsoft: $139 billion
- Amazon: $130 billion
- Meta: $44 billion
- Tesla: $24 billion
- NVIDIA: $16 billion
- 7 Tech Giants: $683 billion
What’s even more amazing is that in 2028, a year when Amazon is going to be a monster of a free cash flow minting machine, its free cash flow is expected to grow 24%.
| Year | FCF Margin | EBITDA Margin | EBIT (Operating) Margin | Net Margin |
| 2022 | -2.3% | 14.3% | 2.4% | 4.5% |
| 2023 | 3.6% | 14.9% | 3.9% | 4.5% |
| 2024 | 6.2% | 16.2% | 5.4% | 4.8% |
| 2025 | 8.7% | 17.1% | 7.1% | 4.9% |
| 2026 | 10.9% | 19.5% | 8.8% | 5.1% |
| 2027 | 12.0% | 20.6% | 9.8% | 5.1% |
| 2028 | 13.3% | 21.7% | 11.3% | 5.1% |
| Annualized Growth | 29.95% | 7.74% | 23.36% | 2.18% |
Most companies would kill to have a 30% growth rate in sales, much less free cash flow margin.
And 45% annualized growth in free cash flow? 24% off a base of $105 billion in 2027? That’s truly mind-bending stuff. But Amazon is expected to make it happen.
And guess what? All this incredible growth, an empire of AI-powered retail, streaming, cloud computing, and advertising, can be yours for an absurdly wonderful price.
Valuation Is Outrageously Attractive
FAST Graphs, FactSet FAST Graphs, FactSet FAST Graphs, FactSet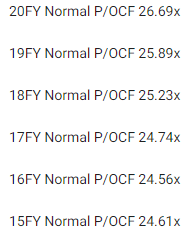
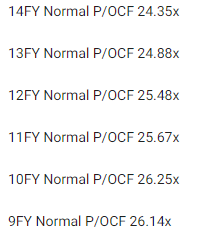
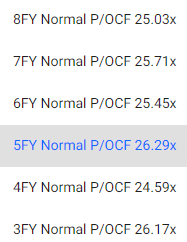
Why is Amazon worth 24 to 26 times its cash flow? Because over 20 years, billions of investors have bought and sold it at that valuation, outside of bear markets and bubbles.
- 91% statistical probability intrinsic value is within this range
| Metric | Historical Fair Value Multiples (14-Years) | 2022 | 2023 | 2024 | 2025 | 2026 |
12-Month Forward Fair Value |
| Operating Cash Flow | 25.67 | $117.83 | $122.19 | $202.02 | $305.99 | $356.81 | |
| Average | $117.83 | $122.19 | $202.02 | $305.99 | $356.81 | $149.82 | |
| Current Price | $104.64 | ||||||
|
Discount To Fair Value |
11.19% | 14.36% | 48.20% | 65.80% | 70.67% | 30.16% | |
| Upside To Fair Value | 12.60% | 16.77% | 93.06% | 192.42% | 240.99% | 43.18% | |
| 2023 OCF | 2024 OCF | 2023 Weighted OCF | 2024 Weighted OCF | 12-Month Forward OCF | 12-Month Average Fair Value Forward P/OCF | Current Forward P/OCF |
Current Forward Cash-Adjusted PE |
| $4.76 | $7.87 | $3.11 | $2.72 | $5.84 | 25.7 | 17.9 | 13.1 |
Amazon is historically worth about 26X cash flow and today trades at 17.9X and 13.1X cash-adjusted earnings for a company growing 28% long-term and 45% in the medium term.
- 0.47 PEG ratio
- hyper-growth at a wonderful price
| Rating | Margin Of Safety For Low-Risk 13/13 Ultra SWAN | 2023 Fair Value Price | 2024 Fair Value Price | 12-Month Forward Fair Value |
| Potentially Reasonable Buy | 0% | $122.19 | $202.02 | $149.82 |
| Potentially Good Buy | 5% | $116.08 | $191.92 | $142.33 |
| Potentially Strong Buy | 15% | $103.86 | $171.72 | $127.35 |
| Potentially Very Strong Buy | 25% | $87.06 | $151.52 | $112.37 |
| Potentially Ultra-Value Buy | 35% | $79.42 | $131.31 | $97.39 |
| Currently | $104.64 | 14.36% | 48.20% | 30.16% |
| Upside To Fair Value (Including Dividends) | 16.77% | 93.06% | 43.18% |
For anyone comfortable with its risk profile, Amazon is a potentially very strong buy, and here’s why.
Amazon 2025 Consensus Total Return Potential
FAST Graphs, FactSet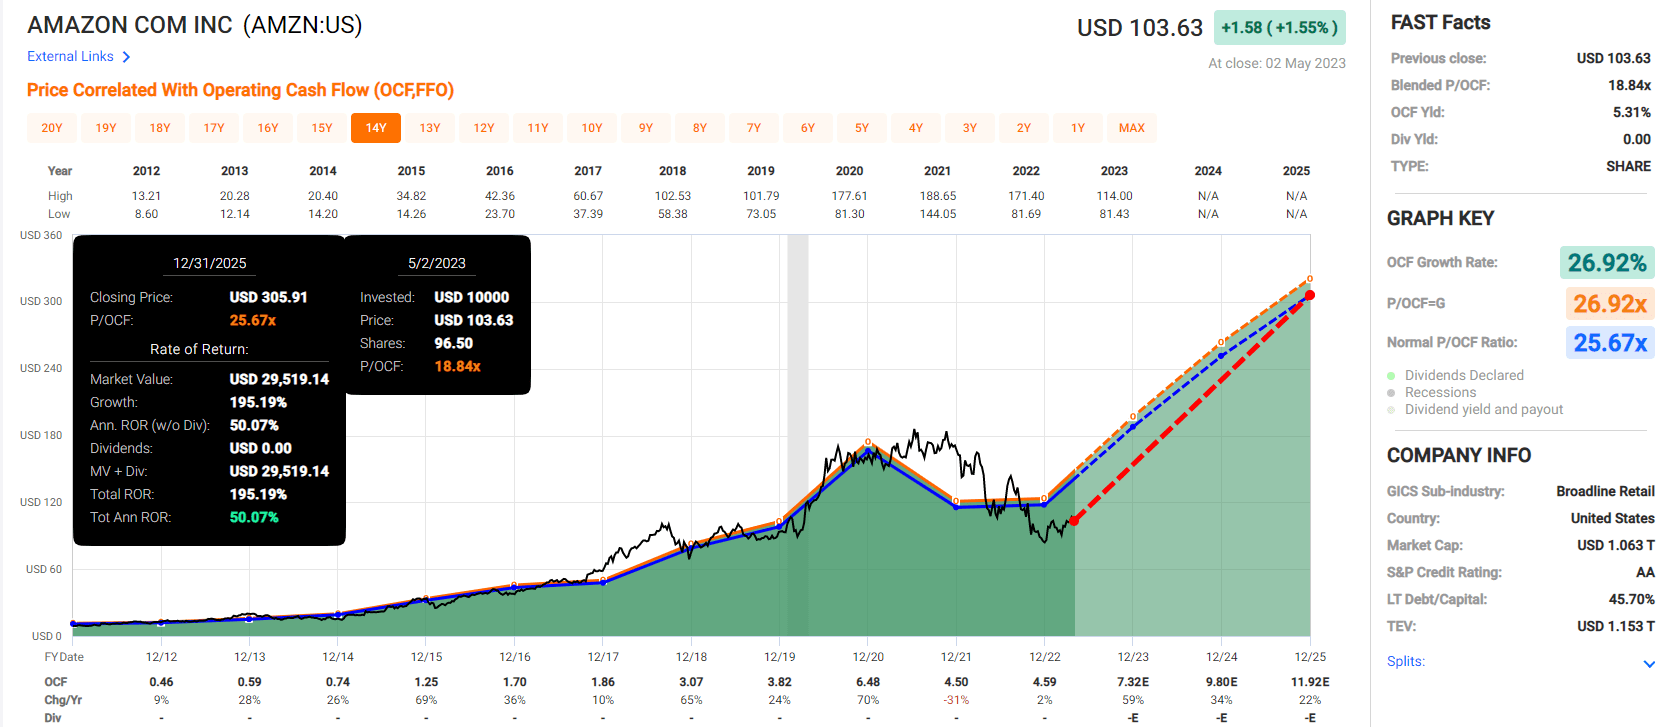
Amazon 2029 Consensus Total Return Potential
FAST Graphs, FactSet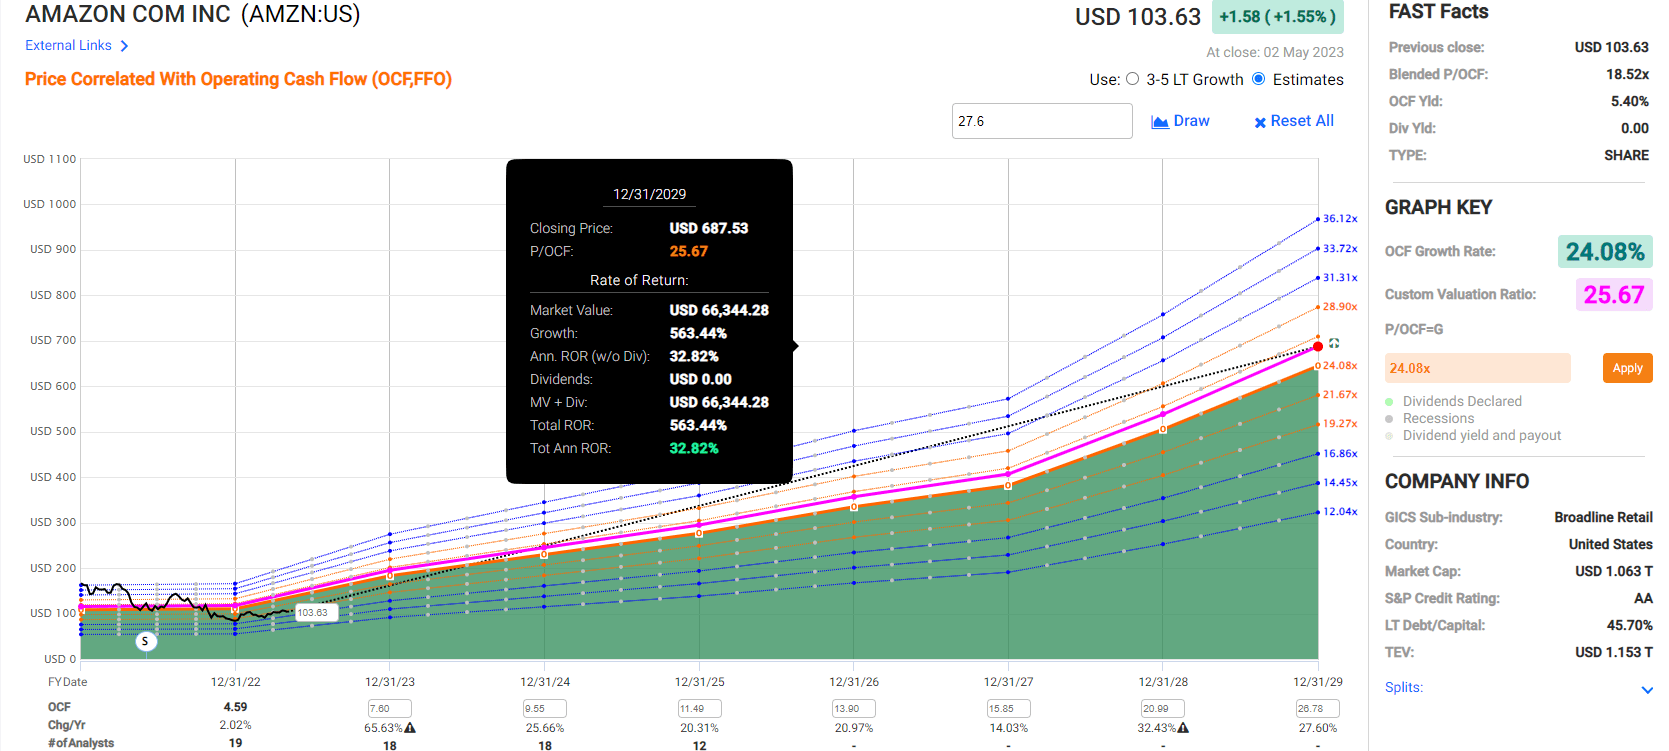
How many AA-rated companies do you know that could triple in the next three years and almost 7X in the next six?!
This is why I own 1000 shares of Amazon and look forward to buying a lot more in the coming years.
Risk Profile: Why Amazon Isn’t Right For Everyone
There are no risk-free companies, and no company is right for everyone. You have to be comfortable with the fundamental risk profile.
AMZN’s Risk Profile Summary
- inherent cyclicality of retail with the economy
- disruption risk (nearly 1,000 major competitors globally), including MSFT Meta, and GOOG in its most important businesses
- political/regulatory risk – anti-trust risk domestically and globally
- global expansion risk (not as easy to disrupt foreign markets with entrenched giants)
- new market penetration risk: healthcare, especially, is a very highly regulated and challenging industry to disrupt
- M&A execution risk
- labor retention risk (tightest job market in over 50 years, and finance is a high-paying industry)
- Labor relations risk: the introduction of unions could increase labor expenses by approximately $150 million per 1% of the workforce (up to $15 billion per year)
- cybersecurity risk: hackers and ransomware
- currency risk: almost 40% of sales are from outside the US
Long-Term Risk Analysis: How Large Institutions Measure Total Risk
DK uses S&P Global’s global long-term risk-management ratings for our risk rating.
- S&P has spent over 20 years perfecting their risk model
- which is based on over 30 major risk categories, over 130 subcategories, and 1,000 individual metrics
- 50% of metrics are industry specific
- this risk rating has been included in every credit rating for decades
The DK risk rating is based on the global percentile of a company’s risk management compared to 8,000 S&P-rated companies covering 90% of the world’s market cap.
AMZN Scores 68th Percentile On Global Long-Term Risk Management
S&P’s risk management scores factor in things like:
- supply chain management
- crisis management
- efficiency
- labor relations
- customer relationship management
- climate strategy adaptation
- corporate governance
- brand management
AMZN’s Long-Term Risk Management Is The 214th Best In The Master List (57 Percentile In The Master List)
| Classification | S&P LT Risk-Management Global Percentile |
Risk-Management Interpretation |
Risk-Management Rating |
| BTI, ILMN, SIEGY, SPGI, WM, CI, CSCO, WMB, SAP, CL | 100 | Exceptional (Top 80 companies in the world) | Very Low Risk |
| Strong ESG Stocks | 86 |
Very Good |
Very Low Risk |
| Foreign Dividend Stocks | 77 |
Good, Bordering On Very Good |
Low Risk |
| Ultra SWANs | 74 | Good | Low Risk |
| Amazon | 68 | Above-Average (Bordering On Good) | Low Risk |
| Dividend Aristocrats | 67 | Above-Average (Bordering On Good) | Low Risk |
| Low Volatility Stocks | 65 | Above-Average | Low Risk |
| Master List average | 61 | Above-Average | Low Risk |
| Dividend Kings | 60 | Above-Average | Low Risk |
| Hyper-Growth stocks | 59 | Average, Bordering On Above-Average | Medium Risk |
| Dividend Champions | 55 | Average | Medium Risk |
| Monthly Dividend Stocks | 41 | Average | Medium Risk |
(Source: DK Research Terminal)
AMZN’s risk-management consensus is in the top 43% of the world’s highest quality companies and similar to that of such other blue-chips as
- Hormel Foods: Ultra SWAN dividend king
- Realty Income: Ultra SWAN dividend aristocrat
- Enterprise Products Partners (uses K-1 tax form): Ultra SWAN
- Nike: Ultra SWAN
- Eli Lilly: Ultra SWAN
The bottom line is that all companies have risks, and AMZN is above-average at managing theirs, according to S&P.
How We Monitor AMZN’s Risk Profile
- 56 analysts
- three credit rating agencies
- 59 experts who collectively know this business better than anyone other than management
- and the bond market for real-time fundamental risk-assessments
“When the facts change, I change my mind. What do you do, sir?” – John Maynard Keynes
There are no sacred cows at iREIT or Dividend Kings. Wherever the fundamentals lead, we always follow. That’s the essence of disciplined financial science, the math behind retiring rich and staying rich in retirement.
Bottom Line: The Greatest Trader And One Of The Best Value Investors In History Is Backing Up The Truck On Amazon, And So Should You
Dividend Kings Automated Investment Decision Tool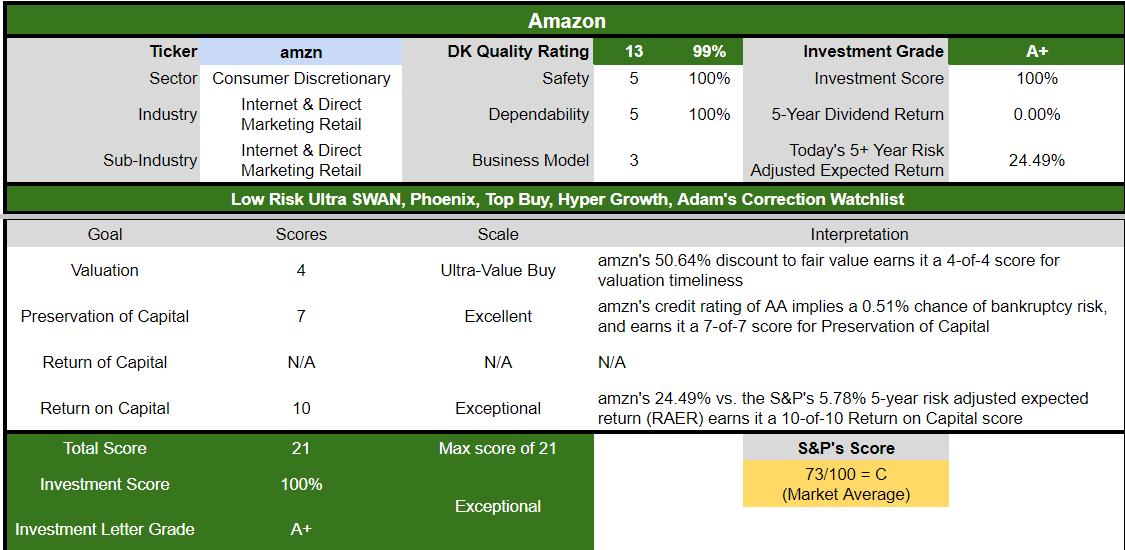
Let me be clear: I’m NOT calling the bottom in AMZN (I’m not a market-timer). And neither is Jim Simons.
Even Ultra SWAN kings can fall hard and fast in a bear market.
Fundamentals are all that determine safety and quality, and my recommendations.
- over 30+ years, 97% of stock returns are a function of pure fundamentals, not luck
- in the short term; luck is 25X as powerful as fundamentals
- in the long term, fundamentals are 33X as powerful as luck
While I can’t predict the market in the short term, here’s what I can tell you about AMZN. Here are all the reasons Simons backed up the truck on AMZN in Q4 and you should too.
- the ultimate hyper-growth Ultra SWAN
- an industry leader in cloud, advertising, streaming, and online retail
- 27.6% long-term return potential vs. 10.2% S&P
- historically 30% undervalued
- 17.9 vs. 24 to 26X historical
- 13.1X cash-adjusted earnings = 0.45 PEG
- 563% consensus return potential over the next six years, 33% annually, 11X more than the S&P 500
- 400% better risk-adjusted expected returns than the S&P 500 over the next five years
Could Amazon fall a lot from here in a 15% to 30% correction? Sure.
Goldman, US Treasury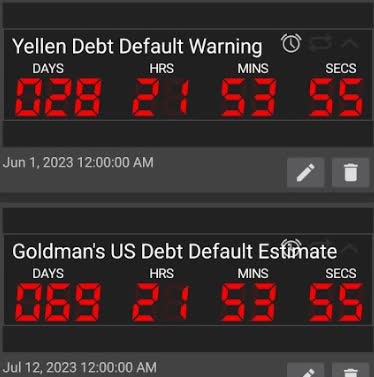
Is the debt ceiling deadline rapidly approaching and the most likely catalyst for a sharp sell off? Yes.
But unless you think the economy is going to implode forever and a never-ending depression is going to destroy Amazon’s growth prospects permanently, I’d recommend at least buying some today if you don’t own any.
Because when all the facts, the best trader in history, and one of the greatest value investors of all time says it’s time to back up the truck on Amazon, it pays to listen.
Analyst’s Disclosure: I/we have a beneficial long position in the shares of AMZN either through stock ownership, options, or other derivatives. I wrote this article myself, and it expresses my own opinions. I am not receiving compensation for it (other than from Seeking Alpha). I have no business relationship with any company whose stock is mentioned in this article.
DK owns AMZN in our portfolios.
Seeking Alpha’s Disclosure: Past performance is no guarantee of future results. No recommendation or advice is being given as to whether any investment is suitable for a particular investor. Any views or opinions expressed above may not reflect those of Seeking Alpha as a whole. Seeking Alpha is not a licensed securities dealer, broker or US investment adviser or investment bank. Our analysts are third party authors that include both professional investors and individual investors who may not be licensed or certified by any institute or regulatory body.
—————————————————————————————-

Dividend Kings helps you determine the best safe dividend stocks to buy via our Automated Investment Decision Tool, Zen Research Terminal, Correction Planning Tool, and Daily Blue-Chip Deal Videos.
Membership also includes
-
Access to our 13 model portfolios (all of which are beating the market in this correction)
-
my correction watchlist
- my $2.5 million family hedge fund
-
50% discount to iREIT (our REIT-focused sister service)
-
real-time chatroom support
-
real-time email notifications of all my retirement portfolio buys
-
numerous valuable investing tools
Click here for a two-week free trial, so we can help you achieve better long-term total returns and your financial dreams.