Summary:
- We share another one of the 22 Mega Cap stocks we see with potential for new all-time highs into 2023.
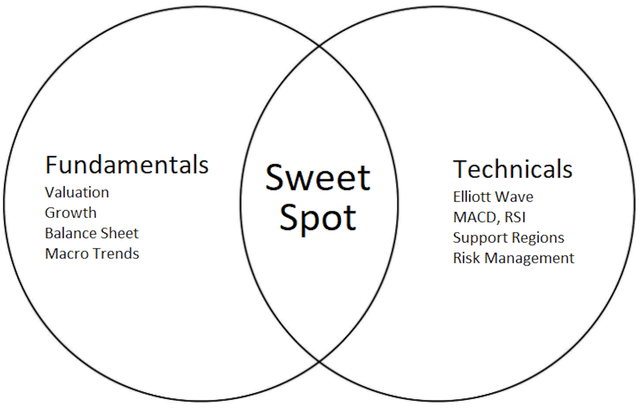
- Note how we use the intersection of fundamentals with technicals to find high probability setups for traders and investors.
- We look at the fundamentals for JNJ along with its historical valuation range compared with treasury yields.
- The technical picture is also aligning with the fundamentals. We outline key price levels and the current setup.
phototechno
By Levi at StockWaves; produced with Avi Gilburt
It was back in mid-November, just a few short weeks ago, that our lead analysts in StockWaves published a list of 22 Mega Cap stocks with potential for new all-time highs into 2023. Zac Mannes and Garrett Patten scoured hundreds of charts to filter them down to these 22 possibilities.
We then marry those technicals with favorable fundamentals to find high probability setups.
The Fundamental View With Lyn Alden
We have recent comments and visuals from Lyn Alden that help complete our current viewpoint:
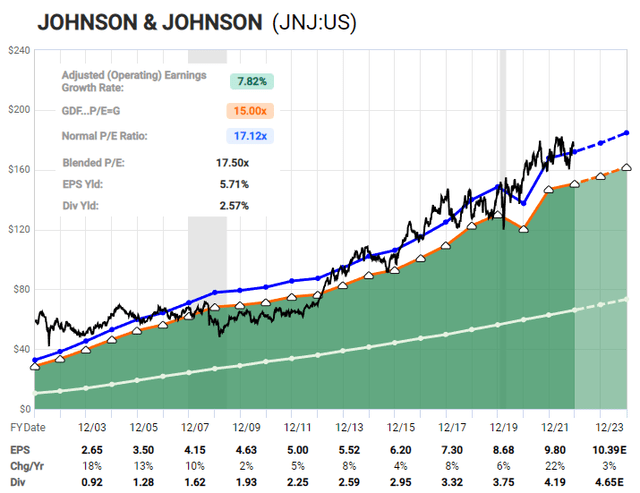
“JNJ is slightly above its historical valuation range, and thus a correction or consolidation would not be surprising. However, it continues to be a reasonable place to put long-term capital compared to cash or Treasuries, over any 5+ year view.”
“Historically, the 10-year Treasury yield had a higher rate than JNJ’s dividend yield, but of course without regular growth. The past decade was a weird exception (I’d argue a bond bubble) where JNJ’s dividend yield was higher than the 10-year Treasury yield, and so an investor got better current income that also grows each year.
We’re coming out of that unusual market regime, but on a historical basis, JNJ is still very reasonably-priced compared to the 10-year Treasury yield.”
The Current Technical Setup
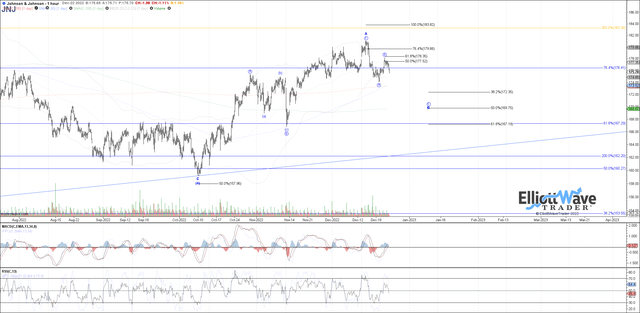
In the bigger picture, even though there may be a few twists and turns along the way, we view JNJ as ultimately reaching for a new all-time high in price in 2023. When we zoom in to the near term, you can see from the attached chart that a pullback may soon be in the offing. However, from there, a 5 wave advance should unfold that takes the stock above $200.
Risks
Should this framework continue to play out as illustrated, then price will stay above the October low of $159. Breaking below that low would require a revision of this near-term scenario.
What’s perhaps more salient though is that the new all-time high that may potentially be struck into 2023 likely provides a longer-lasting top in the chart. Why is this? It’s all about degrees.
Let’s Talk Degrees
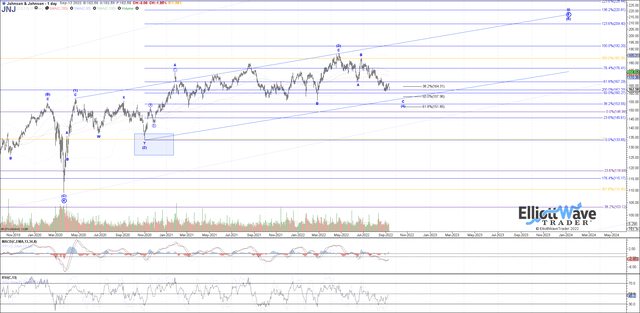
As you can see on this longer-term chart, JNJ neatly fulfilled an Intermediate wave 4 in October of this year at $159. This next anticipated high will be an Intermediate wave 5 of a larger Primary wave 5 of an even larger Cycle wave 3. What does all of this mean?
In updates and in educational material to our members on ElliottWaveTrader.net, Avi Gilburt has frequently published this thought:
“I have said many times in the past that I have found no analysis methodology that is able to put the market into context other than Elliott Wave analysis. The reason this is true is because Elliott Wave analysis understands that the market is fractal in nature. That means that the market is variably self-similar at all degrees of trend.
To take that another step further, in order to develop a better Elliott Wave count, all degrees of trend must fit into a structure in the manner in which an individual piece fits within a puzzle. You see, just because one sub-structure may ‘look’ one way, it must have a way to fit into the larger degree structure as well.”
We can take this understanding and overlay it onto the JNJ chart. By tracking the structure of price, the next high strike will likely be quite significant. It may very well be the high watermark for some years to come.
A Cycle wave III could mark the end of an uptrend that has been in place since the major low struck back in the year 1977. To save a few strokes on the calculator, that is 46 years. A Cycle wave IV would likely take some years to complete. This is not to say that JNJ will face some sort of a crash. Rather, a Cycle wave IV may simply render JNJ to be dead money with better opportunities to be had in other places in that time period.
I would like to take this opportunity to remind you that we provide our perspective by ranking probabilistic market movements based upon the structure of the market price action. And if we maintain a certain primary perspective as to how the market will move next, and the market breaks that pattern, it clearly tells us that we were wrong in our initial assessment. But here’s the most important part of the analysis: We also provide you with an alternative perspective at the same time we provide you with our primary expectation, and let you know when to adopt that alternative perspective before it happens.
There are many ways to analyze and track stocks and the market they form. Some are more consistent than others. For us, this method has proved the most reliable and keeps us on the right side of the trade much more often than not. Nothing is perfect in this world, but for those looking to open their eyes to a new universe of trading and investing, why not consider studying this further? It may just be one of the most illuminating projects you undertake.
Disclosure: I/we have no stock, option or similar derivative position in any of the companies mentioned, but may initiate a beneficial Long position through a purchase of the stock, or the purchase of call options or similar derivatives in JNJ over the next 72 hours. I wrote this article myself, and it expresses my own opinions. I am not receiving compensation for it. I have no business relationship with any company whose stock is mentioned in this article.
STOCK WAVES: Where fundamental analysis meets technical analysis for highest-probability investment opportunities!
“Thus far, the best stock-picking service I’ve seen–and I’ve been doing this for 35+ years! (Gunfighter)
“Stock Waves has produced more gains in the past month(+) than many sites do in years or decades.” (Keto)
“The amount of trades I’ve been able to take resulting in 100%+ returns is nothing short of amazing. If you do not have Stockwaves, you are only doing yourself a disservice.” (dgriff617)
Click here for a FREE TRIAL.


