Summary:
- Recent market concerns have pressured the stock prices of both Johnson & Johnson and Amgen Inc.
- In times of uncertainties, I go back to timeless insights like those offered by Peter Lync on dividend stocks.
- These insights led me to rate JNJ as a strong buy, a well-rounded package featuring yield, dividend consistency/safety, valuation, and effective inventory management.
- These insights also led me to downgrade AMGN to hold.
- It is a solid stock in its own right but falls short on several fronts when compared to JNJ.
Robert Way
JNJ and AMGN stock: previous thesis and Q3 recap
My last article on Johnson & Johnson (NYSE:JNJ) was published back in October 2024. That article was entitled “Johnson & Johnson: You Need To Look At This Chart (Rating Upgrade).” The chart I was referring to was a chart showing JNJ’s current dividend yield among the highest levels in at least 10 years and indicating an unusually attractive valuation. More specifically, I rated the stock as a strong buy based on the argument that:
“the market’s concern over its current issues — which are all temporary in my view — is drastically overblown. The overreaction has created a severe mispricing for this sector leader with superb financial strength and stable growth outlook.”
As for Amgen Inc. (NASDAQ:AMGN), my last article on the ticker was published back in May 2024. That article was entitled “Amgen Stock: Poised To Break Out (Technical Analysis).” As already hinted in the title, the article argued for a buy thesis based on near-term technical trading patterns at that time. Quote:
Amgen Inc. stock is challenging the $320 resistance level after a recent uptrend. Technical indicators suggest short-term upward momentum and strong buying pressure. EPS growth outlook and robust pipeline support the Amgen breakout from a fundamental level.
Since those writings, there have been new developments evolving around both companies. The top 2 issues in my assessment are A) their new quarterly earnings and B) also the outcome of our presidential election (or more precisely, the nomination of Robert F. Kennedy as the next secretary of the Department of Health and Human Services, HHS). Both companies have recently reported their latest quarterly earnings report (for calendar Q3), and the new HHS secretary could impact the healthcare sector in many ways. Many other Seeking Alpha authors have detailed several aspects of these potential impacts.
Bearing what has already been said by other authors in mind, this article concentrates on some aspects less often mentioned, including a comprehensive analysis of their dividend prospects and also their inventory data. I decided to interpret the impacts of these new developments through the eyes of dividends for several reasons. Both JNJ and AMGN have strong (or even remarkable in the case of JNJ) dividend payouts. Both are leaders in the staple healthcare sector. Dividends are an important shareholder return mechanism for both companies and thus, a focus on their dividend prospects can also provide insights into their future return/risk profile.
Before diving into the details, the next chart shows my results for readers who cannot wait. As seen, my assessments show that JNJ is a stronger dividend stock than AMGN. Based on this assessment, this article reiterates my strong buy rating on JNJ and downgrades AMGN from my earlier buy rating to hold.
JNJ vs. AMGN stock: Dividend record
This article follows a comprehensive framework to analyze dividend stocks. The framework is the results of notes compiling from Peter Lynch’s writings. Despite the man’s reputation as a growth investor, he actually touched on many key aspects of dividend/value stocks throughout his writing, ranging from dividend safety, valuation, inventory management, growth, etc. This framework is detailed in my earlier articles, and I will recap on an as-needed basis as we go.
The first step of this framework involves the dividend paying track record, as outlined below. It is the starting point of the framework because dividends only begin to serve as a meaningful indicator of owners’ earnings only for companies with a long track record.
Dividend Track Record: A long history of consistently increasing dividends is highly valued by Lynch. His guides are to look for companies with a track record of stable dividends for at least 20 years.
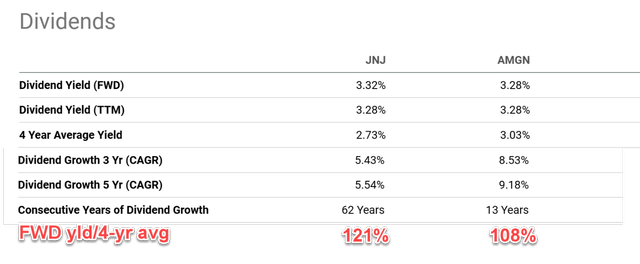
JNJ satisfies the 20-year requirement easily. Actually, its track record exceeds this requirement drastically. As a Dividend King, JNJ has been growing its payouts nonstop for 62 years, as seen in the chart below. In contrast, AMGN has had 14 years – a respectable period — of consecutive dividend increases.
As such, I view JNJ as the undisputed winner on this front.
2. JNJ vs. PEF stock: PEGY ratio and dividend yield
The next step in the frame is valuation. Once the dividend track record is established, I rely on two major indicators for valuation: the PEGY ratio and also the dividend yield. The PEGY ratio is a key insight I first learned from Lynch’s writing, and it immediately made sense for me for the following reasons:
PEG refers to the price-to-earnings growth ratio. He also introduced a modified version of the PEG ratio for dividends stocks. The modified ratio is called the PEGY ratio and is computed as the P/E ratio divided by the sum of the earnings growth rate and dividend yield. The concept is simple yet effective. If the dividends are high enough, investors should not expect (and do not need either) a high growth rate anymore. Just like the PEG ratio, Lynch favors PEGY ratios below 1x.
Under this context, the table below compares the PEGY ratios for JNJ and AMGN. Here, I plugged in the 3-year dividend growth rate from the chart above as their earnings growth rate (and again, the reason is that their dividends are a good indicator of their owners’ earnings). Under this assumption, JNJ’s PEGY ratio is 1.72, higher than AMGN’s 1.19.
However, in terms of dividend yield, as you can recall from the chart above, JNJ’s current FWD yield is about 21% higher than its 4-year average, indicating a 21% valuation discount. In contrast, AMGN’s current FWD yield is about 8% above its historical average, indicating a smaller degree of discount.
Considering A) the mixed signals from the PEGY ratios and dividend yield, and B) both companies are trading discounted, I consider it as a tie on this front and give both stocks 1 point this round.
Source: Author based on Seeking Alpha data Source: Seeking Alpha data

JNJ vs. AMGN: dividend safety
The third step in the framework is dividend safety. All dividend investors reading this must be very proficient in the use of various payout ratios. It is just that the applications of these payout ratios can be messy and ambiguous in practice. As an example, the chart below shows AMGN’s dividend payout ratio to be over 100% based on GAAP EPS, largely due to accounting reasons.
To minimize such accounting ambiguities, I rely more on cash-based payout ratios and also longer-term averages to remove the noises from quarterly volatilities. As the following two charts display, JNJ’s current cash payout ratio is 57%, in contrast to AMGN’s 76%. Furthermore, JNJ’s current cash payout ratio is slightly below its 5-year average of 59.7% as seen. While in contrast, AMGN’s current ratio of 76% is substantially above its 5-year average of 49%.
Hence, I consider JNJ’s dividend safety to be superior, and I give it 1 point in this round.
Source: Seeking Alpha data Source: Seeking Alpha data

JNJ vs. AMGN stock: Share repurchases
The fourth step in the framework is share repurchases. Most dividend investors only pay attention to cash dividends. This is another idea from Lynch’s that is so insightful for the reasons below:
Share buybacks are just as valuable for total returns as cash dividends (even more so if you consider tax implications). Yet, it is overlooked by many dividend investors. Plus, share buybacks are a strong indicator of financial strength (that a company has excess cash flow beyond capital expenditures and dividend obligations) and also management’s confidence in their own business.
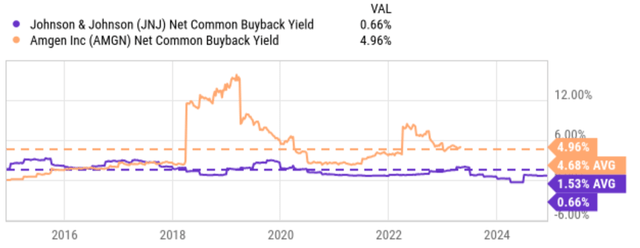
Based on these above considerations, AMGN is the undisputed winner on this front. Both JNJ and AMGN have been consistent buyers of their own stock in the past, as illustrated by the figure below. However, AMGN is just a much larger buyer. JNJ’s net common buyback yield is about 1.53% on average in the past 10 years (a non-negligee yield compared to its 2.7% average dividend yield as aforementioned). AMGN’s buyback yield is just so much higher, on average 4.68% in the past 10 years.
As such, AMGN wins 1 point on this front.
JNJ vs. AMGN stock: inventory management
The final step involves a check on the inventory data following yet another Lynch’s insight:
This is another area most investors overlook yet crucially important and simple to check. As we will see later, Lynch has good reasons and shows a practical approach to using inventories to monitor the health and efficiency of the target business.
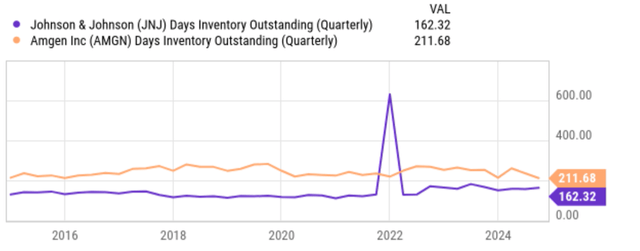
The next chart shows the days of inventory outstanding for JNJ and AMGN. It shows me that JNJ is the clear winner here. Both companies manage their inventories effectively, as reflected in the very stable level of inventory outstanding in the long term. However, JNJ requires a much lower level of inventory (about 162 days currently) to operate its business. In contrast, AMGN’s needs to maintain about 211 days of inventory.
As such, I give JNJ 1 point on this front.
Other risks and final thoughts
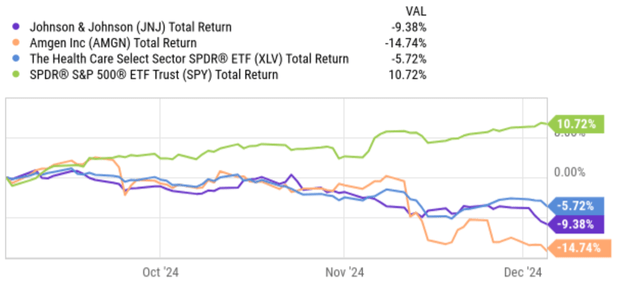
In terms of other risks, as mentioned in the beginning, I consider political/policy issues to be the most salient uncertainties facing both companies. After Donald Trump’s victory in the presidential election, he nominated Robert F. Kennedy Jr. as the next secretary for the Department of Health and Human Services (DHSS). These developments have pressured the stock prices of JNJ, AMGN, and also the broader healthcare sector in general and for good reasons. As an example, the next chart shows the total return for JNJ and AMGN in before and after these developments in comparison to the S&P 500 ETF Trust (SPY) and also the Health Care Select Sector SPDR ETF (XLV). As seen, SPY enjoyed a robust total return of 10.72%, while the XLV sector fund lost 5.72%.
Both JNJ and AMGN have lost even more, with JNJ losing 9.38% and AMGN losing more than 14. Indeed, Kennedy is known for his debatable statements on various healthcare related issues (notably his statements on vaccines). Kennedy’s appointment might continue pressuring the stock prices of both JNJ and AMGN in the near term, and also lead to policy changes that could negatively impact both companies in the long term.
All told, let me conclude with this phrase: dividends don’t lie. For stewards like JNJ, who has been paying/growing dividends for decades, I consider dividends the best window to peer into their future. Dividends, together with inventory data, provide the most direct and least ambiguous financial data in my mind to assess business fundamentals. What I see here shows an attractive and well-rounded investment package in the case of JNJ, as shown in the scorecard below.
Analyst’s Disclosure: I/we have a beneficial long position in the shares of JNJ either through stock ownership, options, or other derivatives. I wrote this article myself, and it expresses my own opinions. I am not receiving compensation for it (other than from Seeking Alpha). I have no business relationship with any company whose stock is mentioned in this article.
Seeking Alpha’s Disclosure: Past performance is no guarantee of future results. No recommendation or advice is being given as to whether any investment is suitable for a particular investor. Any views or opinions expressed above may not reflect those of Seeking Alpha as a whole. Seeking Alpha is not a licensed securities dealer, broker or US investment adviser or investment bank. Our analysts are third party authors that include both professional investors and individual investors who may not be licensed or certified by any institute or regulatory body.
