Summary:
- Johnson & Johnson recently completed the Kenvue spinoff.
- We outline the impacts on its dividend payouts from this spinoff.
- I analyzed its dividend payout both using simple payout ratios and also using a more holistic approach such as the dividend cushion ratio.
- I don’t see negative impacts from the separation.
- I actually see enhanced dividend safety and plenty of room for continued dividend growth.

Justin Sullivan/Getty Images News
Thesis
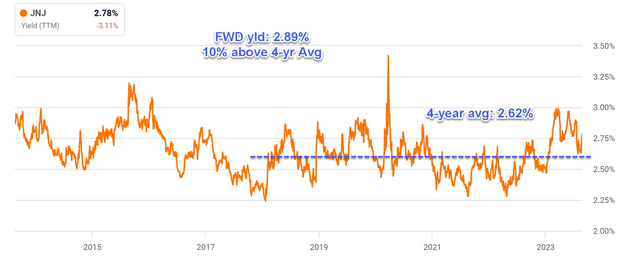
As a quintessential dividend growth stock, Johnson & Johnson (NYSE:JNJ) recently appeared on our radar because its dividend yield has become higher than its historical average by ~10%. To wit, the chart below shows that its current TTM yield (2.78%) is above its four-year historical average (2.62%) by a good margin. In terms of FWD yield (it has declared a $1.19 FWD quarterly payout), it’s yielding 2.89%, ~10% above the historical average.
Author based on Seeking Alpha data
Thus, judging by the above data, the stock is at an attractive valuation. However, given that it just went through a major spinoff, we should evaluate the impact of such a spinoff on its profitability and dividend safety. And this is precisely the goal of this article. In the rest of the article, I will present a pro forma analysis to evaluate the potential impact of the Kenvue separation on JNJ’s dividend growth and safety. You will see that my conclusion is that I not only don’t see negative impacts but also see enhanced dividend safety and continued dividend growth potential.
Kenvue spinoff and payout ratios
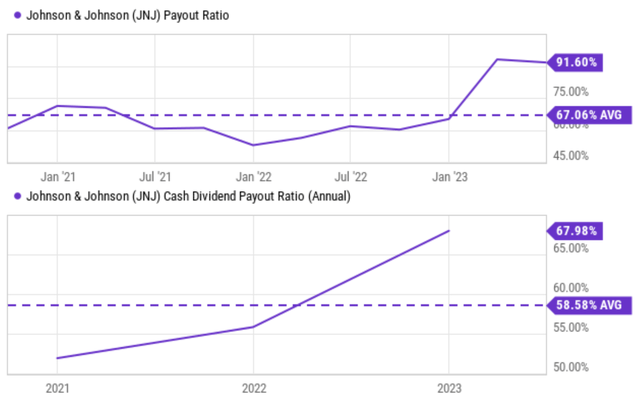
A casual look at the payout ratios may seem alarming as shown in the next chart below. Both earnings payout ratios and the cash flow ratios seem to be rising sharply following the spinoff. However, there’s no need to be alarmed as such an apparent surge is largely the result of accounting distortions in my view. A more careful look shows the opposite picture.
Seeking Alpha data
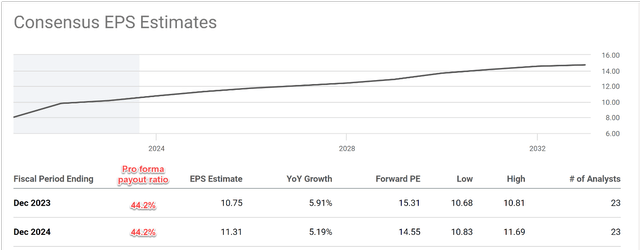
The next chart shows my pro forma analysis of its payout ratios based on consensus estimates after the spinoff. As mentioned earlier, JNJ had just declared a $1.19 per share quarterly dividend payout. Combined with a consensus estimate of $10.75 EPS for 2023, its FY1 earning payout ratio would be 44.2%, actually substantially below the historical average. Looking further out to 2024, assuming a 5% dividend growth rate (which is consistent with its historical growth rates), its FY1 earnings payout ratio would also be 44.2%.
Author based on Seeking Alpha data
Dividend cushion ratios
For readers familiar with our approach, you know that we always read the above payout ratios with a grain of salt because of their limitations (see my earlier article). To overcome these limitations, here I will present a more holistic dividend cushion ratio analysis. The concept is detailed in Brian Nelson’s book entitled Value Trap. A recap is provided here for ease of reference.
The Dividend Cushion measure is a ratio that sums the existing net cash (total cash less total long-term debt) a company has on hand (on its balance sheet) plus its expected future free cash flows (cash from operations less all capital expenditures) over the next five years and divides that sum by future expected cash dividends (including expected growth in them, where applicable) over the same time period. If the ratio is significantly above 1, the company generally has sufficient financial capacity to pay out its expected future dividends, by our estimates. The higher the ratio, the better, all else equal.
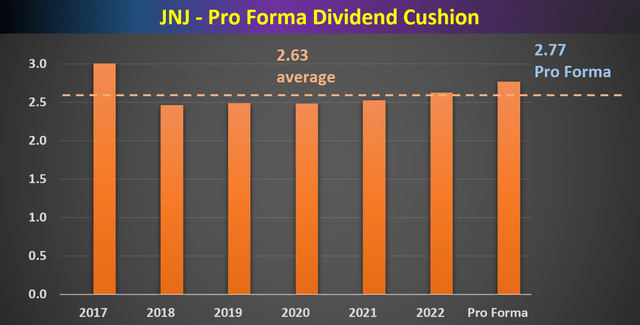
The dividend cushion ratios (“DCR”) for JNJ over recent years are shown in the next chart, together with my pro forma estimate for 2023 after the spinoff. As seen, JNJ has been maintaining a DCR far above the 1x threshold over the years. Its DCR has been averaging 2.63x since 2017. After the Kenvue spinoff, my estimate of its DCR would actually be even higher both than the 2022 level and the historical average, suggesting enhanced safety and plenty of potential for further dividend growth.
The underlying reasons for such enhanced safety are mainly twofold in my view. First, I expect its other sectors to report robust profits, sufficient to offset the impact of the spinoff. For example, the MedTech segment revenues have been reporting double-digit growth YoY. The uptake of recently launched products and the Abiomed acquisition also would contribute. I also expect a margin expansion because I consider the COVID-19 supply-network-related costs will renormalize going forward. Secondly, the Kenvue spinoff helped to strengthen JNJ’s already strong financial position. To wit, Kenvue paid $13.2 billion to JNJ from the net proceeds of its IPO, a sizable boost to JNJ’s balance sheet and capital allocation flexibility.
Author based on Seeking Alpha data
Valuation and Projected Returns
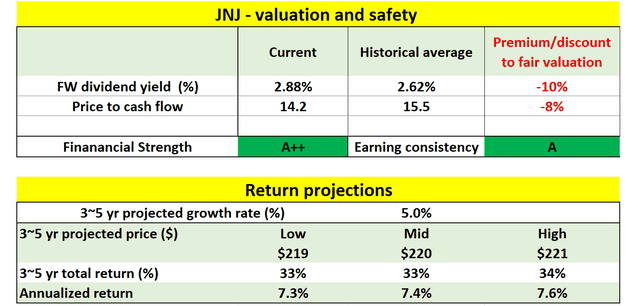
As aforementioned, given its current price and profitability, JNJ is discounted by about 10% judging by its FWD dividend yield. Other valuation metrics show a similar valuation discount. For example, its P/cash flow multiple is around 14.2x on an FWD basis. This is an ~8% discount compared to its historical average of 15.5x. For the next 3~5 years, I’m projecting a 5% EPS growth given its strong ROCE (around 50% on average) and reinvestment rate (around 10% on average). Based on this growth rate and the valuation discount, the total return potential ratio in the next 3~5 years is projected to be about 33%. I consider this as a very favorable return/risk profile considering the margin of safety created by the valuation discounts, the superb financial safety, and also the excellent earning consistency.
Author
Risks and final thoughts
There are a few risks worth mentioning here. JNJ faces some macroeconomic risks due to the uncertainties of global procedure growth and also the pace of recovery in China given its global reach. Also due to its global reach, JNJ faces currency exchange uncertainties. In recent quarters, such currency exchange headwinds have negatively impacted its earnings in the range of ~0.7% to 2.3% for its different segments.
However, overall, I see a stable profitability and growth path ahead. In particular, this article examined its profitability and growth through its dividends – a very reliable indicator of its true owner’s earnings in my view given its remarkable dividend track record. My results show that there is plenty of room for continued growth ahead thanks to its consistent profitability and superb financial flexibility.
Analyst’s Disclosure: I/we have no stock, option or similar derivative position in any of the companies mentioned, and no plans to initiate any such positions within the next 72 hours. I wrote this article myself, and it expresses my own opinions. I am not receiving compensation for it (other than from Seeking Alpha). I have no business relationship with any company whose stock is mentioned in this article.
Seeking Alpha’s Disclosure: Past performance is no guarantee of future results. No recommendation or advice is being given as to whether any investment is suitable for a particular investor. Any views or opinions expressed above may not reflect those of Seeking Alpha as a whole. Seeking Alpha is not a licensed securities dealer, broker or US investment adviser or investment bank. Our analysts are third party authors that include both professional investors and individual investors who may not be licensed or certified by any institute or regulatory body.
As you can tell, our core style is to provide actionable and unambiguous ideas from our independent research. If your share this investment style, check out Envision Early Retirement. It provides at least 1x in-depth articles per week on such ideas.
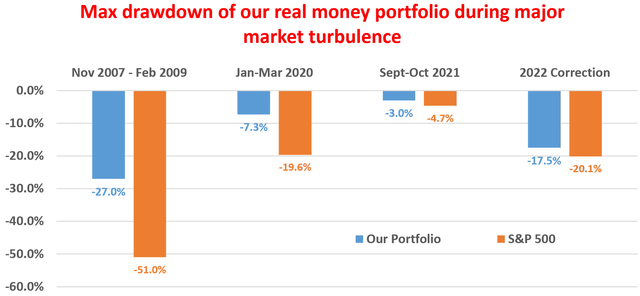
We have helped our members not only to beat S&P 500 but also avoid heavy drawdowns despite the extreme volatilities in BOTH the equity AND bond market.
Join for a 100% Risk-Free trial and see if our proven method can help you too.
