Summary:
- Johnson & Johnson stock prices have been consistently declining in the recent 1~2 years.
- The stock is currently undervalued, with lower P/E ratios compared to the sector median and historical averages, and a high dividend yield.
- Yet, Johnson & Johnson’s profitability remains strong, and there are potential catalysts for growth, including the adoption of new products and potential acquisitions.
- The contrast of value compression and robust profitability has created a very asymmetrical return/risk ratio.
Wachiwit
JNJ stock has been under selling pressure
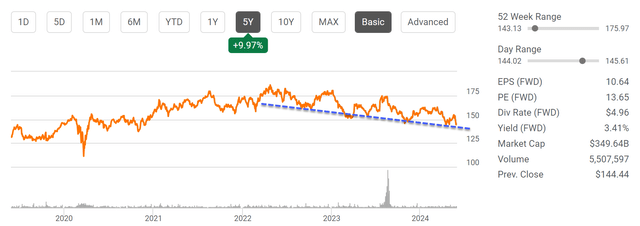
Johnson & Johnson (NYSE:JNJ) stock prices have been trending down lately due to large selling pressure. As illustrated by the chart below, after reaching an all-time high in early 2022, the stock has been making lower highs and lower lows. Currently, the stock trades near a 52-week low price and a FWD P/E of 13.65x only.
The market certainly has its reasons for the selloff. Similar to its other peers in the sector, the company has no lack of lawsuits and patent expirations. The most recent case involves the following talc-related bankruptcy filings (with emphasis added by me):
A group of plaintiffs who claim to have become cancer victims after using Johnson & Johnson’s (JNJ) talc-based baby powder has filed a lawsuit accusing the company of fraudulently resorting to bankruptcy filings to resolve thousands of similar claims. Five litigants representing over 50,000 individuals who have sued J&J (JNJ) over talc-related cancer claims filed the proposed class action lawsuit in New Jersey federal court on Wednesday.
Given the larger number of individuals involved, this case could have a large impact on JNJ. At the same, JNJ is facing a major patent expiration in 2023 for its Stelara drug, a treatment for Crohn’s disease and psoriasis. Finally, I am also seeing signs of softening sales of its COVID-19 vaccines and high operating costs (especially selling and marketing costs).
Against this background, the thesis of this article, however, is to argue that the market has overreacted to these headwinds. These headwinds are ultimately temporary in my view. The current valuation compression is so extreme that it has largely neglected the positives and thus created a skewed reward/risk profile, as detailed next.
JNJ stock’s valuation discount is too large
The next chart below summarizes JNJ stock’s valuation grade relative to the sector median and its 5-year average levels. As you can see, JNJ’s current P/E ratios (both trailing and forward) are lower than both the sector median and its 5-year average by a sizable margin. For instance, its trailing non-GAAP P/E of 13.89x is 28.38% lower than the sector median of 19.39x, and 18.22% lower than its 5-year average of 16.98. The forward P/E (FWD) of 13.65x is even lower, almost 30% below the sector median and 18% lower than its 5-year average.
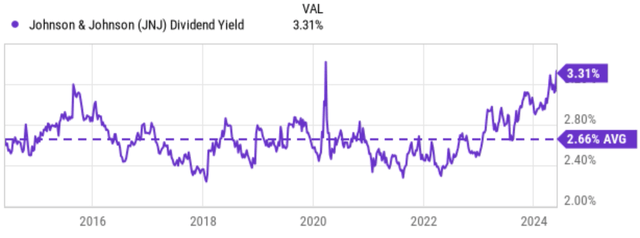
As a quintessential dividend growth stock, I think its dividend yields serve as a more reliable metric for its valuation in the long term. And this metric suggests even more extreme valuation compression than the P/E metric discussed above. The next chart below shows JNJ’s dividend yield compared to its historical average in the past 10 years. As seen, JNJ’s current dividend yield of 3.31% is not only far above its 10-year historical average of 2.66% but also near the highest levels in this period.
JNJ stock: yet profitability is superb
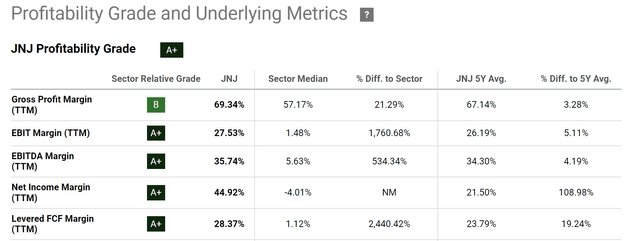
The above valuation compression would make sense if the headwinds mentioned above have demonstrated a material impact on JNJ’s profitability. But this is not the case at all, judging by JNJ’s profitability data. For example, sure, the table below shows JNJ’s profitability metrics relative to the sector median and its 5-year average levels. As seen, JNJ’s profitability is significantly higher than the sector median across almost all metrics, and also noticeably better than its own historical averages. For example, in terms of top-line metrics, JNJ’s gross profit margin (TTM) of 69.34% is 21.29% higher than the sector median of 57.17% and also about 3.28% higher than its 5-year average. In terms of bottom-line metrics (such as net income margin), the comparison is even more in JNJ’s favor.
Looking ahead, I see plenty of catalysts that could help JNJ maintain its superb profitability and drive growth. First, I anticipate its Innovative Medicine continues to grow at a healthy pace, primarily driven by momentum from key brands and the adoption of new products including those that treat multiple myeloma, plaque psoriasis, prostate cancer, and depression. In Med-Tech, I expect the advancement to continue on several of its key programs, including pulsed-field ablation, Abiomed (which makes temporary external and implantable mechanical circulatory support devices), and surgical robotics.
Finally, I also expect JNJ to be active on the acquisition front and augment its growth curve by bolt-on acquisition. As a notable example, it recently acquired Ambrx to help develop targeted oncology therapeutics. At the same time, I think JNJ is also poised to acquire Shockwave Medical to strengthen its cardiovascular business.
Other risks and final thoughts
In terms of downside risks, beyond those discussed earlier, one more potential risk involves the impact of the Kenvue separation on its dividend. As aforementioned, JNJ is one of the most quintessential dividend growth stocks. Therefore, I expect the dividend payouts and growth rates to have a large impact on the market sentiment.
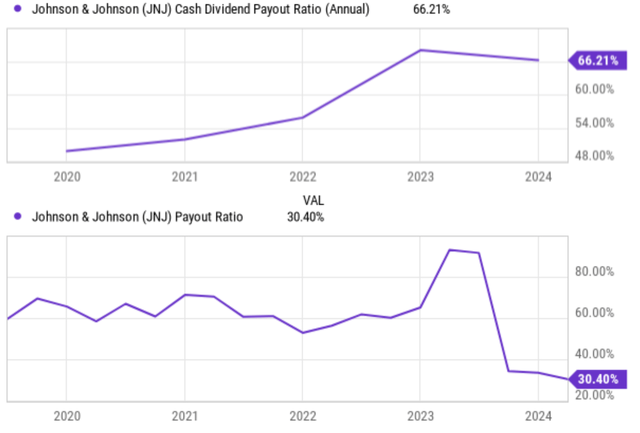
The payout ratios, both in terms of EPS payout ratio and cash payout, did show significant increases shortly after the spinoff as seen in the chart below. Such increased payout ratios could limit the payout growth. However, the payout ratios are nowhere near alarming levels in my view, and they are showing signs of renormalization. For example, the cash payout ratio has retreated from the peak level observed in late 2022 to the current level of 66% already.
JNJ had just declared another dividend increase from $1.19 per share (on a quarterly) to $1.24 per share. Thus, the annualized FWD payout is $4.96 per share. The consensus estimates for its FY 2024 earnings point to an EPS of $10.64. Therefore, its FWD EPS payout ratio is about 46.6%, which is actually lower than the average level before the Kenvue separation as seen.
To reiterate, the thesis of this article is that the market has overreacted to the temporary headwinds facing JNJ. The overreaction has led to severe valuation compression that is too large to ignore, especially when its profitability is considered. The company’s low P/E ratio of 13.89x is at a substantial discount compared to the sector average and also its historical levels. Its dividend yield of 3.31% is among the highest levels in at least 10 years, indicating a very attractive entry point.
Certainly, the downside risks from patent expirations and legal issues should not be ignored, and their impacts could be considerable. However, I think the Johnson & Johnson positives (such as valuation, strong pipeline with promising new drugs and medical devices, strong financial strength, etc.) far outweigh these negatives.
Analyst’s Disclosure: I/we have no stock, option or similar derivative position in any of the companies mentioned, and no plans to initiate any such positions within the next 72 hours. I wrote this article myself, and it expresses my own opinions. I am not receiving compensation for it (other than from Seeking Alpha). I have no business relationship with any company whose stock is mentioned in this article.
Seeking Alpha’s Disclosure: Past performance is no guarantee of future results. No recommendation or advice is being given as to whether any investment is suitable for a particular investor. Any views or opinions expressed above may not reflect those of Seeking Alpha as a whole. Seeking Alpha is not a licensed securities dealer, broker or US investment adviser or investment bank. Our analysts are third party authors that include both professional investors and individual investors who may not be licensed or certified by any institute or regulatory body.
As you can tell, our core style is to provide actionable and unambiguous ideas from our independent research. If your share this investment style, check out Envision Early Retirement. It provides at least 1x in-depth articles per week on such ideas.
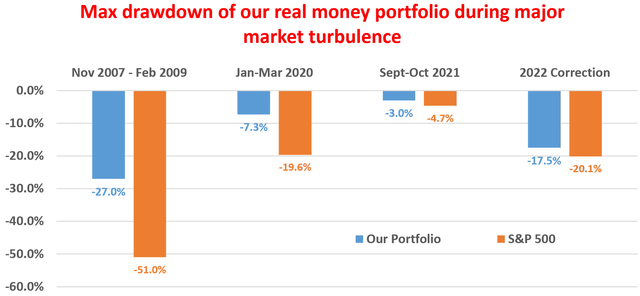
We have helped our members not only to beat S&P 500 but also avoid heavy drawdowns despite the extreme volatilities in BOTH the equity AND bond market.
Join for a 100% Risk-Free trial and see if our proven method can help you too.
