Summary:
- Johnson & Johnson will announce its Q2 2024 results on Wednesday, July 17 before the market opens.
- In this update, I share what to expect from JNJ’s Q2 results and put previous results into perspective.
- In the main part of the article, I will take a close look at JNJ’s earnings adjustments, amid the significant deviation from GAAP earnings (+46% median since 2014).
- I discuss what I believe may be inappropriate earnings adjustments related to JNJ’s COVID-19 vaccine and restructuring costs.
- I also point out an important metric in connection with JNJ’s somewhat weak pipeline at the moment.

MEDITERRANEAN/iStock Unreleased via Getty Images
Introduction
Pharmaceutical and medical devices giant Johnson & Johnson (NYSE:JNJ) will release its second quarter results on Wednesday, July 17 at 8:30 a.m. Eastern Time. While in my last article I previewed the first quarter results and shared my view on the then-announced acquisition of Shockwave Medical, Inc., the topic of this earnings preview focuses on JNJ’s earnings quality.
Johnson & Johnson is known for its clockwork-like track record, meeting analysts’ estimates with a high degree of accuracy. As a critical investor, one is quick to hypothesize about – possibly inappropriate – earnings adjustments. Considering the fact that Johnson & Johnson’s reported earnings deviate significantly from the GAAP figures (median of +46% over the last ten years, not a single negative deviation), there may be something to this hypothesis.
In this update, therefore, in addition to an earnings preview, I take a look at the years with the most significant earnings adjustments and give my view on whether I would personally include them in my assessment of the company’s earnings power and the valuation of JNJ stock.
What To Expect From Q2 Earnings And How Were Johnson & Johnson’s Previous Earnings?
For the second quarter of 2024, analysts currently expect JNJ to report adjusted earnings per share (EPS) of $2.69, or 3.9% lower than a year ago. Earnings revisions to the quarterly consensus have been insignificant over the past six months, as expected for JNJ. For the full year, analysts model adjusted EPS of $10.54, up 6.3% year-over-year and placing JNJ stock at a compelling forward P/E ratio of 14.2. Given the solid growth expectation, I would not over-interpret the weakness in the second quarter, especially in light of the fact that JNJ management itself has issued a slightly higher midpoint guidance of $10.65 (+7.4% year-over-year)
As it has been a while since the split-off of the consumer healthcare division Kenvue Inc. (KVUE, a company I also cover here on Seeking Alpha), fears that the company may no longer be well diversified emerged. However, as I explained in another article, I personally do not believe the level of diversification is materially impaired. However, the volatility of earnings and cash flow has benefited from the original three-pronged approach, and this may be one reason for the slight decline in the quarterly EPS surprise (Figure 1).
Of course, considering that JNJ’s EPS surprise averaged only +0.44% on an annualized basis when looking at the last 16 years, with no significant trend observable, it’s quite possible that I’m reading tea leaves here.
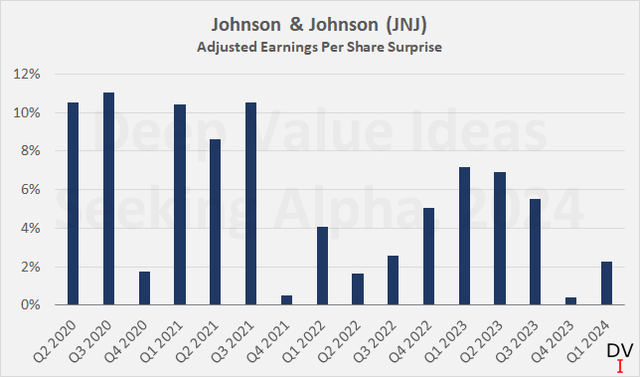
Figure 1: Johnson & Johnson (JNJ): Adjusted earnings per share surprise on a quarterly basis (own work, data from Seeking Alpha)
I think we should not focus on such short-term effects and instead appreciate the fact that JNJ has a remarkably strong track record of delivering EPS in line with estimates, even on a two-year forward basis (Figure 2). However, it could be argued that the company is simply adjusting its results to keep Wall Street satisfied. Let us therefore now take a closer look at JNJ’s earnings quality and the extent of the EPS adjustments.
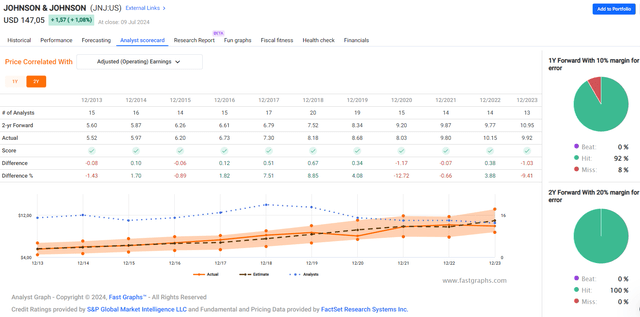
Figure 2: Johnson & Johnson (JNJ): Analyst scorecard on a two-year-forward basis (FAST Graphs)
A Close Look At JNJ’s Earnings Adjustments
Figure 3, which compares JNJ’s reported and adjusted EPS on an annual basis, reveals that significant adjustments are the rule rather than the exception. Over the last ten years, the median adjusted EPS has been 46% higher than reported EPS. The average deviation has been even higher, but I do not consider the use of the arithmetic mean appropriate here due to the non-meaningful deviation in 2017 of 1,453%.
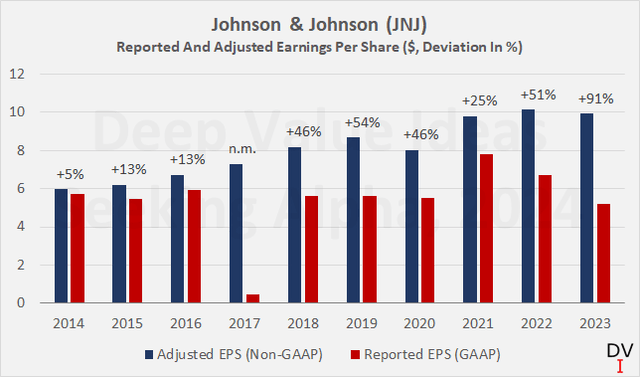
Figure 3: Johnson & Johnson (JNJ): Reported and adjusted earnings per share on an annual basis (own work, based on company filings)
I believe it would be too extensive to detail in this update all the adjustments made by JNJ’s management over the last ten years. Therefore, and also because of the recurring nature of several adjustment positions, I would like to focus on the adjustments made in the years with the largest difference between GAAP and non-GAAP, namely 2023 (+91%), 2022 (+51%), 2019 (+54%) and 2017 (+1,453%).
A reconciliation of JNJ’s non-GAAP pre-tax earnings for 2023 can be found on page 10 of the quarterly and annual results presentation, and the factors contributing to the $14.7 billion pre-tax adjustment are shown in Figure 4. Please note that the data relates to earnings from continuing operations and therefore does not include the impact of the Kenvue separation ($21.0 billion pre-tax earnings, non-cash, p. 103 2023 10-K ).
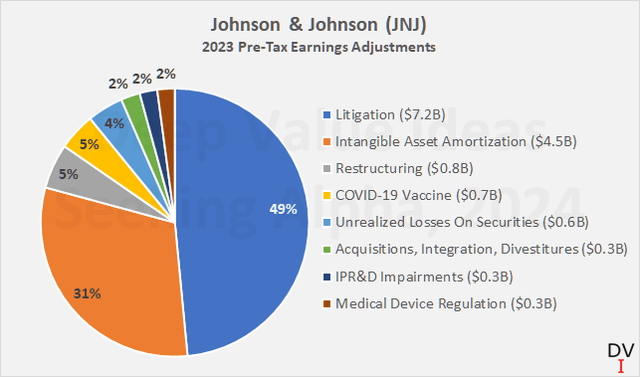
Figure 4: Johnson & Johnson (JNJ): Adjustments to 2023 pre-tax earnings from continuing operations (own work, based on company filings)
The adjustments related to litigation account for almost 50% of the total adjustment in 2023. In my opinion, this is a reasonable adjustment considering the expected nature of the settlement (latest news about JNJ’s talc lawsuit here). Of course, one could argue that litigation is a “cost of doing business” for a healthcare company, but I think that should be factored into the valuation, for example by using a slightly higher discount rate in a discounted cash flow valuation. As an aside, in another article I discussed the expected impact of the talc litigation and why I believe it has a negligible impact on the value of JNJ stock.
Amortization of intangible assets of $4.5 billion was also a significant contributor, and, according to Note 5 of JNJ’s 2023 10-K (p. 58), largely stemmed from the amortization of patents and trademarks with definite lives. It is of course impossible to quantify the percentage of internally generated patents and trademarks, which could indirectly indicate a percentage of intangible assets acquired at a potentially inflated cost. In this context, it should also be noted that the $4.5 billion is not attributable to impairments. This, and the fact that no goodwill-related impairment charges were recognized in 2023 (which does not amortize per se) also underscores that management is conducting proper due diligence and valuation of the to-be-acquired assets.
However, when analyzing JNJ’s intangible asset amortization expenses, management’s estimate of amortization expense for approved products in the coming years caught my attention. In my view, a company with a solid pipeline should have a more or less stable amortization schedule. While this was definitely the case for JNJ in previous years (far left group in Figure 5, 2019), it becomes evident that management expects an increasingly lower amortization expense over the years, especially in 2027 and 2028 (yellow and medium blue bars in the far right group in Figure 5).
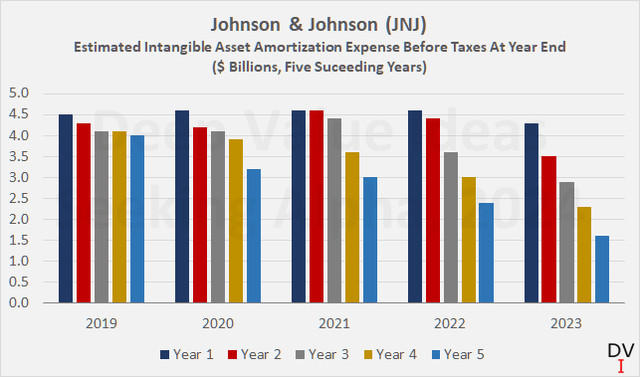
Figure 5: Johnson & Johnson (JNJ): Estimated intangible asset amortization expense before taxes between year-end 2019 and 2023 for the respective five succeeding years (own work, based on company filings)
While the decline, especially according to the 2023 10-K, is to some extent due to the split-off of Kenvue (the corresponding data for 2024 – 2028 only include Innovative Medicine and MedTech), I think this is a good indication that JNJ’s pipeline is relatively weak at the moment (see my last article on JNJ), but I believe this is adequately reflected in the share price.
Of course, this metric may improve quickly with the approval of new pharmaceuticals and medical devices, but it is definitely important to keep an eye on the expected amortization of intangible assets, in my opinion. To be fair, however, it should be borne in mind that JNJ did not provide any detailed information on the expected amortization of intangible assets before 2019. Instead, the company only provided an average value for the five subsequent years, which meant that a possible decline in later years could not be identified.
In addition to these two main drivers of the earnings adjustments (which together account for around 80% of the total pre-tax adjustment in 2023), restructuring costs, COVID-19 vaccine costs and securities losses were the other major items.
Adjusting for COVID-19 vaccine costs – which were quite pronounced in 2022 ($1.5 billion) and 2023 ($663 million) – is incomprehensible to me. For example, if we take JNJ’s 2023 pre-tax income from continuing operations of $15.1 billion and divide it by the stated margin of 17.7%, we arrive at total sales for 2023 of $85.2 billion. Knowing that this figure includes sales of the COVID-19 vaccine of $1.1 billion ($2.2 billion in 2022, p. 18 of this report), it becomes clear that JNJ considers the vaccine as “continuing operations”. In light of this, I deem it somewhat inappropriate to adjust EPS for the related costs, which include “remaining commitments and obligations, including external manufacturing network exit costs and required clinical trial expenses, associated with the Company’s completion of its COVID-19 vaccine contractual commitments.” – despite the fact that their inclusion would have reduced earnings before taxes by only 2.6% and 6.2% in 2023 and 2022, respectively.
Finally, JNJ reported unrealized losses on securities of $641 million and $690 million in 2023 and 2022, respectively. In 2021, the company reported a corresponding gain of $0.5 billion.
Knowing that JNJ holds a more or less large position in investment securities (see e.g. p. 56 of the 2023 10-K), it seems likely that part of the change in fair value is due to the higher interest rate environment and therefore represents paper losses that are not expected to be realized. However, at the end of 2023, JNJ had only $1.07 billion of marketable securities on its balance sheet (about $8.3 billion less than a year ago), so the impact of the change in fair value of these assets was definitely insignificant.
Instead, the main reason for the decline in fair value in 2023 is JNJ’s investment in Idorsia (OTC:IDRSF), a pharmaceutical research company in Switzerland. Idorsia was spun out of Actelion Ltd., after the latter has been acquired by JNJ for $30 billion in 2017. Idorsia’s performance to date has been extremely poor – the stock has lost around 90% since its debut.
Although the poor performance of Idorsia’s stock implies that JNJ is carrying significant risk here, this is definitely not the case. JNJ sold its 8.3% direct stake back in 2020 (p. 83, 2020 10-K) at a price of CHF 28.55 per share, approximately 15% below the all-time high and well above the price at the start of trading on the Swiss stock exchange (approx. CHF 15). The transaction resulted in gross proceeds of approximately $357 million and to date JNJ retains a convertible loan of approximately 20% of Idorsia’s equity which matures in 2027. Should JNJ ever decide to sell its stake in Idorsia, and assuming the share price does not recover, the negative impact on the bottom line will be insignificant due to the significant revaluation already recognized due to fair value accounting.
The other significant contribution to this item is due to the decline in the share price of Kenvue, in which JNJ still held a small stake at the end of 2023 but recently announced its intention to sell it. Adjusting EPS for the change in fair value of such investments is, in my view, understandable and does not indicate a smoothing/inflating of earnings.
Finally, restructuring-related charges added back to earnings before tax are another item worth mentioning, mainly because it is a recurring adjustment. The rationale for the decision to adjust for these expenses (see footnote 2 on p. 10 of this document) is plausible in my opinion. Due to the recurring nature of the adjustment and given that JNJ’s business model is focused on continuous portfolio transformation and optimization, I would personally add the related expenses back to adjusted EPS. However, the impact of restructuring on pre-tax earnings has only been between 1.6% and 3.1% over the last six years. Nevertheless, I consider this adjustment to be unreasonable, similar to the COVID-19 vaccine-related costs that were excluded from adjusted earnings.
The main earnings adjustments in 2022, 2019 and 2017 largely related to the same items as in 2023. Amortization of intangible assets, litigation and restructuring together accounted for 56%, 87%, and 65% of the total pre-tax adjustments shown below. As illustrated in Figures 6, 7, and 8, other notable adjustments relate to acquisitions but are largely insignificant. In my opinion, the adjustment for non-recurring costs related to acquisitions is debatable, as JNJ’s business model relies significantly on growth through acquisitions. However, due to the low proportion of such costs, I do not consider the acquisition-related adjustments to be worthy of further discussion.
Finally, it should be noted that the adjustments relate to earnings before tax, which is why the “elephant in the room”, which resulted in GAAP EPS of just $0.47 in 2017 (compared to adjusted EPS of $7.3), is not included. Longer-term investors may remember the Tax Cuts and Jobs Act, which went into effect on January 1, 2018. The table on p. 55 in JNJ’s 2017 10-K details the provision for income taxes recognized at year-end, according to which the adjustment to EPS in this regard is generally understandable. However, considering that, for example, the U.S. tax (estimated at $10.1 billion at the time) is payable over eight years, I would have understood an adjustment for a portion of the tax payable, but not for the entire position.
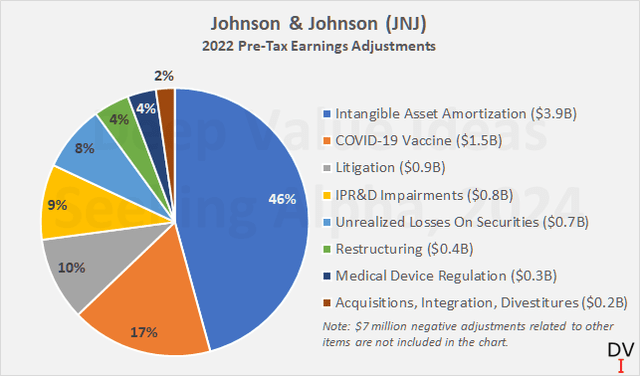
Figure 6: Johnson & Johnson (JNJ): Adjustments to 2022 earnings before taxes (own work, based on company filings)
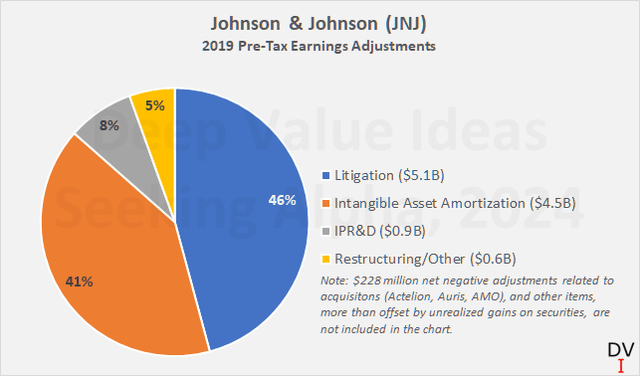
Figure 7: Johnson & Johnson (JNJ): Adjustments to 2019 earnings before taxes (own work, based on company filings)
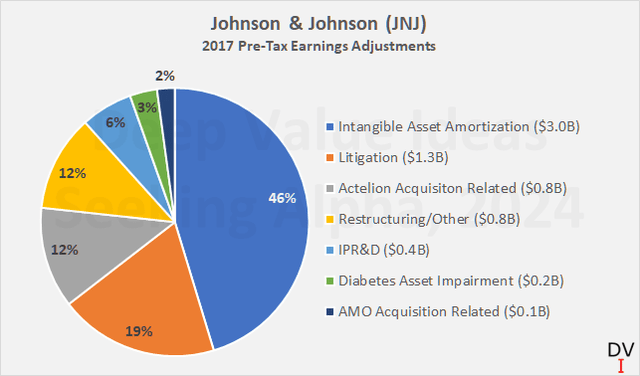
Figure 8: Johnson & Johnson (JNJ): Adjustments to 2017 earnings before taxes (own work, based on company filings)
Summary And Conclusion – Are The Significant And Recurring Earnings Adjustments A Cause For Concern?
Johnson & Johnson will announce its results for the second quarter of 2024 on Wednesday at 8:30 AM Eastern Time. Analysts currently expect the healthcare giant to report adjusted earnings per share of $2.69 (-3.9% year-over-year). For the full year, analysts are slightly more conservative than JNJ’s management, which recently reiterated its midpoint guidance for adjusted EPS of $10.65, representing 7.4% year-over-year growth. In any case, investors should not focus too much on the near-term decline in EPS and instead appreciate the fact that JNJ has mostly met analysts’ estimates over the past decade, even on a two-year forward basis.
However, as a critical investor and in an effort to “invert, always invert” (to quote the late Charlie Munger), it cannot be ruled out that the stellar track record is at least partially due to earnings management. Of course, I’m not suggesting that JNJ’s management is intentionally adjusting EPS to please Wall Street, but the fact that GAAP and adjusted EPS have diverged by about 46% over the past decade (median) definitely warrants a closer look.
As discussed in this article, most of the adjustments relate to the talc litigation and the amortization of intangible assets such as patents and trademarks. In my opinion, these adjustments are reasonable, although one could argue that a portion of the litigation costs could be considered a “cost of doing business”. I personally account for this aspect by a slightly increased discount factor in the corresponding discounted cash flow valuation.
In the context of intangible asset amortization, the increasingly significant decline in estimated amortization expense for the five subsequent years underlines JNJ’s somewhat weak outlook, but is of course partly due to the split-off of Kenvue and related assets. Still, I think it’s prudent to keep an eye on this metric, as it could point to a recovery (or weakening) in the healthcare giant’s earnings power.
JNJ includes sales related to its COVID-19 vaccine in continuing operations but does not include the associated costs in EPS – an adjustment I cannot comprehend. Similarly, and knowing that JNJ engages in more or less significant acquisitions, divestitures and portfolio optimizations, I would personally include restructuring-related charges in the EPS numbers.
On a positive note, unlike many companies in the information technology sector, JNJ does not exclude stock-based compensation from EPS. At approximately $1.1 billion annually, such an adjustment would represent a significant boost to EPS. With that in mind, and considering the comparatively small impact of the adjustments related to the COVID-19 vaccine and restructuring, I think it would be a stretch to conclude that JNJ’s management adjusts EPS to mask otherwise poor results. Overall, the somewhat unreasonable adjustments would hurt earnings per share by a few percentage points and therefore have no material impact on the valuation of JNJ stock (valuation in my previous article).
Finally, the company’s reliably strong balance sheet and top-notch credit rating (Aaa with stable outlook, even after the Kenvue split-off) are important indicators that the earnings adjustments are unlikely to be the result of deeper issues. If JNJ were indeed struggling and unable to grow (as GAAP earnings suggest), how is it that the company’s net debt and leverage have remained remarkably robust over the years?
Thank you very much for reading my latest article. Whether you agree or disagree with my conclusions, I always welcome your opinion and feedback in the comments below. And if there’s anything I should improve or expand on in future articles, drop me a line as well. As always, please consider this article only as a first step in your own due diligence.
Editor’s Note: This article discusses one or more securities that do not trade on a major U.S. exchange. Please be aware of the risks associated with these stocks.
Analyst’s Disclosure: I/we have a beneficial long position in the shares of JNJ either through stock ownership, options, or other derivatives. I wrote this article myself, and it expresses my own opinions. I am not receiving compensation for it (other than from Seeking Alpha). I have no business relationship with any company whose stock is mentioned in this article.
The contents of this article, my previous articles, and my comments are for informational purposes only and may not be considered investment and/or tax advice. I am a private investor from Europe and share my investing journey here on Seeking Alpha. I am neither a licensed investment advisor nor a licensed tax advisor. Furthermore, I am not an expert on taxes and related laws – neither in relation to the U.S. nor other geographies/jurisdictions. It is not my intention to give financial and/or tax advice, and I am in no way qualified to do so. Although I do my best to make sure that what I write is accurate and well researched, I cannot be held responsible and accept no liability whatsoever for any errors, omissions, or for consequences resulting from the enclosed information. The writing reflects my personal opinion at the time of writing. If you intend to invest in the stocks or other investment vehicles mentioned in this article – or in any investment vehicle generally – please consult your licensed investment advisor. If uncertain about tax-related implications, please consult your licensed tax advisor.
Seeking Alpha’s Disclosure: Past performance is no guarantee of future results. No recommendation or advice is being given as to whether any investment is suitable for a particular investor. Any views or opinions expressed above may not reflect those of Seeking Alpha as a whole. Seeking Alpha is not a licensed securities dealer, broker or US investment adviser or investment bank. Our analysts are third party authors that include both professional investors and individual investors who may not be licensed or certified by any institute or regulatory body.
