Summary:
- Johnson & Johnson reported mediocre results for fiscal 2022, but is expecting low-to-mid single digit growth for fiscal 2023.
- The company is facing a patent cliff and might have trouble in the next few years to replace these sales with new products.
- Johnson & Johnson is also trying to grow by acquisitions and recently acquired Abiomed.
- I still don’t see Johnson & Johnson as a good investment.
Mario Tama
Johnson & Johnson (NYSE:JNJ) remains as one of the more expensive pharmaceutical companies – at least among the major players in the industry which I have covered so far on Seeking Alpha. Of course, companies like Novo Nordisk (NVO) or Eli Lilly (LLY) are trading for much higher valuation multiples, but peers like Amgen (AMGN), Gilead Sciences (GILD), AbbVie (ABBV) or Bristol-Myers Squibb (BMY) are trading for half the company’s price-free-cash-flow ratio.
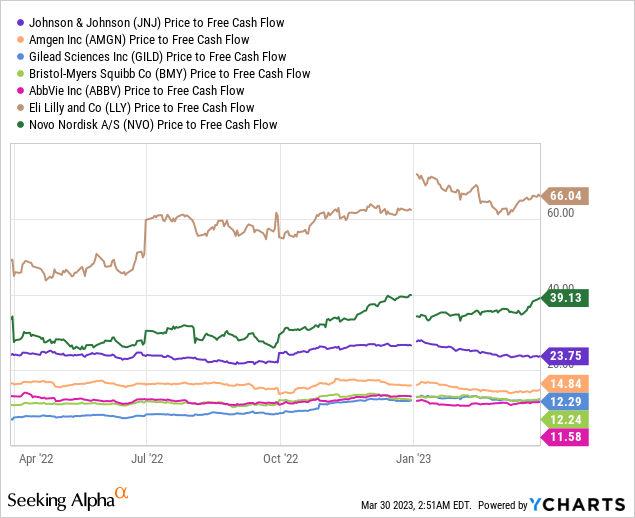
When comparing Johnson & Johnson to its peers – and in this case focusing on pharmaceutical companies – we should not ignore that pharmaceuticals are only one part of Johnson & Johnson’s business. The company is also generating about 30% of its revenue from medical devices and peers in that segment are usually trading for higher valuation multiples.
In my last article, which was published a little more than a year ago, I called Johnson & Johnson still a bit too expensive and since then the stock declined about 11% – and underperformed the S&P 500, which declined about 4%. And as the combination of a lower stock price and improving business could make the stock fairly valued (or even undervalued), let’s see if Johnson & Johnson improved its business further.
Annual Results
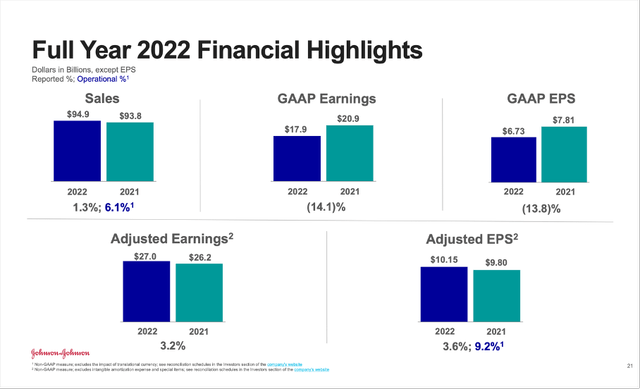
When trying to answer that question we can start by looking at the last annual results the company reported recently for fiscal 2022. Johnson & Johnson generated $94,943 million in sales and compared to $93,775 million in the previous year this is a slight increase of 1.2% year-over-year. Of course, we must point out that currency effects had a negative impact on the top line and excluding those negative effects, revenue would have increased 6.1% year-over-year. But when looking at earnings per share, we see a 13.8% year-over-year decline from $7.81 in fiscal 2021 to $6.73 in fiscal 2022.
Only when looking at adjusted earnings per share, we see an increase from $9.80 in fiscal 2021 to $10.15 in fiscal 2022 – resulting in 3.6% year-over-year (with operational growth at 9.2%).
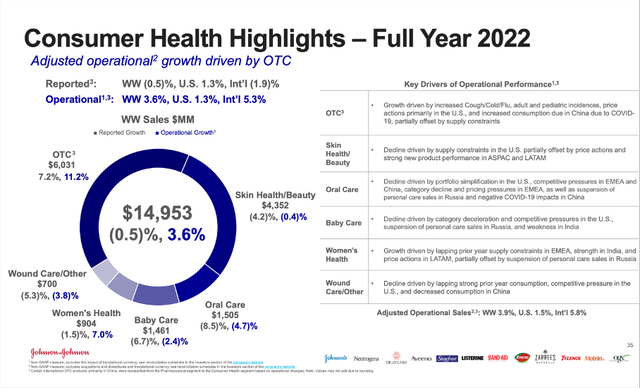
When looking at the different segments, “Consumer Health” reported a slightly declining revenue – from $15,035 million in the previous year to $14,953 million in fiscal 2022. While this resulted in a 0.5% reported decline, adjusted operating growth was 3.6% – driven especially by OTC (over the counter).
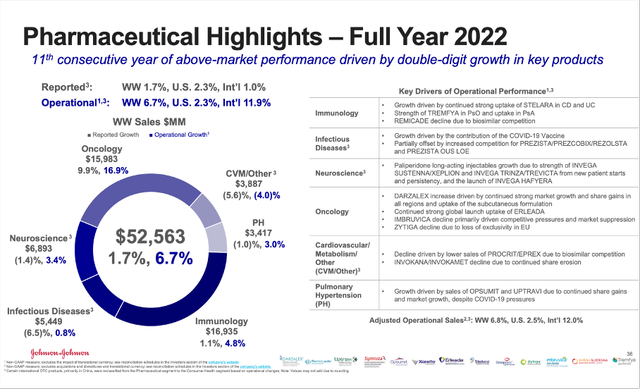
“Pharmaceuticals” – the most important segment for Johnson & Johnson, which is responsible for more than half of revenue – increased sales 1.7% YoY from $51,680 million in fiscal 2021 to $52,563 million in fiscal 2022. When excluding sales for COVID-19 vaccines, the segment increased revenue even 2.2% YoY. And operational growth was even 6.7% – mostly driven by its international business, which was able to grow 11.9% year-over-year.
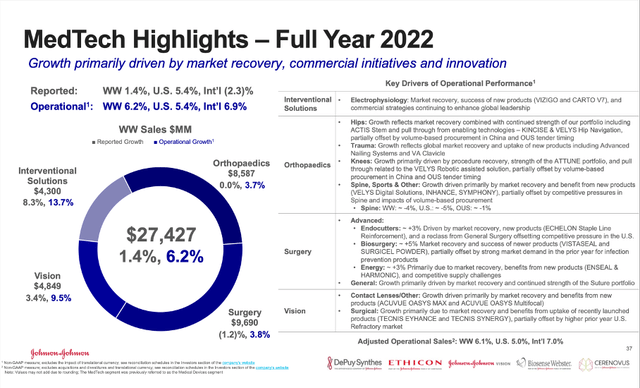
And finally, the MedTech segment increased revenue from $27,060 million to $27,427 million – resulting in 1.4% YoY growth. And once again, operating growth was much higher – 6.2% year-over-year with international revenue increasing 6.9% YoY.
Growth?
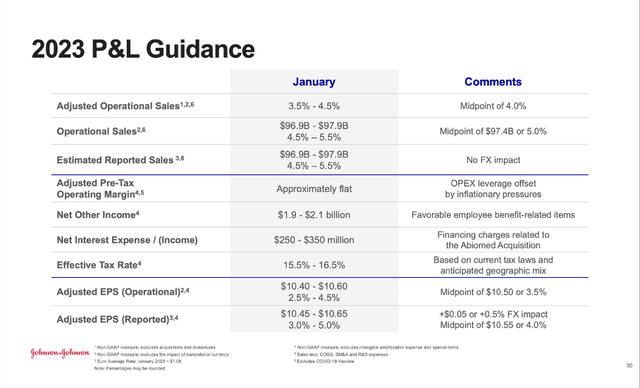
While reported growth was not so impressive for fiscal 2022, operational growth – excluding FX-effects – was solid. And when looking at the guidance for fiscal 2023, Johnson & Johnson is also expecting solid growth rates for the coming quarters. Revenue is expected to be between $96.9 billion and $97.9 billion – resulting in 4.5% to 5.5% growth compared to fiscal 2022. Adjusted earnings per share are expected to be in a range between $10.45 and $10.65, resulting in 3% to 5% growth compared to the previous year.
Those are certainly not high or impressive growth rates, but solid low-to-mid single digit growth rates; and from a huge corporation and behemoth like Johnson & Johnson we should not really expect high growth rates. When looking at analysts’ expectations for the next ten years, we see only moderate growth rates and earnings per share are expected to increase with a CAGR of 2.08% until fiscal 2023.
EPS Estimates for Johnson & Johnson (Seeking Alpha)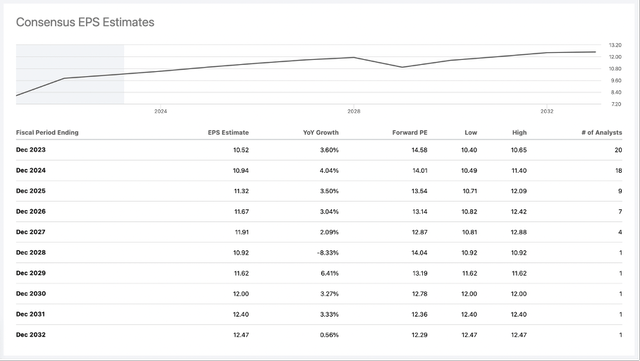
When looking at past growth rates, these expectations seem very conservative, and we might expect Johnson & Johnson to grow with a slightly higher pace. When looking at revenue as well as operating income, growth rates in the last decade were about 3.5% and in the last three years, growth was even between 4% and 5%. Earnings per share fluctuated heavily, which is the reason I only look at operating income.
|
3-year CAGR |
5-year CAGR |
10-year CAGR |
|
|---|---|---|---|
|
Revenue |
4.98% |
4.43% |
3.51% |
|
Operating Income |
4.17% |
4.39% |
3.36% |
While we can expect more or less stable revenue from the Consumer Health segment as well as the MedTech segment, the pharmaceutical segment is extremely dependent on the company being innovative and bringing new blockbusters to the market. In this case, the diversification of Johnson & Johnson is rather a problem. Even if the company can introduce one (or several) new blockbusters to the market, it won’t have a huge effect on the top line but only lead to low-to-mid single digit growth.
Aside from the pipeline and new products which lead to growing revenue, we also must keep an eye on products with patents expiring. And it seems like Johnson & Johnson is headed for a patent cliff and first must try to replace revenue it might lose due to patent losses. Especially, Stelara, which generated $9.7 billion in revenue in fiscal 2022 and will lose patent protection in 2023 could be a huge problem. Additionally, Simponi, which generated $2.2 billion in revenue in fiscal 2022, will also lose patent protection in 2024. These two products alone are responsible for 12.5% of the company’s total revenue and about 22.5% of the pharmaceuticals segment revenue. Replacing these sales will be a challenge.
And in 2027, Johnson & Johnson will lose patent protection for two other important drugs – Xarelto, which generated about $2.5 billion in revenue for Johnson & Johnson in fiscal 2022 and Imbruvica, which generated $3.8 billion in revenue (a good overview of patent expirations for different pharmaceutical companies can be found here). I honestly have my doubts if Johnson & Johnson is prepared for the patent cliff in the next five years and I also have my doubts if Johnson & Johnson can report growing sales for its pharmaceutical segment. Of course, Johnson & Johnson can also grow sales for its other two segments, but we also shouldn’t expect high growth rates.
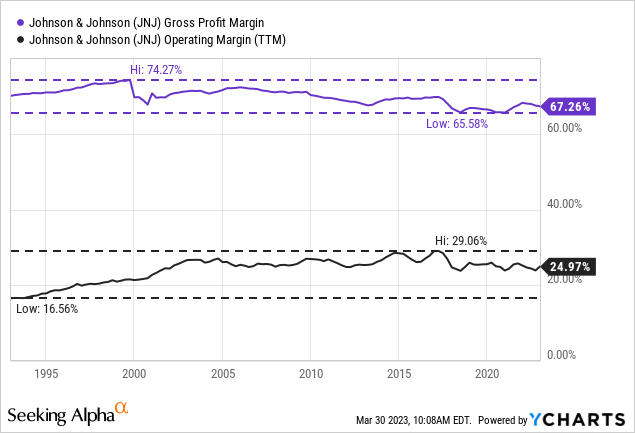
Another way to grow would be by increasing margins over the years to come. A constantly improving operating margin (and improving net income margin) could also contribute to bottom line growth. In case of Johnson & Johnson however we see extremely stable margins in the last two decades, which is good, but we should not assume improving margins that will contribute to growth in the years to come.
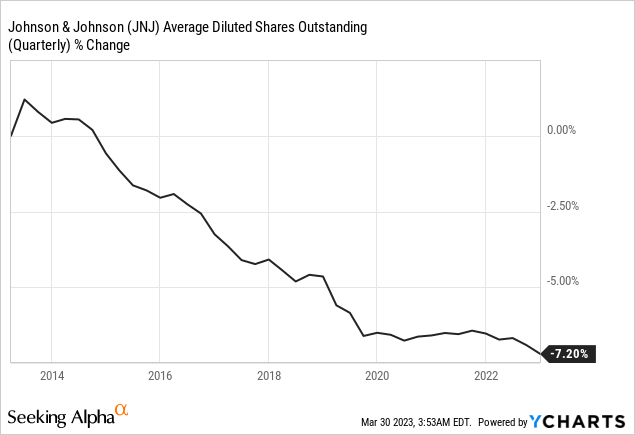
Additionally, Johnson & Johnson can improve its bottom line by repurchasing shares. In the last ten years, the company repurchased about 7% of its outstanding shares and for the years to come we can assume a similar effect on the bottom line, but probably not more than 1% growth annually.
Growth by Acquisitions: Abiomed
If a company is struggling to grow its top line organically there are other ways to improve the top and bottom line. One way is to grow by acquisitions and in late 2022, Johnson & Johnson announced the acquisition of Abiomed for approximately $16.6 billion (a payment of $380 per share in cash). Abiomed shareholders will also receive a non-tradable contingent value right (“CVR”) entitling the holder to receive up to $35 per share if certain milestones are achieved. And on December 22, 2022, the company announced the acquisition is completed.
Abiomed Acquisition Presentation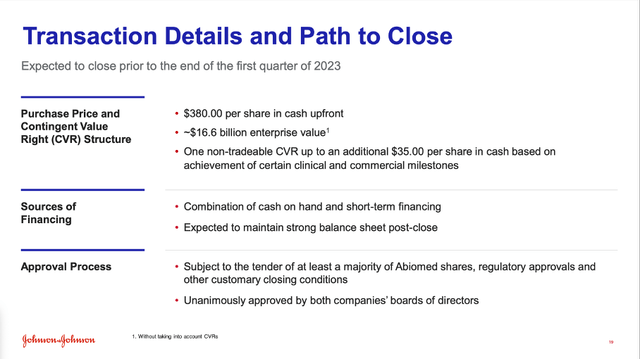
Abiomed with its 2,000 employees will remain a stand-alone company and add to Johnson & Johnson’s medical devices business. Abiomed is developing and manufacturing temporary external and implantable mechanical circulatory support devices.
The acquisition will not contribute much to growth in the years to come. In 2024, management is expecting the acquisition to contribute only about $0.05 to earnings per share for the business, but the company is addressing a $35 billion U.S. market.
Abiomed Acquisition Presentation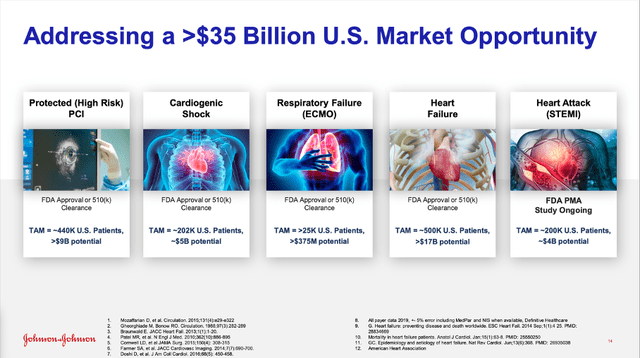
Time will tell if the acquisition made sense and will contribute to Johnson & Johnson’s business in a meaningful way. In fiscal 2022, it generated about $1 billion in revenue.
Intrinsic Value Calculation
In my last article I saw Johnson & Johnson as still overvalued and to be honest, despite the 10% decline of the stock price since my last article, I still don’t see Johnson & Johnson as a good investment. When calculating an intrinsic value by using a discount cash flow calculation I usually take the free cash flow of the last four quarters. In case of Johnson & Johnson, the TTM FCF was $17,185 million and therefore below the 5-year average of $19,116 million.
In my calculation I will be rather optimistic and take the higher free cash flow as basis. When taking 2,650 million outstanding shares and assume a 10% discount rate (as always), Johnson & Johnson must grow its free cash flow between 5% and 5.5% in the years to come to be fairly valued. And while these are not excessive growth rates, I honestly would not assume 5.5% growth for Johnson & Johnson. Not only are these growth rates clearly above analysts’ expectations, growth rates in the last ten years have also been lower.
To be honest, I would be rather cautious and calculate only with around 4% growth for Johnson & Johnson (knowing that the company might surprise me in a positive way). When using these growth assumptions and once again the average free cash flow of the last 5 years, we get an intrinsic value around $120 for Johnson & Johnson.
And when looking at the chart, the stock is at a strong support/resistance level (area marked in green) right now. In 2020, JNJ had troubles to break above this level and failed several times in 2020 before the stock finally could break higher in 2021. And in 2021 and 2022, this level has been the support for the stock a few times.
Johnson & Johnson Weekly Chart (TradingView)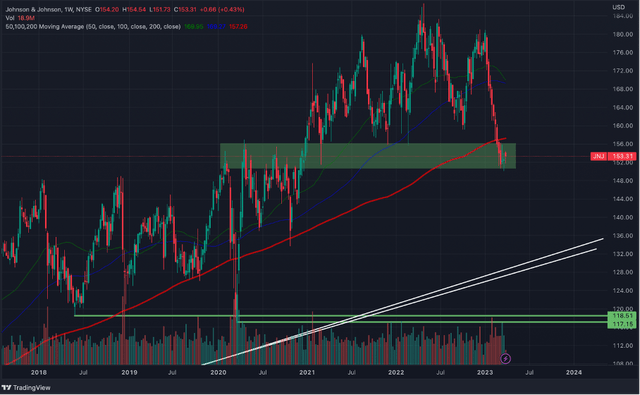
If that support level should not hold, the stock could decline to slightly below $120 where we find strong support levels with lows of 2018 as well as 2020. And the stock already broke the 200-week simple moving average (red line) and could fall lower in the coming weeks and months. And finally, around $130 we also have strong, long-lasting trendlines (the two white lines) that have been in place since 2012 and 2009 and could provide a strong support level for the stock.
Conclusion
Despite the stock trading about 10% below the price it was trading for when my last article was published, I still see no reason to buy Johnson & Johnson. Aside from the bond-like status and “Aaa rating” by Moody’s Corporation, that might be appealing, I am confident we can identify better picks in the market. Despite its status as dividend king, a dividend yield slightly below 3% is also not so interesting in the current market environment.
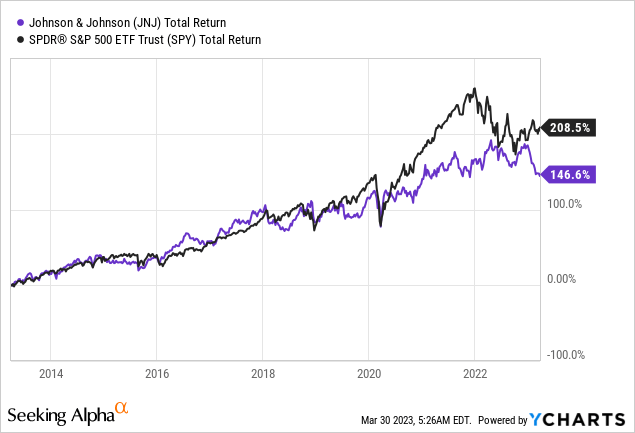
And when looking at the last ten years, Johnson & Johnson performed in line with the overall market from 2013 till 2020, but in the following three years the index outperformed Johnson & Johnson.
Analyst’s Disclosure: I/we have a beneficial long position in the shares of GILD, NVO either through stock ownership, options, or other derivatives. I wrote this article myself, and it expresses my own opinions. I am not receiving compensation for it (other than from Seeking Alpha). I have no business relationship with any company whose stock is mentioned in this article.
Seeking Alpha’s Disclosure: Past performance is no guarantee of future results. No recommendation or advice is being given as to whether any investment is suitable for a particular investor. Any views or opinions expressed above may not reflect those of Seeking Alpha as a whole. Seeking Alpha is not a licensed securities dealer, broker or US investment adviser or investment bank. Our analysts are third party authors that include both professional investors and individual investors who may not be licensed or certified by any institute or regulatory body.

