
Summary:
- Johnson & Johnson demonstrates better R&D efficiency and has a larger patent portfolio compared to Pfizer.
- JNJ’s product pipeline in the Pharmaceutical segment has more late-stage developments, supporting its positive growth outlook.
- Pfizer has a stronger financial position for future M&A activities, but JNJ’s acquisitions are more diversified and provide potential synergies.
BlackJack3D/iStock via Getty Images
In this analysis, we compared Johnson & Johnson (NYSE:JNJ) with Pfizer Inc. (NYSE:PFE), the two largest pharmaceutical companies in the US, and the largest geographic market in the world (49.8%). Firstly, we compared the two companies in terms of their product development in terms of product launches, patents, R&D efficiency as well as their product pipelines to highlight the support to their growth outlook. Moreover, we compared them in terms of M&A based on their acquisition history and analyzed whether they are well-positioned for future M&A activity. Finally, we analyzed their market positioning based on their market share in the Pharmaceutical industry to determine their advantages and growth outlook.
Product Development
Firstly, we compile JNJ and Pfizer’s R&D expenses and revenues to compare their R&D efficiency as well as their total patent filings and patent grants below.
|
Product Development Comparison ($ mln) |
2013 |
2014 |
2015 |
2016 |
2017 |
2018 |
2019 |
2020 |
2021 |
2022 |
Total/ Average |
|
JNJ R&D |
8,183 |
8,494 |
9,046 |
9,143 |
10,594 |
10,775 |
11,355 |
12,159 |
14,714 |
14,603 |
|
|
JNJ Revenue |
71,312 |
74,331 |
70,074 |
71,890 |
76,450 |
81,581 |
82,059 |
82,584 |
93,775 |
94,943 |
|
|
JNJ Revenue Growth % |
4.2% |
-5.7% |
2.6% |
6.3% |
6.7% |
0.6% |
0.6% |
13.6% |
1.2% |
3.4% |
|
|
JNJ R&D % of Revenue |
11.5% |
11.4% |
12.9% |
12.7% |
13.9% |
13.2% |
13.8% |
14.7% |
15.7% |
15.4% |
13.5% |
|
Pfizer R&D |
6,551 |
7,150 |
7,646 |
7,858 |
7,645 |
7,713 |
7,721 |
8,709 |
10,360 |
11,428 |
|
|
Pfizer Revenue |
51,584 |
49,605 |
48,851 |
52,824 |
52,546 |
40,825 |
40,905 |
41,651 |
81,288 |
100,330 |
|
|
Pfizer Revenue Growth % |
-3.8% |
-1.5% |
8.1% |
-0.5% |
-22.3% |
0.2% |
1.8% |
95.2% |
23.4% |
11.2% |
|
|
Pfizer R&D % of Revenue |
12.7% |
14.4% |
15.7% |
14.9% |
14.5% |
18.9% |
18.9% |
20.9% |
12.7% |
11.4% |
15.5% |
|
JNJ Total Patents |
7,950 |
8,718 |
8,968 |
8,579 |
9,864 |
10,701 |
11,936 |
12,048 |
11,550 |
10,724 |
|
|
JNJ Patents Growth % |
9.7% |
2.9% |
-4.3% |
15.0% |
8.5% |
11.5% |
0.9% |
-4.1% |
-7.2% |
3.6% |
|
|
Pfizer Total Patents |
1,919 |
1,849 |
2,167 |
1,995 |
2,136 |
1,883 |
2,010 |
1,852 |
2,019 |
1,425 |
|
|
Pfizer Patents Growth % |
-3.6% |
17.2% |
-7.9% |
7.1% |
-11.8% |
6.7% |
-7.9% |
9.0% |
-29.4% |
-2.3% |
|
|
JNJ Grants |
2,879 |
3,176 |
3,377 |
3,327 |
3,920 |
4,214 |
4,012 |
4,068 |
4,616 |
4,102 |
|
|
JNJ Grants Growth % |
10.3% |
6.3% |
-1.5% |
17.8% |
7.5% |
-4.8% |
1.4% |
13.5% |
-11.1% |
4.4% |
|
|
JNJ Grants % of Total |
36.2% |
36.4% |
37.7% |
38.8% |
39.7% |
39.4% |
33.6% |
33.8% |
40.0% |
38.3% |
37.4% |
|
Pfizer Grants |
699 |
716 |
847 |
707 |
810 |
698 |
755 |
718 |
757 |
504 |
|
|
Pfizer Grants Growth % |
2.4% |
18.3% |
-16.5% |
14.6% |
-13.8% |
8.2% |
-4.9% |
5.4% |
-33.4% |
-2.2% |
|
|
Pfizer Grants % of Total |
36.4% |
38.7% |
39.1% |
35.4% |
37.9% |
37.1% |
37.6% |
38.8% |
37.5% |
35.4% |
37.4% |
Source: Company Data, Khaveen Investments
R&D Efficiency
Both companies allocated a significant portion of their revenue to R&D, but Pfizer’s average R&D % of revenue is higher than JNJ’s and had consistently had a slightly higher R&D % of revenue until 2020. In 2021, Pfizer’s R&D % of revenue fell below its 10-year average as its revenue surged 2021 by 95.2% due to the rollout of its Covid vaccine which contributed $36.7 bln in revenue that year while its R&D spending only increased by 19%.
Moreover, comparing their R&D % of revenue with their average revenue growth, Pfizer has a much higher average revenue growth than JNJ (11.2% vs 3.4%), however, excluding 2021 and 2022, Pfizer’s average growth is negative at -2.6%. In comparison, JNJ had positive growth average growth of 2.2%, despite its lower R&D spending as % of revenue, thus we believe JNJ is the more efficient company in terms of its R&D spending.
Patents
Based on the table, JNJ’s total R&D spending value is consistently higher than Pfizer’s despite Pfizer’s higher average R&D % revenue. JNJ’s total R&D spending was 28% higher compared to Pfizer in 2022, thus, we would expect it to have more patents due to the higher R&D spend. Notwithstanding, JNJ has significantly more (10x) patents (10,724 patents) compared to Pfizer which has 1,425 patents in 2022. According to PatentSight, JNJ has a large patent portfolio related to the Healthcare Equipment industry which represented 29% of its total revenues. In terms of total patent filings growth, JNJ had a positive average growth compared to Pfizer which had a negative average growth; thus we favor JNJ in terms of patents.
Grants
Furthermore, in terms of patent grants, which we referred to as a proxy for their product launches, we find that JNJ also had a much higher number of patent grants each year compared to Pfizer. We calculated both companies’ grants as % of total patent filings to have a similar 10-year average of 37.4% which indicates they have similar success rates in obtaining patent grants. However, the growth trend shows Pfizer’s total grants growth declining at an average of -2.2% compared to JNJ which had a positive growth of 4.4% which is in line with their total patent growth trend. Thus, we believe this highlights JNJ’s strength over Pfizer.
Product Development Pipeline
Furthermore, we compiled the product development pipeline of JNJ and Pfizer in the table below by therapeutic segments by product development cycle phases 1 to Registration for both companies to compare their product development focus to support their future growth.
|
JNJ Pipeline |
Phase 1 |
Phase 2 |
Phase 3 |
Registration |
Total |
% of Total |
|
Cardiovascular and Metabolism |
3 |
1 |
4 |
0 |
8 |
8.5% |
|
Immunology |
3 |
11 |
10 |
1 |
25 |
26.6% |
|
Neuroscience |
2 |
6 |
4 |
0 |
12 |
12.8% |
|
Oncology |
10 |
3 |
17 |
7 |
37 |
39.4% |
|
Pulmonary Hypertension |
1 |
0 |
2 |
2 |
5 |
5.3% |
|
Infectious Diseases and Vaccines |
0 |
1 |
2 |
4 |
7 |
7.4% |
|
Total |
19 |
22 |
39 |
14 |
94 |
100.0% |
|
Pfizer Pipeline |
Phase 1 |
Phase 2 |
Phase 3 |
Registration |
Total |
% of Total |
|
Cardiovascular and Metabolism |
1 |
1 |
0 |
0 |
2 |
2.2% |
|
Immunology |
5 |
9 |
2 |
1 |
17 |
18.9% |
|
Neuroscience |
0 |
1 |
1 |
0 |
2 |
2.2% |
|
Oncology |
15 |
6 |
10 |
2 |
33 |
36.7% |
|
Infectious Diseases and Vaccines |
5 |
5 |
5 |
6 |
21 |
23.3% |
|
Diabetes |
0 |
2 |
0 |
0 |
2 |
2.2% |
|
Others |
3 |
4 |
4 |
2 |
13 |
14.4% |
|
Total |
28 |
27 |
22 |
11 |
90 |
100.0% |
Source: Company Data, Khaveen Investments
Based on the table above, JNJ’s total product development pipeline is larger compared to Pfizer which is unsurprising as highlighted above that JNJ’s R&D spending and patents are higher than Pfizer’s. However, the difference between the two companies is minimal as JNJ’s pipeline is only 4 higher than Pfizer’s overall. In terms of the pipeline number by phases, JNJ has more product developments in the later stages in Phase 3 and Registration compared to Pfizer while most of Pfizer’s product developments are still in the early phases of Phase 1 and Phase 2 which indicates that Pfizer has recently started pursuing more product developments.
Both companies’ largest product development by therapeutic segment is Oncology with the highest number of product developments of their total pipeline each. The Oncology market segment is projected to be the largest segment in the Pharmaceutical industry by 2027 valued at $377 bln by 2027 according to IQVIA. For Pfizer, Oncology represents 37% of its pipeline and 39.4% for JNJ. In comparison, this is higher than the industry breakdown for Oncology which is projected to account for 27% of the industry in 2027.
JNJ’s second largest segment with the most pipeline is Immunology which is projected to be the second largest therapeutic segment valued at $177 bln of the $1,397 bln Pharmaceutical industry by 2027 whereas Pfizer’s second largest segment with the most developments is Infectious Diseases and Vaccines.
Outlook
All in all, our analysis points to JNJ being the superior company in terms of product development. JNJ has had larger total R&D spending but it has had a lower R&D as % of revenue compared to Pfizer. Additionally, despite Pfizer’s higher R&D spending % of revenue compared to JNJ except in 2021 and 2022 when its revenue surged, its revenue growth had underperformed with negative average revenue growth (-2.6%) compared to JNJ which has had positive average revenue growth (2.2%), thus we believe JNJ has better R&D efficiency compared to Pfizer.
Besides that, JNJ also has a larger patent portfolio with a higher number of total patent fillings compared to Pfizer which we believe is due to its large patent portfolio related to healthcare Equipment. However, following the recent spinoff of its Consumer Health business in 2023, we expect its total patent filings to decline due to the spinoff.
Moreover, based on their patent grants as % of total patent filings, both companies have similar success rates of grants, thus we expect JNJ’s higher pipeline to benefit its outlook more relative to Pfizer.
That said, based on JNJ’s product pipeline, we believe its Pharmaceutical segment outlook in the next 5 years is more positive compared to Pfizer as it has more late-stage product developments in Phase 3 and Registration phases. Furthermore, while Pfizer has a larger number of product developments in the early stages of Phase 1 and 2 compared to JNJ, these phases have high uncertainty of success. For example, Pfizer recently announced that it discontinued 9 developments across Phase 1 and Phase in since May 2023. Thus, we believe JNJ’s product pipeline is stronger compared to Pfizer’s due to its higher number of developments in Phase 3 and registration compared to JNJ which could support its growth outlook.
Moreover, our analysis of the pipeline by therapeutic area shows that both Pfizer and JNJ’s largest segment is Oncology, accounting for 36.7% and 39.4% of their total pipeline, respectively. The Oncology market is projected to be the largest in the overall industry (27% share). Following that, JNJ’s second highest segment in its pipeline is Immunology (26.6%) and is projected to be the second largest market (12.7% share). In comparison, Pfizer’s second largest segment in its pipeline is the Infectious Diseases and Vaccines (23.3%) segment, which is projected to only be the seventh largest (5.3% share) by 2027. Overall, we believe JNJ is targeting both the Oncology and Immunology markets while Pfizer is targeting the Oncology and Infectious Diseases and Vaccines markets. We believe these companies focus on the Oncology market to increase their market opportunity by reaching the widest market and making their product development more efficient, with JNJ having an advantage as its top 2 target markets are larger than Pfizer.
Furthermore, based on JNJ’s latest earnings briefing, JNJ provided a positive outlook for 2024 growth with key anticipated product developments across Oncology (ELITA), Immunology, and Neuroscience. Additionally, Pfizer highlighted the positive developments in its Oncology pipeline following its recent Seagen acquisition as well as respiratory vaccines under Infectious Diseases and Vaccines.
M&A Comparison
Furthermore, we compared the company’s M&A activities by compiling the number of acquisitions and acquisition costs in the past 10 years and categorizing them based on their therapeutic areas for its Pharmaceutical acquisitions and determined they are well-positioned to pursue future acquisitions.
|
Acquisitions |
2013 |
2014 |
2015 |
2016 |
2017 |
2018 |
2019 |
2020 |
2021 |
2022 |
Total/ Average |
|
Healthcare Equipment (MedTech) |
1 |
1 |
6 |
2 |
2 |
1 |
1 |
14 |
|||
|
Personal Care (Consumer Health) |
1 |
1 |
3 |
1 |
1 |
1 |
8 |
||||
|
Pharmaceutical |
1 |
2 |
2 |
0 |
0 |
1 |
1 |
2 |
0 |
0 |
9 |
|
Cardiovascular and Metabolism |
1 |
1 |
|||||||||
|
Immunology |
1 |
1 |
2 |
4 |
|||||||
|
Neuroscience |
0 |
||||||||||
|
Oncology |
1 |
1 |
2 |
||||||||
|
Pulmonary Hypertension |
0 |
||||||||||
|
Infectious Diseases and Vaccines |
1 |
1 |
2 |
||||||||
|
JNJ Total Acquisitions |
3 |
3 |
2 |
4 |
9 |
6 |
2 |
3 |
1 |
1 |
34 |
|
JNJ Acquisition Costs |
835 |
2,129 |
954 |
4,509 |
35,151 |
899 |
5,810 |
7,323 |
60 |
17,652 |
7,532 |
|
Cardiovascular and Metabolism |
0 |
||||||||||
|
Immunology |
1 |
1 |
|||||||||
|
Neuroscience |
1 |
1 |
1 |
3 |
|||||||
|
Oncology |
1 |
1 |
2 |
||||||||
|
Infectious Diseases and Vaccines |
1 |
2 |
1 |
1 |
5 |
||||||
|
Diabetes |
0 |
||||||||||
|
Others |
1 |
1 |
1 |
3 |
|||||||
|
Pfizer Total Acquisitions |
1 |
1 |
1 |
3 |
1 |
0 |
1 |
0 |
0 |
4 |
12 |
|
Pfizer Acquisition Costs |
15 |
195 |
16,466 |
18,368 |
1,000 |
0 |
10,861 |
0 |
0 |
22,997 |
6,990 |
Source: Company Data, Khaveen Investments
Based on the table, we found that JNJ had made a total of 34 acquisitions in the past 10 years, which is higher than Pfizer, which only acquired 12 companies. However, most of JNJ’s acquisitions are not Pharmaceutical-related but instead are in the Healthcare Equipment and Personal Care industries. JNJ’s average total acquisition cost per year is slightly higher than Pfizer which is expected as it made more acquisitions.
In terms of Pharmaceutical acquisitions, JNJ only made 9 acquisitions which is lower than Pfizer’s 12 acquisitions. Moreover, Pfizer acquired the most companies in the past 10 years in 2022 with a total of 4 acquisitions. Whereas JNJ had not made any Pharmaceutical acquisition since 2020 when it acquired Momenta Pharmaceuticals for $6.5 bln.
By therapeutic area, Immunology represents the highest number of acquisitions for JNJ followed by Oncology and Infectious Diseases and Vaccines. This highlights the company’s focus on expanding in the Immunology segment. In 2020, its Momenta acquisition was related to Immunology. According to the company, its acquisition of Momenta supports its growth outlook in this area and provides the company with access to Momenta’s IP of antibodies, allowing JNJ to expand its reach.
This acquisition provides an opportunity for the Janssen Pharmaceutical Companies of Johnson & Johnson to broaden its leadership in immune-mediated diseases and drive further growth through expansion into autoantibody-driven disease. The transaction will include full global rights to nipocalimab (M281), a clinically validated, potentially best-in-class anti-FcRn antibody. – JNJ
Furthermore, in 2023, JNJ completed the spinoff of its Consumer Health business unit, Kenvue, which accounted for 29% of its 2022 revenues but holds a remaining 9.5% stake in the company. We believe this highlights its move to streamline its business and focus on its Pharmaceutical and Healthcare Equipment businesses.
On the other hand, Pfizer’s therapeutic area which has the most acquisitions is Infectious Diseases and Vaccines followed by Neuroscience and Others which includes hematology, pediatric, and dermatology acquisitions. In 2022, its latest Infectious Diseases and Vaccines include ReViral which brings its “Respiratory Syncytial Virus Therapeutic Candidates” to Pfizer. Also, we believe its acquisition of Biohaven’s CGRP franchise could benefit its Neuroscience segment as “Nurtec is the only oral CGRP drug approved to both prevent and treat migraine attacks, and Pfizer believes the company’s global scale can make the most out of the promising medicine”. Furthermore, the company also acquired Arena which adds to Pfizer’s Immunology product development pipeline.
Earnings and Margins
In terms of comparing the sustainability of future M&A activity by both companies, we first examine their profitability margins. Overall, both companies have solid positive margins but Pfizer has higher gross (76.9% vs 67.8%), EBIT (28.1% vs 26.6%), and net margins (27.6% vs 18.4%) based on its 10-year average compared to JNJ. The reason for JNJ’s lower profit margins compared to Pfizer is due to its Healthcare Equipment and Personal Care segments both having lower profit margins compared to its Pharmaceutical business. For example, in 2022, its Healthcare Equipment and Personal Care segments’ profit before tax margin was only 19.3% and 16.8% respectively compared to its Pharmaceutical segment margin of 30.2%. In our previous analysis of UnitedHealth, we identified the Pharmaceutical industry has the highest profit margins within the Healthcare sector.
Cash Flows
Company Data, Khaveen Investments Company Data, Khaveen Investments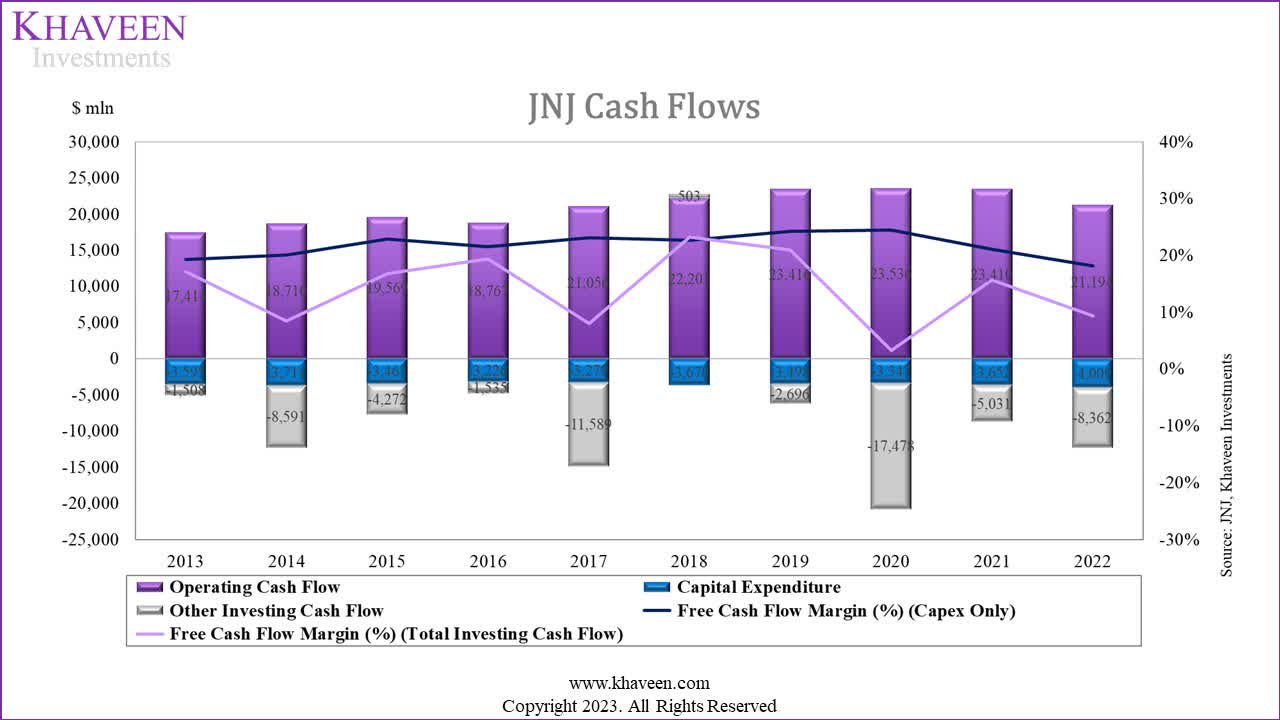
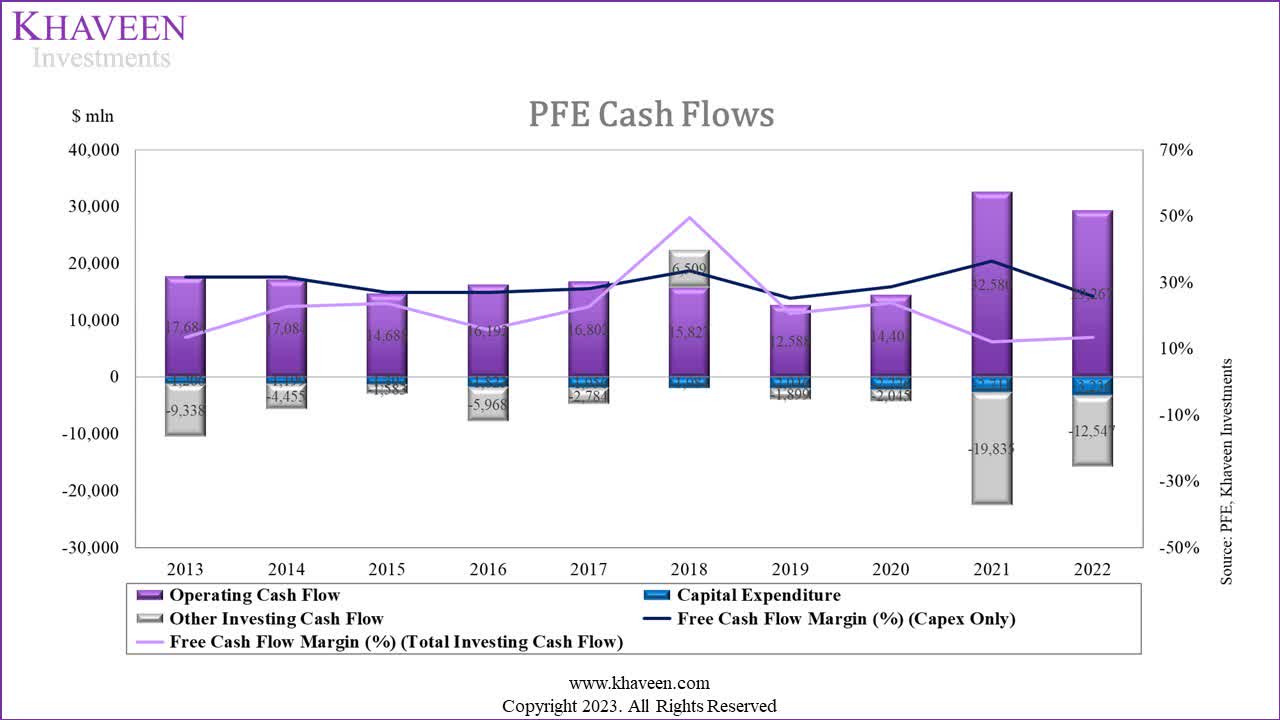
Moreover, in terms of cash flow, both companies also have exceptionally strong margins. Pfizer has a higher average FCF margin of 21.7% compared to JNJ’s 14.2% based on a 10-year average. This is expected as we identified that JNJ has a higher average total acquisition spending per year as mentioned above. Thus, we believe both companies’ strong positive FCF margins indicate strong cash generation abilities to fund future acquisitions, but Pfizer has a slight advantage over JNJ with higher margins.
Financial Position
Finally, we examined the company’s financial position in terms of net debt. Both companies have net debt positions with JNJ having a slightly higher net debt of $76 bln compared to Pfizer ($70 bln). In terms of cash-to-debt ratios, Pfizer has only a slightly higher ratio of 0.4x compared to JNJ (0.3x). Pfizer’s cash-to-debt ratio had been stable in the past 10 years while JNJ had deteriorated slightly over the years. Furthermore, following the spinoff of JNJ’s Kenvue business in 2023, the company had raised $13.2 bln in cash, which we believe could provide it ammo for future acquisitions.
Outlook
All in all, both companies have made a series of acquisitions related to their Pharmaceutical business segments in the past 10 years. By therapeutic area, Pfizer’s highest acquisitions are in Infectious Diseases and Vaccines while JNJ’s highest is in Immunology. However, both companies’ acquisitions do not indicate any area of focus. The main difference between Pfizer and JNJ is that most of JNJ’s acquisitions are related to Healthcare Equipment followed by Pharmaceuticals and Personal Care. Following the spinoff of JNJ’s Kenvue business in 2023, we expect this could allow JNJ to focus on acquiring Pharmaceutical and Healthcare Equipment companies.
According to PubMed Central, pharmaceutical companies are interested in medical devices as they have the same end users which are patients and doctors as well as depend on common healthcare distributors such as McKesson. Furthermore, pharmaceutical companies are developing medical devices that contain medicine which we believe could provide synergies for companies such as JNJ. For example, Becton Dickinson’s Lutonix drug delivery equipment is used to administer paclitaxel in patients. Therefore, we believe JNJ’s healthcare equipment acquisitions could provide it with additional benefits through product integration opportunities with its Pharmaceutical business, which Pfizer would be unable to benefit from as it specializes in Pharmaceuticals only.
We believe both companies could continue to sustain future M&A activities as they both have solid profit margins and strong cash generation. Our analysis points to Pfizer being in a better position for more M&A activities as it has a slightly better financial position and stronger FCF margins compared to JNJ.
In 2023, for example, Pfizer is planning to acquire Seagen which “strongly complements Pfizer’s Oncology portfolio” for $43 bln, making it the largest deal the company has been making in the past 10 years. Additionally, management previously explained the acquisition could boost its revenues with a contribution of $10 bln in revenues by 2030.
We also remain very excited about our planned acquisition of Seagen, which, if approved, is expected to contribute more than $10 billion in 2030 revenues. – Dr. Albert Bourla, Chairman and CEO
Notwithstanding, the spinoff of JNJ’s Kenvue business has led the company to raise $13.2 bln from the deal which we believe could support JNJ to pursue more acquisitions in the near term. Based on management from its previous earnings briefing, the company described its “appetite as pretty voracious at this point” regarding M&A.
Market Leadership
At this point, we analyzed which company has an advantage in terms of market positioning in the pharmaceutical industry.
Market Share
Company Data, IQVIA, Khaveen Investments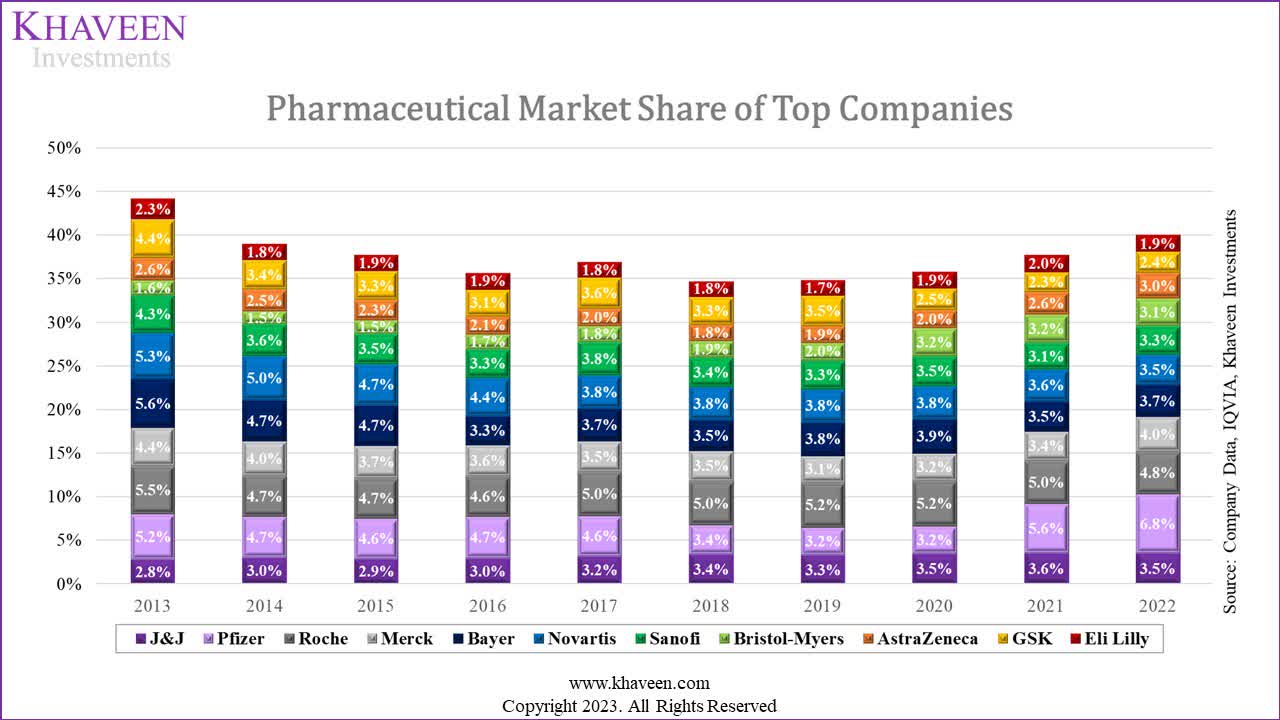
Based on our Pharmaceutical market share above, the top 11 companies have been on a decreasing trend until 2018 as the remaining Other companies gained share, before stabilizing in 2018 and having a rebound through 2022 against the remaining Other companies.
In 2021, Pfizer claimed the top spot as the market leader with its strong growth that year and maintained its position as the market leader of the pharmaceutical market in 2022. For JNJ, its market share gradually increased from 2013 to 2021 but there was a slight decrease in market share in 2022.
Geographic Revenue Breakdown
Furthermore, we compiled the geographic breakdown of JNJ and Pfizer below and consolidated their breakdown into US and non-US revenue.
|
Geographic Revenue Comparison |
JNJ |
Pfizer |
|
US Revenue |
51.2% |
42.3% |
|
US Revenue Growth (10-year Average) |
4.8% |
10.1% |
|
Non-US Revenue |
48.8% |
57.7% |
|
Non-US Revenue Growth (10-year Average) |
2.1% |
14.4% |
Source: Company Data, Khaveen Investments
Based on the table, both companies have the US representing a substantial contribution to their revenues which is not unsurprising as the US represented 49.8% of the $1.2 tln Pharmaceutical industry in 2022. However, Pfizer’s revenue breakdown from the US is less than JNJ and its non-US revenue % exposure is higher than JNJ which indicates it is less dependent on the US. Pfizer’s non-US 10-year average growth had been higher than both its US growth and higher than JNJ’s non-US growth. However, Pfizer’s non-US average growth was boosted in 2021 (155.2% YoY) as it ramped up its Covid vaccine sales globally. Excluding 2021 and 2022, Pfizer’s non-US revenue average growth was negative at -5.5% compared to its positive US average growth of 1.4%. For JNJ, its US revenue growth excluding 2021 and 2022 was more stable at 4.4%, only 0.4% lower than its 10-year average but its non-US average growth was lower at only 0.2% compared to 2.1%. Therefore, we believe both companies’ growth benefits in terms of their exposure to the US due to their higher average growth compared to their non-US performance.
According to Statista, the pharmaceutical industry is projected to grow at a CAGR of 5.8% while the US market is projected to grow at a similar rate of 5.76%. The US market growth rate projections are slightly higher compared to JNJ and Pfizer’s past performance excluding 2021 and 2022, which could indicate a brighter growth outlook for both companies.
Pharmaceutical Segments
We compiled the revenue breakdown by Therapeutic segment for JNJ and Pfizer to compare which areas both companies have a larger revenue exposure to. For JNJ, we obtained its breakdown from its annual report and for Pfizer, we compiled its revenue by products and categorized each product into their respective therapeutic areas.
Company Data, Khaveen Investments Company Data, Khaveen Investments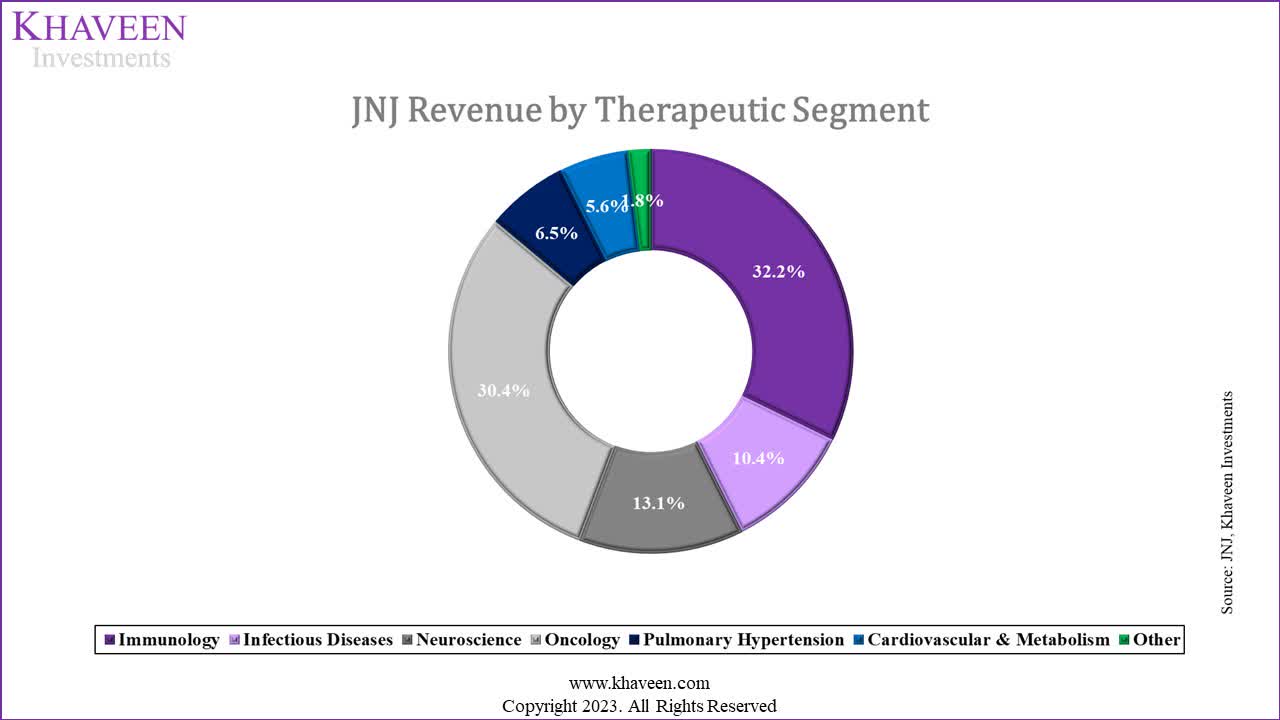
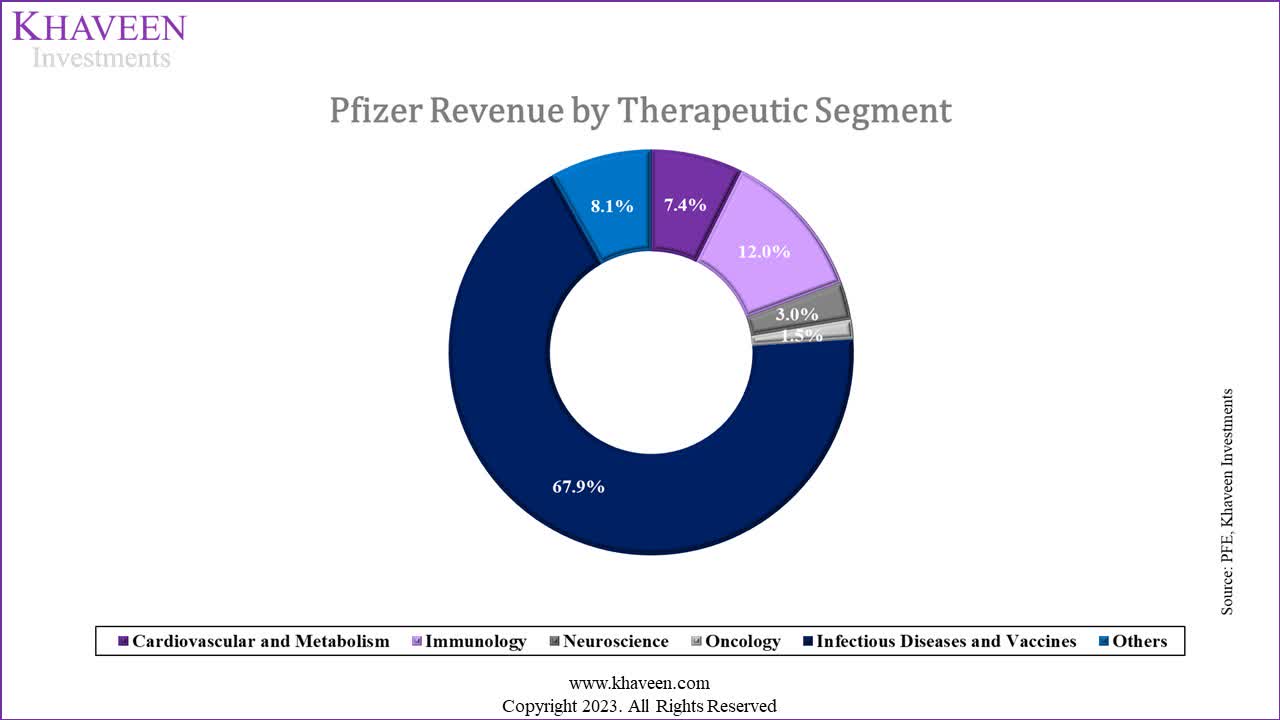
From the revenue breakdown chart above, JNJ’s breakdown shows it is more diversified with 7 key therapeutic areas. Immunology represents the largest segment of JNJ accounting for 32.2% of its revenue. For Pfizer, Immunology is also its second largest segment at 12% of its total revenues. In Immunology, JNJ’s products in this segment include STELARA for diseases such as psoriasis, arthritis, Crohn’s disease, and ulcerative colitis. It is the largest drug by revenue of the segment (57% of Immunology revenue) and supported its Immunology segment growth with a growth rate of 10.4% in 2022.
Oncology represents another significant segment for JNJ (30.4% of revenue) but only 1% of revenue for Pfizer in 2022. JNJ’s pharmaceutical revenue growth was flattish at only 1.7%. However, Oncology was JNJ’s segment with the strongest growth of 9.9%. Its strong growth in Oncology was attributed to its biggest Oncology drug (DARZALEX) representing 50% of its Oncology revenue and growing by 39.5% in 2022. Following that, its ERLEADA oncology drug also grew robustly by 45.7% in 2022. DARZALEX and ERLEADA are medicines for blood and prostate cancer.
In comparison, the Infectious Diseases and Vaccines segment is very significant to Pfizer as it accounts for 68% of revenue but is only 10% of JNJ’s revenue. For Pfizer in particular, the majority of its revenues from this segment is from its Covid products, accounting for 95% of its Infectious Diseases and Vaccines segment revenue, thus its Covid revenue (Comirnaty and Paxlovid) was 64.5% of total revenue. In Q3 2023 YTD, Pfizer’s Covid revenue had declined by 76% YoY. Compared to Pfizer’s JNJ has a lower revenue contribution from Covid vaccine products, representing only 4% of its 2022 revenue. Overall, the breakdown comparison highlights the strength of JNJ in Immunology and Oncology with the company having a “bold vision to eliminate cancer” and Pfizer within the Infectious Diseases and Vaccines as it is the leader in Covid vaccination.
Outlook
JNJ Analysts’ Revenue Consensus
Seeking Alpha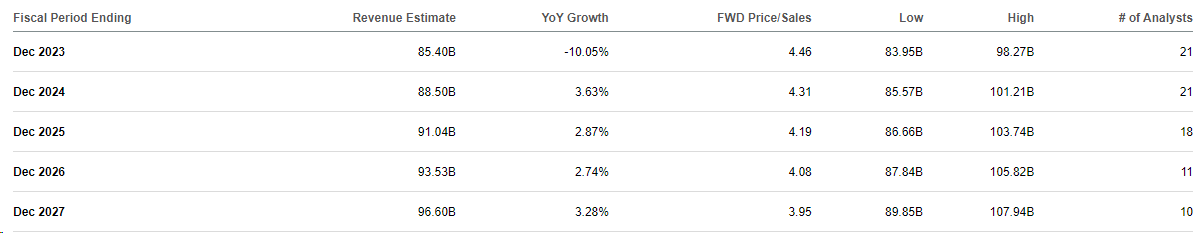
Based on analyst consensus estimates, JNJ’s total revenue is expected to decline by 10%. We believe the total decline is attributable to its spinoff of Kenvue in 2023 which accounted for 15.7% of its total revenue in 2023. Furthermore, according to its latest Q3 2023 briefing, management guided “operational sales growth for the full-year 2023 to be in the range of 8.5% to 9.0%”.
We believe its growth could be supported by its second-largest segment, Oncology, as management highlighted in Q3 that it continued “to drive strong sales growth for both DARZALEX and ERLEADA with increases of 20.7% and 27%, respectively, due to continued share gains and market growth”. The Oncology market is projected to grow by a CAGR of 11.4%, surpassing the pharmaceutical industry market’s forecasted CAGR of 5.8%. One of the drivers of the Oncology market is the increasing prevalence of cancer.
It is predicted there will be 28 million new cancer cases worldwide each year by 2040, if incidence remains stable and population growth and ageing continues in line with recent trends. This is an increase of 54.9% from 2020. – Cancer Research UK
Besides Oncology, the company also highlighted strong sales in its largest segment, Immunology, with STELARA increasing by 15.8% “predominantly driven by favorable patient mix and market growth”. The Immunology segment has a market projected CAGR of 8.5%, surpassing the overall Pharmaceutical industry growth forecast of 7%, thus boding well for JNJ and Pfizer. Some of the market drivers of the Immunology drug market include rising occurrence and awareness about immunological diseases such as rheumatoid arthritis and psoriatic arthritis.
Pfizer Analysts’ Revenue Consensus
Seeking Alpha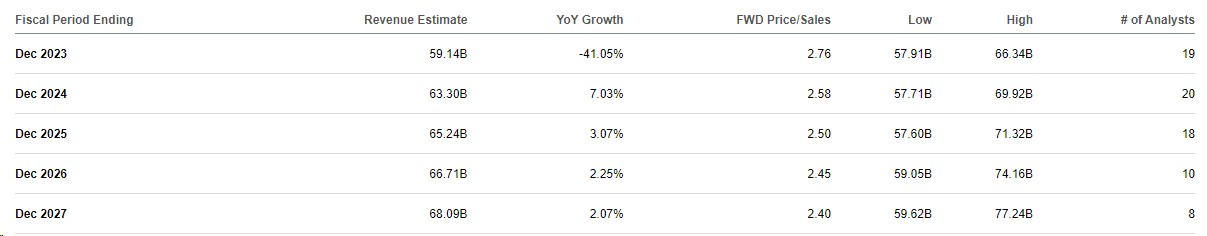
Pfizer’s revenue is expected to decrease significantly by 41% in 2023 which we believe is due to the decline of its Covid revenue which represented 65% of its revenue in 2022. Pfizer’s Covid revenue growth had declined by 76% TTM. Furthermore, Pfizer highlighted its optimism about the long-term outlook for its non-Covid revenues, which grew 7% YTD and expects full-year growth to be between 6% to 8% in its latest earnings briefing. However, Covid revenues still represent around a quarter of its revenues and could be a growth headwind. Furthermore, according to CNBC, Pfizer’s latest booster vaccine rollout had been affected by “supply and insurance coverage issues” and “fewer patients have also sought treatments for Covid than they did earlier in the pandemic, as vaccination and prior immunity lead to milder cases for many people”. The Infectious Diseases market is projected to grow at a CAGR of 4.3% and below the industry growth rate. We believe one of the factors is that Covid vaccinations have slowed down sharply. Based on Our World in Data, the average Covid dose administered in May 2023 was 82% lower than the same period a year ago. Pfizer expects 24% of the US population to receive a Covid vaccine this year. However, based on the CDC, the US % of the population that had received a booster dose was only 16.8%, compared to 81.3% which had a single dose. Therefore, we believe the demand for Covid vaccines has significantly slowed down which is negative for Pfizer which has a larger revenue dependency on Covid products.
All in all, we believe JNJ is better than Pfizer in terms of its revenue growth outlook. Although Pfizer continued to lead the Pharmaceutical industry in 2022, we identified its rise was attributed to its surge in Covid revenues. Before 2020, Pfizer’s market share declined while JNJ’s share continued to steadily increase as its growth across US and international segments outperformed JNJ. However, we expect Pfizer could face difficulties in maintaining its market leadership in 2023 as its revenues are projected to decline substantially by 41% this year with large declines in its Covid revenues. Going forward, we expect the company’s growth outlook to be relatively lower due to its large exposure to the Infectious Diseases market which has a lower forecast CAGR (4.3%) than the overall industry (7%) as Covid vaccination rates slowed down. On the other hand, we believe JNJ is poised to benefit from the high growth outlooks of the Immunology and Oncology segments which are two of the company’s largest segments and are forecasted to outperform the industry CAGR due to the rising prevalence of immunological diseases and cancer.
Risk: Losing Out in High Growth Obesity/Diabetes Drug Market
Both JNJ and Pfizer had product developments for diabetes and obesity drugs to compete with Eli Lilly and Novo Nordisk. However, Pfizer had recently announced its cancellation of its obesity pill product development which it previously stated could bring $10 bln in revenue opportunity for the company. In 2019, JNJ also previously scrapped its product development for diabetes and obesity drugs after Phase 2 trials. We believe both companies’ failure to develop an obesity product could affect their market positioning as we previously analyzed Eli Lilly’s Mounjaro has a CAGR of 58.4% according to JP Morgan projections.
Valuation
To value the companies, we used a comparable multiples valuation approach based on the EV/EBITDA ratios of the top 10 Pharmaceutical companies.
|
Company |
EV / EBITDA (5-year Average) |
|
Johnson & Johnson |
13.95x |
|
Pfizer Inc. |
10.58x |
|
Roche Holding AG (OTCQX:RHHBY) |
11.41x |
|
Merck & Co., Inc. (MRK) |
12.95x |
|
Novartis AG (NVS) |
12.73x |
|
Bayer AG (OTCPK:BAYZF) |
9.32x |
|
Sanofi (SNY) |
10.96x |
|
Bristol-Myers Squibb Company (BMY) |
10.34x |
|
AstraZeneca PLC (AZN) |
23.11x |
|
GSK plc (GSK) |
9.96x |
|
Average |
12.53x |
Source: Seeking Alpha, Khaveen Investments
Based on the table, we obtained an average EV/EBITDA of 12.53x for the top Pharmaceutical companies. We compared both JNJ and Pfizer’s current EV/EBITDA with the industry average and calculated each of their % difference to the average.
|
Valuation |
JNJ |
Pfizer |
|
EV/EBITDA |
10.82x |
13.79x |
|
Industry Average (5-year Average) |
12.53x |
12.53x |
|
Upside |
15.8% |
-9.1% |
Source: Khaveen Investments
Overall, JNJ’s current EV/EBITDA of 10.82x is below the industry average, leading to an upside of 15.8%. On the other hand, Pfizer’s current EV/EBITDA of 13.79x is slightly above the industry average, with a downside of 9.1%.
Verdict
All in all, firstly, we find JNJ to be the superior company compared to Pfizer. This is due to factors such as in terms of product development. JNJ has a larger total R&D spending, but a lower R&D as a percentage of revenue compared to Pfizer. Additionally, JNJ has consistently shown positive average revenue growth, while Pfizer’s revenue growth has underperformed. Therefore, we believe JNJ demonstrates better R&D efficiency compared to Pfizer. Moreover, JNJ boasts a larger patent portfolio, primarily in healthcare equipment. However, following the recent spinoff of its Consumer Health business, we anticipate a decline in total patent filings for JNJ. Nevertheless, both companies have similar success rates for patent grants. Based on their product pipelines, we believe JNJ’s Pharmaceutical segment outlook for the next 5 years is more positive than Pfizer’s, with more late-stage developments in Phase 3 and Registration phases. Pfizer has a larger number of products in early-stage phases, which carry higher uncertainty of success. Both companies have a significant focus on the Oncology therapeutic area in their pipelines, but JNJ also emphasizes Immunology. Pfizer’s second-largest segment is Infectious Diseases and Vaccines, while JNJ focuses on Healthcare Equipment, Pharmaceuticals, and Personal Care.
In terms of M&A activities, both companies have made acquisitions in their Pharmaceutical business segments. However, JNJ’s acquisitions are more diversified, including healthcare equipment, which could provide synergies. Financially, we believe Pfizer appears to be in a better position for M&A activities, with stronger cash generation and profit margins. In 2023, Pfizer is planning a significant acquisition, while JNJ’s spinoff of Kenvue is expected to support its ability to pursue more acquisitions.
JNJ’s total revenue is expected to decline in 2023 due to the Kenvue spinoff, but its growth is supported by strong sales in the Oncology and Immunology segments, which are projected to outperform the industry’s growth. Conversely, Pfizer’s revenue is expected to decline significantly in 2023, mainly due to the decline in Covid revenue. With Pfizer experiencing declining revenue and market share, coupled with a less promising growth outlook in Infectious Diseases, we believe JNJ is better positioned to capitalize on the growth in the Immunology and Oncology segments.
Based on our comparable multiples valuation based on EV/EBITDA, we rate JNJ as a Buy with a price target of $183.43 at an upside of 15.8% whereas Pfizer as a Hold with a price target of $26.26 and a downside of 9.1%. Our valuation aligns with our outlook where we believe JNJ to be in a better position due to its strong product development and growth outlook.
Analyst’s Disclosure: I/we have a beneficial long position in the shares of JNJ, PFE either through stock ownership, options, or other derivatives. I wrote this article myself, and it expresses my own opinions. I am not receiving compensation for it (other than from Seeking Alpha). I have no business relationship with any company whose stock is mentioned in this article.
No information in this publication is intended as investment, tax, accounting, or legal advice, or as an offer/solicitation to sell or buy. Material provided in this publication is for educational purposes only and was prepared from sources and data believed to be reliable, but we do not guarantee its accuracy or completeness.
Seeking Alpha’s Disclosure: Past performance is no guarantee of future results. No recommendation or advice is being given as to whether any investment is suitable for a particular investor. Any views or opinions expressed above may not reflect those of Seeking Alpha as a whole. Seeking Alpha is not a licensed securities dealer, broker or US investment adviser or investment bank. Our analysts are third party authors that include both professional investors and individual investors who may not be licensed or certified by any institute or regulatory body.