Summary:
- Thesis Update: JPMorgan’s stock has risen by 15.57% since my previous article. Now, my projected fair price is $237.41, representing a 20.7% upside from the current price.
- Growth Plan: Expansion through 500 new branches poses both opportunities and risks in capturing deposits.
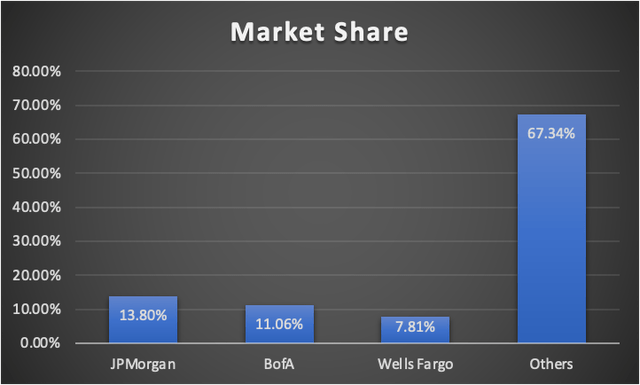
- Market Share: JPMorgan holds 13.80% of total deposits in the US, indicating room for growth in the banking sector.
- Rating: JPM remains a strong buy because of its strong financial condition and the potential return that can be released if my fair price estimate is achieved.
Michael M. Santiago
Thesis
In my previous article (released in Q3 2023, which were released on October 13) that covered JPMorgan Chase & Co. (NYSE:JPM), I assigned a strong buy rating citing that its estimated fair price was around $314.74, an 85% upside from the stock price at the time of $170.1. The stock price is around $196.6, which indicates that the stock has increased by 15.57% since my previous article.
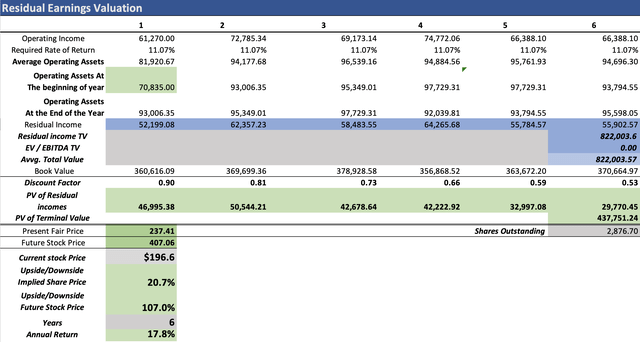
In this article, I will update my model on JPMorgan with the information from Q4 2023, released on January 12. After concluding the valuation process, I arrived at an estimated fair price per share of $237.41, which is a 20.7% upside from the current stock price of $196.6. Furthermore, the model suggests a future price of $407.06, which implies 17.8% annual returns throughout 2029.
Overview
Growth plan
JPMorgan announced on February 6 that they would open around 500 new branches by 2027. This of course represents a risk and an opportunity. The opportunity is to get deposits from people who were not near a JPMorgan Chase branch. This expansion is mostly focused on low-income areas and rural communities. The risk is that if not enough people (or businesses) put their money into JPMorgan, this would mean that part of those 500 new branches will be unprofitable.
How does JPMorgan compare against peers?
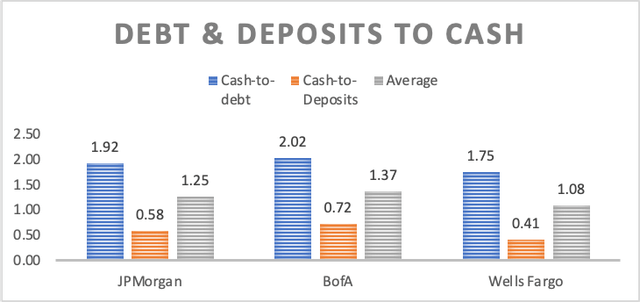
Of the big three banks, JPMorgan is the second most solid since its total cash reserves can cover around 58% of deposits and 1.92 times its total debt. However, Bank of America Corporation (BAC) can cover 72% of deposits with its cash reserves and 2.02 times its total debt. For that reason, BofA scores better than JPMorgan.
If we divided the total deposits of each of these banks by the total amount of deposits in the US banking system (which is around $17.4 trillion) we can deduct that JPMorgan’s market share is around 13.80% which is slightly higher than BofA’s 11.06%. Wells Fargo comes in third by holding around 7.81% of deposits. However, this suggests that the three banking giants have (in theory) a lot of room to grow.
Industry outlook
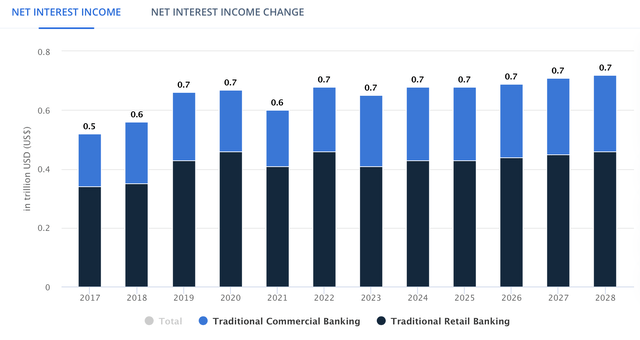
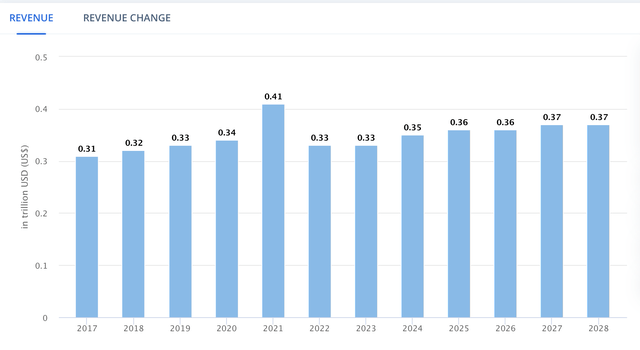
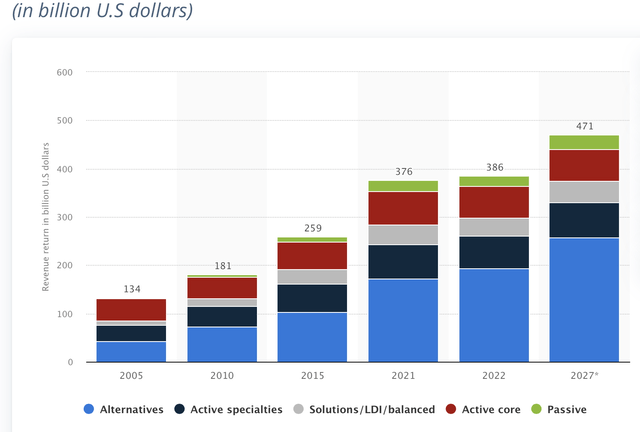
The US Traditional Banking Market, which includes retail banking and commercial banking, is expected to expand at a 1.44% annual pace throughout 2028. Meanwhile, the global investment banking revenue is expected to grow at a CAGR of 1.4% throughout the same period. In these two markets, the addressable market (in terms of revenue) stands at $1.03T.
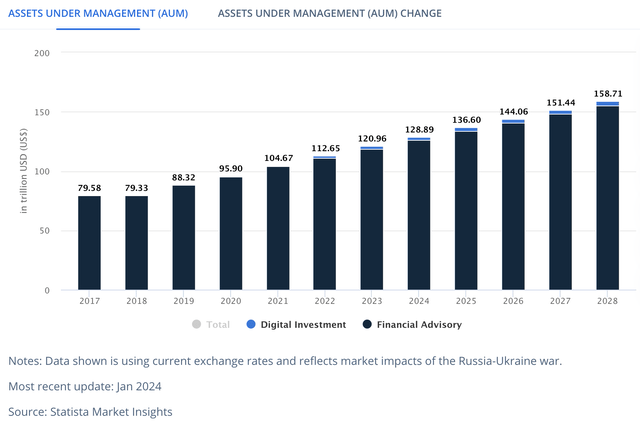
Lastly, Worldwide Asset Management and Wealth Management are expected to grow faster, at a 4.40% and 5.90% annual pace respectively. The addressable market of asset management stands at $402.98B and in the case of wealth management, the addressable market is $120.96T in assets.
Summing all of this up, we can deduct that JPM has an addressable market (in terms of revenue) of around $1.43T comprising Traditional & Investment banking, and Asset Management, and an addressable market (In terms of AUM) of 120.96T in assets in wealth management. The addressable market for 2028 is expected to reach $1.56T (in revenue) for the first three segments and $158.71T (in AUM) for wealth management.
Valuation
In this article, I will value JPMorgan Chase using a Residual Earnings Model. In the table below you can see all the current financial data as of Q4 2023 that is necessary to proceed with the model. Additionally, the discount rate in the model will be calculated via a simple CAPM model.
| Table Of Assumptions | |
| (Current data) | |
| Equity Value | 566,340.00 |
| Debt Value | 731,372.00 |
| Cost of Debt | 2.16% |
| Tax Rate | 24.34% |
| 10y Treasury | 4.222% |
| Beta | 1.10 |
| Market Return | 10.50% |
| Cost of Equity | 11.13% |
| Net Income | 49,552.00 |
| Interest | 15,803.00 |
| Tax | 12,060.00 |
| D&A | 7,512.00 |
| EBITDA | 84,927.00 |
| D&A Margin | 5.14% |
| Interest Expense Margin | 10.82% |
| Revenue | 146,009.0 |
| CAPM | |
| Risk-Free Rate | 4.222% |
| Beta | 1.1 |
| Market Risk Premium | 6.228% |
| Required Rate of Return | 11.073% |
The first step is to fill in the variables of operating assets, and book value and then project them throughout the years. Starting with operating assets, I will subtract cash reserves and deposits from total assets. The reason for this is that the assets that generate cash are the book of loans, and deposits are the operating liability. The total operating assets came out at $70.83B. Meanwhile, book value stands at $327.87B. When put against revenue, this yields margins of 57.92% and 224.56% which will be used to estimate these two figures throughout the projection.
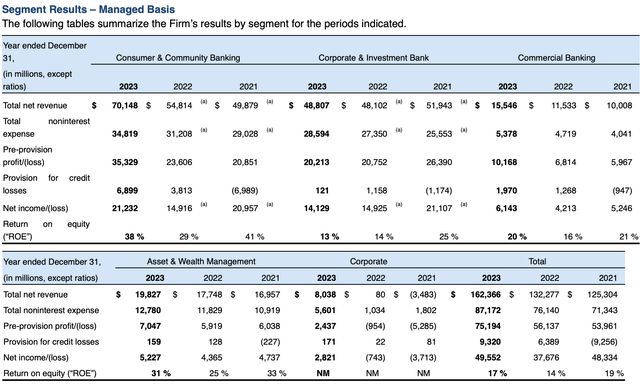
The second step is deducting how much each of those 500 new branches will add to revenue. The first thing to note is that these branches are strictly for consumer & community and commercial banking. JPMorgan is not going to open wealth management offices in a rural area, because the vast majority of the money is in big cities. Therefore, I will divide the 2023 Consumer & Community banking revenue of $70.14B and the commercial banking revenue of $15.54B by the 4,700 estimated branches JPMorgan Chase has. This division yields a result of $14.92M and $3.30M per branch respectively. Then, beyond 2027, the Consumer & Community, and commercial banking segments will grow at the estimated market rate of 1.44%.
Subsequently, the other segments concerning Corporate & Investment Bank and Asset & Wealth Management will grow at the pace of the overall market, 1.40% and 5.15% respectively. The reason for this is because the revenue generated in these segments is reliant on how good JPMorgan manages assets (in the case of wealth management) and how convenient would JPMorgan be (in the case of investment banking).
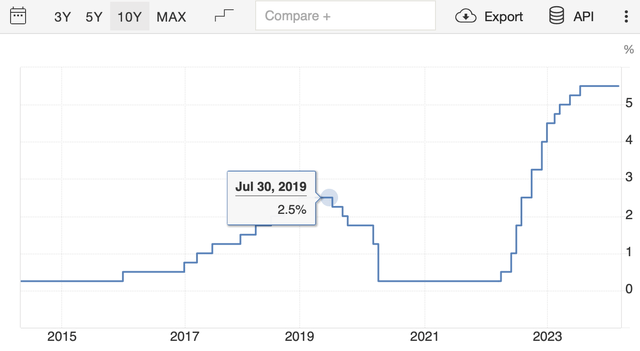
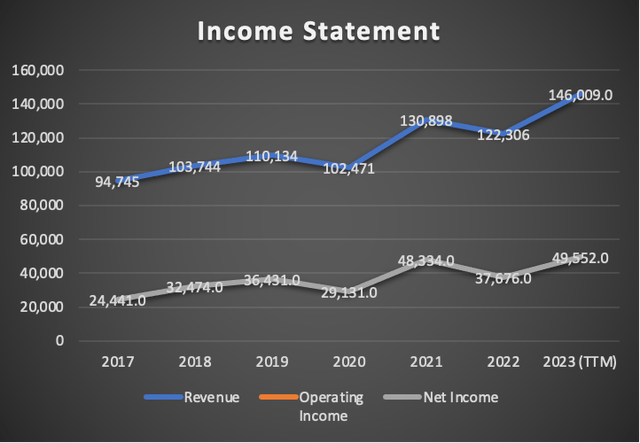
Next, I need to calculate net income. I will do it through net income margins. This will also indirectly lead to trying and predict future interest rates by the FED. For the year 2024, I expect that the FED go through with its rate cuts, which would lower JPM’s profitability and revenue because clients will pay less interest. The net income margin here is 29.29% because in 2019-2020 the net income margin was reduced by 4.65% and passed from 33.08% to 28.43%.
For the year 2025, I expect that lower interest rates will lead to increased consumption of loans which should cover the reduced interest income JPM will receive as a consequence of reduced interest rates. The net income margin here will be 33.94%, recovering the loss of 4.65%.
Next, I will put a 31.47% net income margin for 2026, which is in line with the 2017-2023 TTM.
However, now comes the real challenge, when is the FED going to hike interest rates again? Well, I will imply that the FED is going to hike rates by not that much in 2027, probably 2.25% (something close to what happened in 2019). The net income margin for this year will be 36.12%, up 4.65% as JPM’s revenue and profitability increase due to higher interest rates.
Additionally, because of this, I will also make revenue tumble by 7.27% in 2027 because this is the approximate change rate in JPM’s revenue in 2019-2020 when the FED lowered interest rates in 2019-2020 and when the FED increased interest rates in 2021-2022.
Then for 2028, the net income margin will fall to 31.47% due to slower consumption outpacing higher interest rate benefits. So for 2028, the Fed should reduce this hypothetical 2.25% interest rate.
Lastly, in 2029, the net income margin will increase to 33.94% as lower interest rates increase consumption and demand for JPM loans increase.
| Consumer & Community Banking | Corporate & Investment Bank | Commercial Banking | Asset & Wealth Management | Corporate | Total | |
| 2023 | 70,148.0 | 48,807.0 | 15,546.0 | 19,827.0 | 8,033.0 | 162,361.0 |
| 2024 | 72,013.0 | 49,490.3 | 15,959.4 | 20,848.1 | 2,277.0 | 160,587.8 |
| 2025 | 73,878.0 | 50,183.2 | 16,372.8 | 21,921.8 | 2,277.0 | 164,632.7 |
| 2026 | 75,743.0 | 50,885.7 | 16,786.1 | 23,050.7 | 2,277.0 | 168,742.6 |
| 2027 | 72,101.5 | 47,186.3 | 15,979.1 | 21,374.9 | 2,277.0 | 158,918.9 |
| 2028 | 73,139.7 | 47,846.9 | 16,209.2 | 22,475.8 | 2,277.0 | 161,948.7 |
| 2029 | 74,193.0 | 48,516.8 | 16,442.7 | 23,633.3 | 2,277.0 | 165,062.7 |
| Growth Rate % | 1.44% | 1.40% | 1.44% | 5.15% |
Finally, the model will also yield a future price for FY2029, which was calculated by taking the undiscounted residual earnings and then dividing them by the total common shares outstanding.
As you can see, the model suggests a fair price for JPMorgan of around $237.41 per share, which is a 20.7% upside from the current stock price of $196.60. Furthermore, for 2029, the model suggests a stock price of $407.06 which translates into a decent 17.8% annual return on top of the current 2.35% dividend yield.
How do my estimates compare with the average consensus?
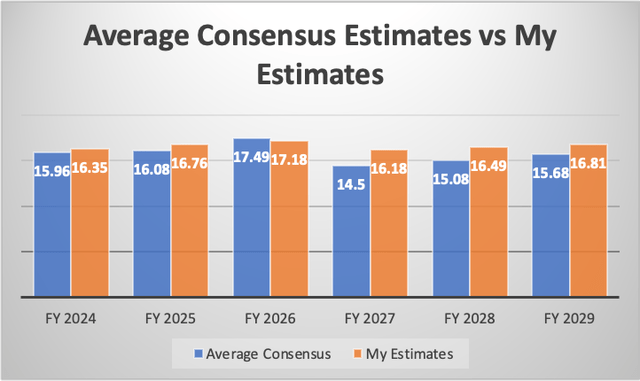
If I did a model solely based on average analysts’ estimates, I would get a fair price per share of $194.19, which indicates that there is a 1.2% downside from the current stock price of $196.6. The future price that would be suggested by this hypothetical model would be $331.06, which points towards annual returns of 11.4% throughout 2029.
In the graph below you can see how both results compare with each other. For FY2024, my estimates are around 2.44% higher, so it’s achievable. Then the other aspect you can see is that for FY2027, the average consensus indicates that EPS will decrease by around 17%, while mine points to 5.82%.
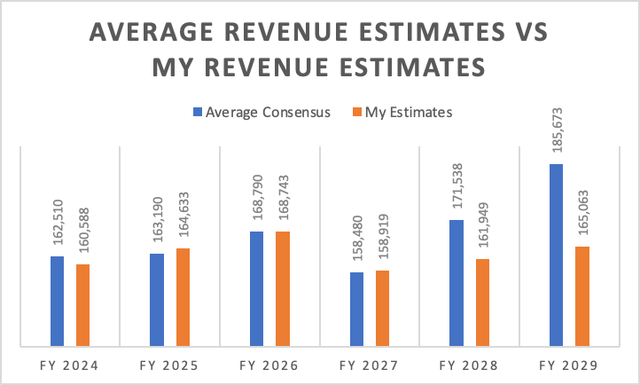
Now, in the table below you will be able to deduct that the cause is related to net income margins since my revenue estimates are lower than those of the average consensus by a significant margin.
| Average Net Income Margin Estimates | My Net income Margin Estimates % | |
| 2024 | 28.25% | 29.29% |
| 2025 | 28.35% | 33.94% |
| 2026 | 29.81% | 31.47% |
| 2027 | 26.32% | 36.12% |
| 2028 | 25.29% | 31.47% |
| 2029 | 24.30% | 33.94% |
Risks to Thesis
The main risk to my thesis is that JPMorgan’s plan to open 500 branches (mainly in rural areas) could go wrong because of the low population in the areas where JPMorgan will expand. However, it’s best to be the first, because if they achieve that, then other big banks will not see it as a profitable venture to enter rural areas.
Furthermore, banking is already a growth market which means that JPMorgan could potentially grow via M&As however since JPMorgan is already too big, regulators will prevent it.
I think that JPMorgan is better off in the banking landscape, since it has a reputation as a well-managed bank, during banking panics people would rush to put their money in a safer bank, and one of those is JPMorgan.
Conclusion
In conclusion, JPMorgan continues to be a very solid financial institution, it can cover around 58% of deposits, which is already excellent since during banking panics people are more prone to move their money to a big bank such as JPM.
The main risks include that the new 500 branches do not achieve the expected performance and become unprofitable. Nevertheless, since the expansion will target small population centers, being the first there will help make it unprofitable for competitors to enter the area.
The stock remains, according to my estimates, very undervalued, by around 20.7%, which implies that the fair price per share stands at 237.41. Additionally, the future price suggested by my model is around $407.06 which implies 17.8% annual returns throughout 2029. For these reasons, I maintain my “strong-buy” rating on JPM.
Analyst’s Disclosure: I/we have no stock, option or similar derivative position in any of the companies mentioned, but may initiate a beneficial Long position through a purchase of the stock, or the purchase of call options or similar derivatives in JPM over the next 72 hours. I wrote this article myself, and it expresses my own opinions. I am not receiving compensation for it (other than from Seeking Alpha). I have no business relationship with any company whose stock is mentioned in this article.
Seeking Alpha’s Disclosure: Past performance is no guarantee of future results. No recommendation or advice is being given as to whether any investment is suitable for a particular investor. Any views or opinions expressed above may not reflect those of Seeking Alpha as a whole. Seeking Alpha is not a licensed securities dealer, broker or US investment adviser or investment bank. Our analysts are third party authors that include both professional investors and individual investors who may not be licensed or certified by any institute or regulatory body.

