Summary:
- The collapse of Silicon Valley Bank has triggered a chain reaction throughout the financial sector, leading to a reassessment of risk across multiple institutions, resulting in increased volatility.
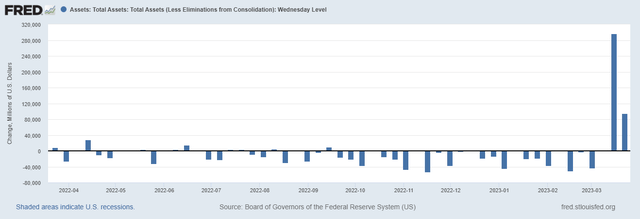
- Federal Reserve (Fed) also injects $390 billion of liquidity into the financial system to prevent a widespread financial crisis.
- JPMorgan’s price level of $100.54 marks a strong buying opportunity based on the emergence of ascending broadening wedge and rising channel.
winhorse
Financial markets have shifted to a risk-off sentiment as the collapse of Silicon Valley Bank (OTC:SIVBQ) has triggered a chain reaction throughout the financial sector. This has led to a swift reassessment of risk across multiple institutions, which are now facing exposure to significant losses. The surge in interest rates last year has left financial and real estate assets overvalued on the balance sheets of many institutions, making them vulnerable to equity losses. As a result, the financial markets are experiencing significant volatility, with many investors adopting a cautious approach to managing portfolios.
As a major player in the financial sector, JPMorgan (NYSE:JPM) is likely to be impacted by the shift in financial markets towards a risk-off sentiment and the increased volatility resulting from the collapse of SIVBQ and the reassessment of risk across multiple institutions. Although the financial crisis persists, JPMorgan’s financial stability and proven record of effective risk management indicate that the bank is well-equipped to overcome these challenges. This article focuses on the impact of SIVBQ’s collapse on the financial markets, current financial performance, and a technical market analysis aimed at providing insight into the potential long-term direction of JPMorgan’s share price for long-term investors. Despite the challenges posed by the Covid-19 pandemic, JPMorgan has sustained its position as a leading global bank, generating robust financial performance. Moreover, technical analysis suggests that the stock’s behavior has been positive but volatile, with the presence of ascending broadening wedges indicating a bullish long-term perspective.
Recent Development in Financial Markets
The financial instability of the United States can be observed by using the ICE BofAML MOVE Index which is trading above 150. The move index measures the bond market volatility and trading above 150 indicates a high level of market stress and uncertainty.
BofAML Mode Index (tradingview.com)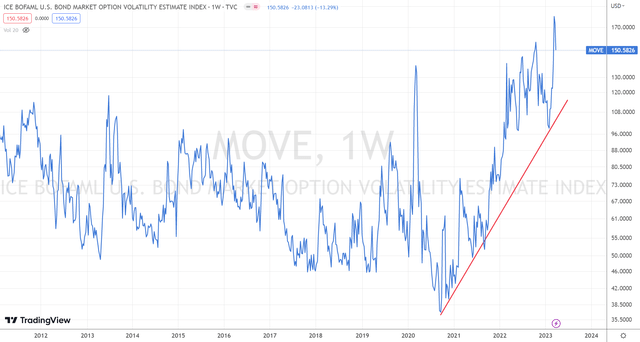
There are lingering worries that the rescue plan for uninsured depositors of SIVBQ may not be replicated for other financial institutions in the future. This has sparked concerns that there could be a mass exodus of significant depositors from regional banks. However, to stabilize the financial markets, Wall Street banks such as Bank of America Corporation (BAC), JPMorgan, and Goldman Sachs Group, Inc.(GS) have stepped in. These financial giants have benefited from the recent downturn of regional banks and have pledged to deposit $30 billion with the troubled First Republic Bank, which has been experiencing a significant outflow of depositors following the SIVBQ’s collapse.
JPMorgan’s reaction to depositing $30 billion with First Republic Bank will help stabilize the bank and prevent further outflows of depositors. This move will also boost investor confidence in JPMorgan and the other participating banks, which attract new business and investors. By taking advantage of the current situation, JPMorgan’s position as a key player in the financial industry potentially increases profits in the long run.
On the other hand, the Federal Reserve (Fed) has introduced a Bank Term Funding Program (BTFP) to help alleviate financial strain on banks. Under the BTFP, the Fed will lend money against prime collateral, such as Treasuries and RMBS, at par value, which is expected to exceed their current market value. The program will be in effect for up to one year, allowing banks to hold onto assets until they mature, thus allowing them to recognize losses over time instead of experiencing huge write-downs similar to what occurred in the case of Silicon Valley Bank. This measure aims to protect the banks’ capital and minimize the impact of market fluctuations on financial stability.
The Fed also injects $391 billion of liquidity into the financial system to prevent a widespread financial crisis as shown in the chart below. In my opinion, there is a lot more liquidity injections by Fed in near future. JPMorgan would probably benefit from the increased liquidity in the financial system because it would have easier access to cash and loans.
There is a significant increase in the amount of money borrowed by commercial banks as shown in the chart below. The sources of these borrowings are primarily from Fed and the Federal Home Loan Banks (FHLB). The increase in borrowings from these institutions also suggests that commercial banks are facing liquidity challenges. The contraction in deposits indicates a decrease in customer confidence or a shift in investment preferences away from bank deposits. The chart below implies that commercial banks are relying more heavily on borrowing to maintain operations and that they may be facing challenges in attracting deposits from customers.
Borrowing and Deposits for All Commercial Banks (fred.stlouisfed.org)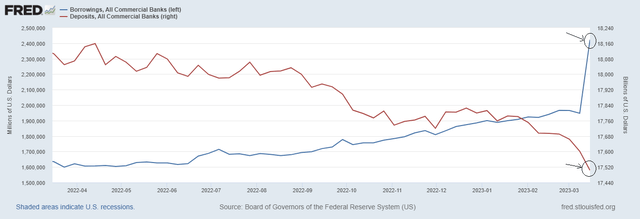
Financial Stability of JPMorgan
Despite the failure of SIVBQ and the resulting crisis in the banking industry, JPMorgan’s financial strength positions it to weather the current storm. According to JPMorgan’s income statement, the bank generated $122.30 billion in revenue in 2022, representing a decrease from the $130.89 billion generated in 2021. The decrease in JPMorgan’s revenue in 2022 was primarily attributed to a decline in total non-interest income, which fell from $69.33 billion in 2021 to $61.98 billion in 2022. The chart below illustrates JPMorgan’s revenue trend from 2013 to 2022, indicating a slightly positive trend. In 2021, the bank experienced significant revenue growth of 27.73%, with total revenue increasing from $102.47 billion in 2020 to $130.89 billion in 2021, driven by a surge in capital markets activity, including record IPOs and SPACs. The consumer banking sector, which includes mortgages, credit cards, and auto loans, also performed well in 2021, contributing significantly to the strong revenue. However, the total non-interest operating expenses increased from $70.91 billion to $75.87 billion between 2021 and 2022. The primary cause of the rise in non-interest operating expenses was high inflation, which leads to higher prices for goods and services such as wages, rent, and other expenses.
JPMorgan Revenue (seekingalpha.com)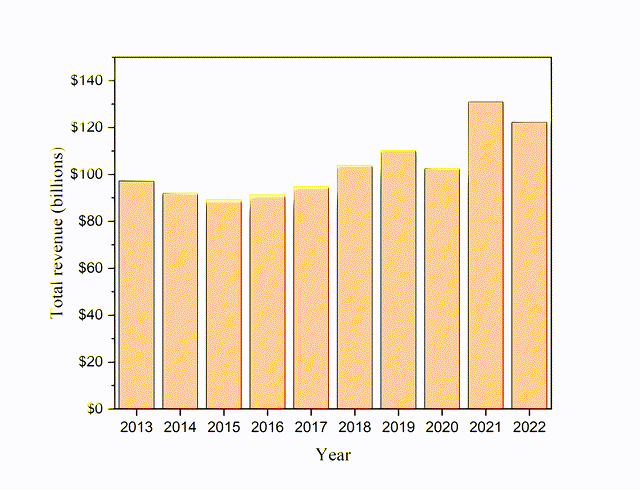
The income statement and balance sheet demonstrate JPMorgan’s capacity to manage its assets and liabilities effectively, generate strong revenue growth, and maintain a solid capital position in the global market. Despite the challenges posed by the Covid-19 pandemic, JPMorgan has sustained its position as a leading global bank and continued to perform well. The bank’s dedication to operational excellence and risk management, along with its focus on innovation and technology, has enabled it to confront the ongoing financial crisis effectively
Volatile Ranges and Bullish Perspective
Although JPMorgan’s financial performance is robust, technical analysis suggests that the price behavior is positive and strongly bullish after the Covid-19 pandemic. The monthly chart for JPMorgan presents the emergence of ascending broadening wedges. The first wedge spanned from the lows of $20.34 in 2011 to the high of $166.44 in 2021. Its lower line is marked by three bottoms, with the first at $22.83, the second at $43.10, and the third at $70.11. The presence of a strong level of support at $100.54 may represent the fourth bottom of this wedge in the event of a substantial decline in JPMorgan. The bank’s strength is evidenced by the 718.29% increase in the share price from $20.34 to $166.44. The second ascending broadening wedge is observed within the first wedge, formed from the 2016 lows of $43.10 towards the 2021 highs of $166.44, with the price increasing by 286.17%. The most recent support level for JPMorgan’s price is indicated by the blue wedge at $100.54. The increased volatility in the stock market due to economic instability has given rise to the ascending broadening wedge pattern. This pattern suggests indecision or uncertainty among market participants and is characterized by widening price ranges.
JPMorgan Monthly Chart (stockcharts.com)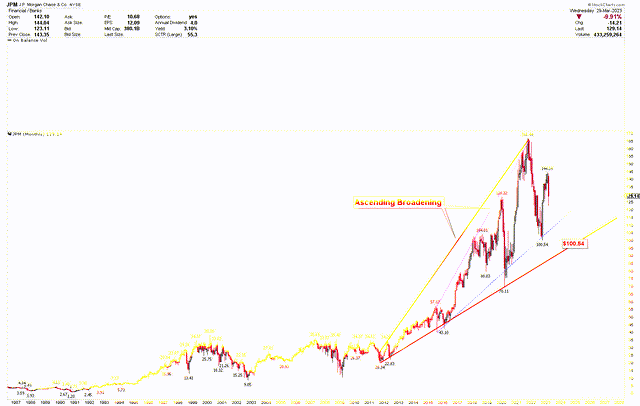
The following logarithmic chart compresses large price movements into a more manageable format, revealing a powerful bullish trend in JPMorgan’s price. The market’s bullish momentum is further supported by the emergence of inverted head-and-shoulder patterns. These patterns have been observed historically during periods of consolidation, such as from 1986 to 1993, when a breakout from the red neckline in February 1993 drove the price to $38, resulting in a 3077.26% increase from the lows of $1.196 in 1990. Following a prolonged consolidation period after reaching a peak of $38, another inverted head and shoulder pattern emerged, marked by blue, with a neckline at $35, which represents a long-term support point for investors. In January 2013, prices increased further within the red rising channel after a breakout from the $35 neckline.
JPMorgan Monthly Chart (stockcharts.com)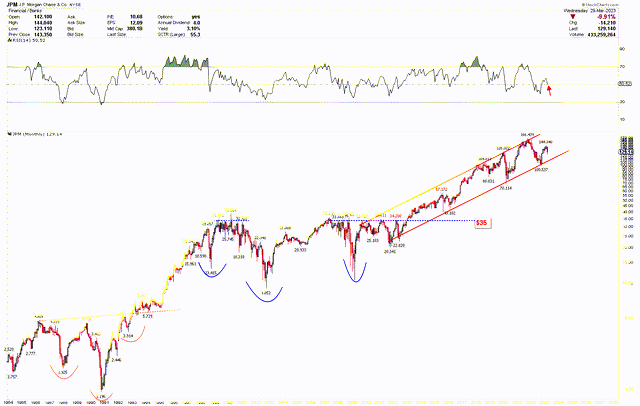
JPMorgan’s current price is within a bullish trading channel that originated from the 2011 low of $20.34. At present, the price has reached the level of $100.54 within this channel. The ascending broadening wedge depicted in the earlier chart is supporting the price at the same level, making it a favorable buying opportunity for long-term investors. The logarithmic chart displays a clearer long-term outlook of JPMorgan, neutralizing the volatility of the linear chart. The bullish trend of JPMorgan remains robust due to the combination of an inverted head-and-shoulders pattern and a rising channel. Additionally, the bullish pressure is evident as the RSI continues to remain above 50. In the event of a significant decline in the stock price due to increased financial risk, the $35 level is another strong support level that investors should consider for long-term investment.
Key Actions for Investors
JPMorgan’s long-term outlook is bullish, and the current market conditions present a buying opportunity for investors. The weekly chart for JPMorgan presents a double bottom at the long-term support of $100.54, which was confirmed when the price broke through the $120 mark, as shown in the chart below. The breakout was strong, and prices have since risen above $140. The emergence of bullish divergence, indicated by the blue lines in the chart, further bolsters the bullish outlook. This divergence suggests that selling pressure has decreased, and buyers have entered the market.
Although the price has reached the resistance level, it is currently testing the support level of $120, which is a potential buying opportunity. In summary, the region between $100.54 and $120 presents an excellent entry point for long-term investors to buy.
JPMorgan Weekly Chart (stockcharts.com)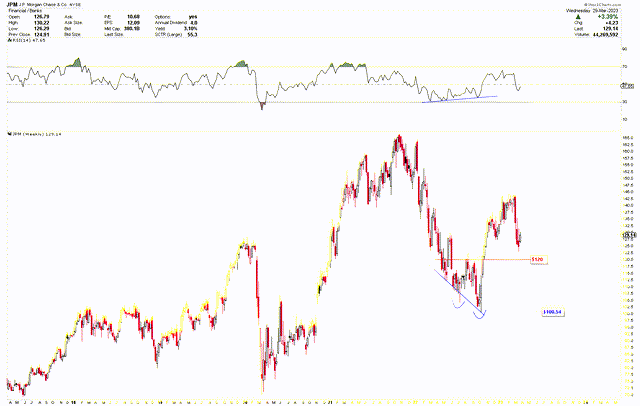
Risks
The banking industry is facing negative investor sentiment and significant earnings volatility, leading to uncertainty about the stability of banks. The extent of the pressure on earnings depends on the asset mix and funding base of each bank. In the upcoming weeks and months, the stock prices of banks may experience more volatility, and there is a possibility that valuations could decline further before improving.
The technical chart of JPMorgan reflects the uncertainty in the market through the presence of ascending broadening wedges, which are indicative of high market volatility. Although $100.54 presents a compelling buy level, a monthly close below this threshold could elevate the risk of further decline and panic among investors. However, any panic will be short-lived and will be followed by the next upward move in the market.
Bottom Line
In conclusion, the collapse of SIVBQ has triggered a risk-off sentiment in financial markets, leading to a reassessment of risk across multiple institutions and increased volatility. However, JPMorgan’s financial stability suggests that the bank is well-equipped to overcome these challenges. The bank’s deposit of $30 billion with First Republic Bank will help stabilize the bank and prevent further outflows of depositors, boosting investor confidence. The Fed’s BTFP will also help alleviate financial strain on banks, protecting capital and minimizing the impact of market fluctuations on financial stability. Commercial banks are facing liquidity challenges, as indicated by the increase in borrowing from the Fed and the FHLB. However, JPMorgan would benefit from the increased liquidity in the financial system because it would have easier access to cash and loans. The technical analysis suggests a strongly bullish long-term perspective for JPMorgan in the form of an inverted head and shoulders. The chart patterns indicate that any drop in JPMorgan’s price is considered as a buying opportunity. Investors with a long-term perspective consider the strong support level at $100.54 as a favorable buying opportunity due to the emergence of the ascending broadening wedge.
Disclosure: I/we have no stock, option or similar derivative position in any of the companies mentioned, and no plans to initiate any such positions within the next 72 hours. I wrote this article myself, and it expresses my own opinions. I am not receiving compensation for it (other than from Seeking Alpha). I have no business relationship with any company whose stock is mentioned in this article.

