Summary:
- The share prices of regional U.S. banks crashed on Monday: while First Republic Bank fell by 60%, Western Alliance decreased by about 45%.
- Today, those banks have rebounded: First Republic Bank has been up by almost 50% and Western Alliance has seen a rise of approximately 40%.
- Larger U.S. banks, such as JPMorgan, have been much less volatile during this time of high volatility in the Banking Sector.
- In this article, I will take a look at JPMorgan’s Fundamentals and its current Valuation and will compare it to its peer group in order to discuss my buy rating.
subman
Investment Thesis
As a consequence of Signature Bank (SBNY) and SVB Financial Group (SIVB) collapsing, the stock prices of U.S. regional banks decreased significantly on Monday: First Republic Bank (FRC) fell 60%, Western Alliance (WAL) decreased by 45% while KeyCorp (KEY) and Comerica (CMA) both dropped by about 30%. The opposite was the case during today’s recovery of the Banking Sector: First Republic Bank has gone up by almost 50% while Western Alliance has seen a rise of approximately 40%.
On the other hand, larger U.S. banks, such as JPMorgan (NYSE:JPM) were much less affected and have proven to be far less volatile in comparison to these smaller regional U.S. banks.
In today’s article, I will have a look at JPMorgan’s current Valuation and will compare its Fundamental Data to its competitors such as Bank of America (BAC), Wells Fargo (WFC) and Citigroup (C).
I consider JPMorgan’s current Valuation to be attractive and different metrics show that the bank is superior in comparison to its peer group when it comes to Profitability and Growth.
I also consider the risk for JPMorgan investors to be lower. The bank’s A1 credit rating by Moody’s, its high Return on Equity of 13.69% and its high Net Income Margin of 30.80% serve as indicators that the risk of investing in JPMorgan is significantly lower than when investing in some of its competitors. All of this contributes to my current buy rating for the company’s stock.
JPMorgan’s Performance within the past 5 years
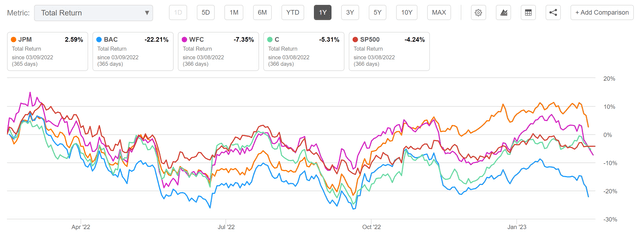
Within the past 12-month period, JPMorgan has slightly outperformed the S&P 500 and its competitors from the Diversified Banks Industry: while JPMorgan has shown a Total Return of 2.34%, the Total Return of the S&P 500 has been negative (-4.24%). Competitors such as Bank of America (Total Return of -22.38%), Wells Fargo (-7.51%) or Citigroup (-5.45%) have also shown negative results. I think JPMorgan’s performance within the past 12-month period reflects the bank’s broad and diversified product portfolio and, in addition, its resistance to crisis.
The Valuation of JPMorgan
I consider the U.S. bank JPMorgan to currently be undervalued. The reason for this is that its P/E [FWD] Ratio of 10.76 is 13.29% below its P/E [FWD] Ratio from over the past 5 years (12.41), thus helping confirm my theory that the bank is currently undervalued.
It can be highlighted that, with a P/E [FWD] Ratio of 10.76, JPMorgan’s Valuation is slightly higher than competitors such as Bank of America (9.57) or Wells Fargo (9.33). However, its Valuation is lower than its Canadian competitors such as Royal Bank of Canada (RY) (P/E [FWD] Ratio of 12.31) or The Toronto-Dominion Bank (TD, TD:CA) (11.63).
JPMorgan’s Price / Book [FWD] Ratio of 1.43 is above the Sector Median of 1.10, but 6.95% below its Average Price / Book [FWD] Ratio over the past 5 years. Moreover, JPMorgan’s Price / Book [FWD] Ratio is higher than U.S. competitors such as Bank of America (Price / Book [FWD] Ratio of 1.08) or Wells Fargo (1.06). However, it is lower than that of Canadian banks such as Royal Bank of Canada (Price / Book [FWD] Ratio of 1.82) or The Toronto-Dominion Bank (1.45).
In my opinion, JPMorgan should be rated with a premium when compared to its competitors, particularly due to its broad product portfolio and its resistance to crisis. For these reasons, and due to the fact that both its current P/E [FWD] Ratio of 10.76 and its Price / Book [FWD] Ratio of 1.43 are below its Average from over the past 5 years, I consider the bank to currently be undervalued and therefore it receives my buy rating at this moment in time.
JPMorgan’s Fundamentals
JPMorgan’s Net Income Margin [TTM] of 30.80% is 13.28% higher than the Sector Median of 27.19%, which serves as an indicator of the strong Profitability of the U.S. bank.
Furthermore, it can be highlighted that JPMorgan’s Net Income Margin of 30.80% is higher than that of Bank of America (which has a Net Income Margin of 29.79%) and significantly above Wells Fargo (18.25%) or Citigroup (21.04%). This indicates that JPMorgan is the better fit in terms of Profitability when compared to those competitors.
JPMorgan’s Return on Equity of 13.69% is also significantly above the Sector Median of 11.19%, once again, highlighting the bank’s strong Profitability when compared to its peer group. Furthermore, its Return on Equity is above that of its peers such as Bank of America (10.13%), Wells Fargo (6.93%) or Citigroup (7.50%).
JPMorgan is also in front of its competitors when it comes to Growth: its Revenue 5 Year [CAGR] is 5.24%, while Bank of America’s is 1.99%, Wells Fargo’s is -3.42% and Citigroup’s is 1.57%. JPMorgan’s Revenue 5 Year [CAGR] is also above that of the Royal Bank of Canada (4.26%). Only the Toronto-Dominion Bank is in front of JPMorgan (7.09%) when considering Growth.
JPMorgan’s strong results both in terms of Profitability and Growth, once again support my theory to currently rate the bank as a buy.
The companies’ Dividend and Dividend Growth
JPMorgan’s Dividend Yield [FWD] is currently 2.89%, which lies 0.74% above its Average P/E [FWD] Ratio over the past 5 years. This serves as an additional indicator that the bank is currently undervalued.
In addition to that, JPMorgan has shown a Dividend Growth Rate 10Y [CAGR] of 16.09%, which stands 106.44% above the Sector Median of 7.79%. Moreover, the bank has shown an EBIT Growth [FWD] of 5.31%, standing 72.59% above its Average EBIT Growth Rate [FWD] of 3.08%.
The fact that JPMorgan offers investors an attractive Dividend Yield [FWD] of 2.89% in combination with an attractive Dividend Growth Rate (as mentioned previously, the bank has shown a Dividend Growth Rate 10Y [CAGR] of 16.09%) contributes significantly to my own buy rating for the company.
The Projection of JPMorgan’s Yield on Cost
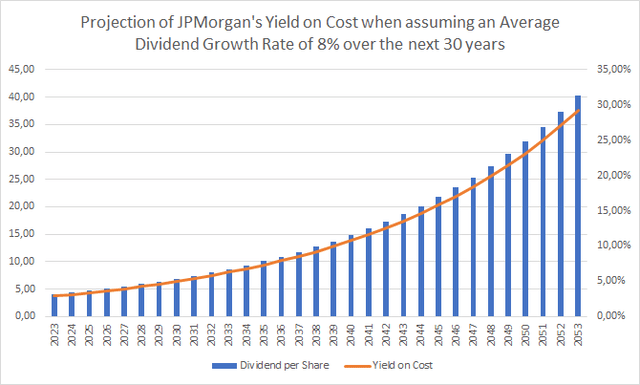
Below you can find a projection of JPMorgan’s Dividend per Share and its Yield on Cost. For this projection, I have assumed an Average Dividend Growth Rate of 8% for the company, which demonstrates that investors can achieve an attractive Yield on Cost when investing with a long investment-horizon.
Assuming this Average Dividend Growth Rate of 8% and when assuming that the company is acquired at its current stock price of $137.80, a Yield on Cost of 6.27% can be expected in 2033, while 13.53% can be expected in 2043 and 29.21% in 2053. Below you can find a graphic that illustrates the projection of JPMorgan’s Dividend per Share and its Yield on Cost.
JPMorgan according to the Seeking Alpha Dividend Grades
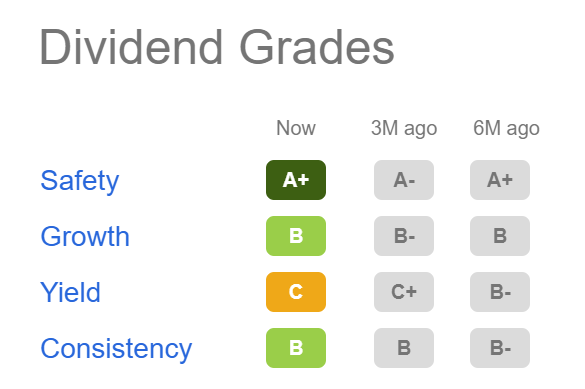
The Seeking Alpha Dividend Grades confirm JPMorgan’s solid Dividend. The bank currently receives an A+ for Dividend Safety and a B for both Dividend Growth and Dividend Consistency. In terms of Dividend Yield, the bank gets a C rating.
Source: Seeking Alpha
Risks
I consider the risk of investing in JPMorgan to be lower than investing in most other banks. My theory is underlined by the metrics that I will describe below.
JPMorgan’s 60M Beta of 1.10 is lower than those of competitors such as Bank of America (60M Beta of 1.41), Wells Fargo (1.17) or Citigroup (1.59). This provides an indication that the risk of investing in JPMorgan is lower than the risk of investing in one of these competitors based on volatility.
Furthermore, JPMorgan’s current Payout Ratio of 33.11% is lower than the ones of Canadian competitors such as Royal Bank of Canada (Payout Ratio of 44.31%) or Toronto-Dominion Bank (42.23%), indicating, once again, that the risk of investing in JPMorgan is lower when compared to these peers. A low Payout Ratio is an indicator that there is plenty of room for future Dividend enhancements. On the opposite, a high Payout Ratio increases the chances of a Dividend cut, which, consequently, can have strong negative impacts on the price of the company’s stock. Therefore, the lower Payout Ratio of JPMorgan when compared to some of its competitors, can be interpreted as a sign that the risk of investing in the company is lower in comparison to its peers.
JPMorgan’s higher Net Income Margin of 30.80% when compared to its peer group can serve as an additional indicator that the risk of investing in the bank is lower than an investment in its competitors, since it shows that JPMorgan is the slightly better pick in terms of Profitability.
However, a recession could also have significant effects on JPMorgan’s business. JPMorgan’s 60M Beta of 1.10 shows this, indicating that the risk of investing in the bank might be higher than the risk of investing in the broader stock market, even though it is significantly below the risk of investing in its competitors, as was shown before.
Due to the current market environment and the high volatility in the Banking Industry, I strongly suggest investing with a long-investment-horizon when aiming to invest in JPMorgan. I also advise that you don’t speculate over the short term due to the not yet foreseeable consequences that could still result from the collapses of Signature Bank and SVB Financial Group: in the short term, major price fluctuations are also conceivable for JPMorgan in the coming days and weeks.
The Bottom Line
I currently consider JPMorgan to be undervalued. One of the reasons for this is its P/E [FWD] Ratio of 10.76 being 13.29% below its Average from the past 5 years (12.41).
In addition to that, JPMorgan’s Price / Book [FWD] Ratio of 1.43 is 6.95% below its Average Price / Book [FWD] Ratio from over the past 5 years, indicating once again that the company is undervalued at its current price levels.
The bank is ahead of its competitors when it comes to Profitability and also Growth: while JPMorgan shows a Net Income Margin of 30.80% and a Revenue 5 Year [CAGR] of 5.24%, Bank of America’s (Net Income Margin of 29.79% and Revenue 5 Year [CAGR] of 1.99%), Wells Fargo’s (18.25% and -3.42% respectively) and Citigroup’s (21.04% and 1.57% respectively) Margins and Growth Rates are significantly lower.
At this moment in time, JPMorgan receives my buy rating, particularly due to the bank’s attractive Valuation, its strong Profitability, the mix between an attractive Dividend Yield [FWD] (2.89%) and an appealing Dividend Growth Rate (Dividend Growth Rate 10Y [CAGR] of 16.09%) that it provides investors with, as well as its wide economic moat.
Author’s Note: What is your opinion on JPMorgan’s current Valuation? Do you consider the bank to be a buy/hold or sell? Do you already own the stock or plan to acquire it?
Disclosure: I/we have a beneficial long position in the shares of JPM, BAC, WFC, BRK.B either through stock ownership, options, or other derivatives. I wrote this article myself, and it expresses my own opinions. I am not receiving compensation for it (other than from Seeking Alpha). I have no business relationship with any company whose stock is mentioned in this article.


