Summary:
- JPMorgan Chase has outlined strong shareholder performance since late 2022, but the high odds of a recession in 2024 suggest oversized loan default risk is approaching.
- The pattern of cash yield fluctuations for equities, including JPMorgan vs. 1-year Treasury rates starting in October has predated recessions by roughly 6-9 months since 2000.
- Valuations for JPMorgan resemble the 2000, 2008, and 2020 periods right before recession.
- Insider sales and waning momentum in the stock rally are additional concerns, leading me to downgrade my rating to Sell.
wildpixel
I was super-bullish on JPMorgan Chase (NYSE:JPM) in September 2022 here. Since then, the nation’s largest bank has been an industry leader for shareholder performance out of the U.S. money center financials. Had you followed my suggestion, a total return gain of +73% has more than doubled the equivalent-period S&P 500 worth advance of +34%, without owning any direct Big Tech exposure.
Seeking Alpha – Paul Franke Article, JPMorgan Chase, September 26th, 2022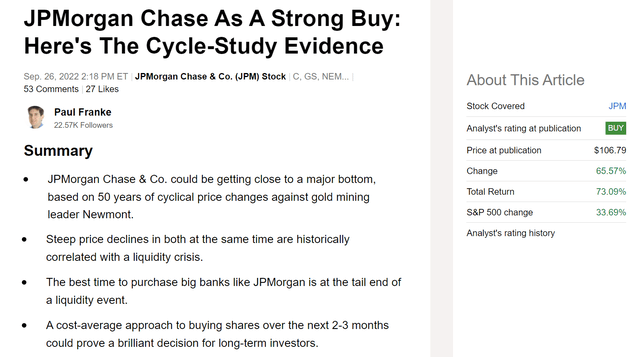
However, things change, especially in the volatile U.S. equity market. My current view is banks in general should be avoided going into a recession. My research and experience of over 37 years in the market indicate the abnormally high recession odds of 75% for 2024, a function of tightening credit conditions like M2 money supply and net bank credit in the financial system, plus the still-inverted Treasury yield curve.
Consequently, I believe selling JPMorgan on its new all-time highs in January makes plenty of sense. At the very least, I would avoid putting new capital to work until a significant Wall Street selloff hits the banking sector. I am moving my Buy rating down to Sell, mainly because of default risk in its loan portfolio (to the same degree as other large U.S. banks). Asset write-offs during economic downturns are a normal response to financial system stresses, as overburdened business/consumer borrowers stop making payments. So, earnings and book values may be overstated currently for the whole sector.
Share Price Peaks Before Recession
Believe it or not, the whole background picture for cash yield fluctuations from JPMorgan, the S&P 500, and Treasury bond market looks eerily similar to past patterns right before the extended dotcom bust recession of 2000-2003 and 2008-09 Great Financial Crisis. And, for timing a more exact top in JPMorgan, a turn lower in the 1-year Treasury rate since October may be our warning signal to get lost and sell shares.
Specifically, with nominal Treasury rates (close to 5%) far above prevailing stock market dividend distribution yields (1.4% S&P 500 and 2.3% JPM), liquidity conditions for investors are worsening for a trend. Our clue of impending trouble comes after a multi-year rise in short-term interest rates rolls over. In terms of a coincidental indicator, major recessions followed several quarters later (marked with green arrows below in 2000 and 2008). Measured from the October 2023 peak in 1-year bond rates this cycle, an economic downturn should appear before the end of May. Standard Wall Street lore is stocks tend to discount future events by 3-6 months, meaning JPMorgan should be topping any day now.
I will also note the 2019 peak in Treasury rates around a similar yield level to both JPMorgan and the S&P 500, did successfully warn of the trouble that hit in March 2020 on the COVID pandemic economic shutdown.
YCharts – JPMorgan Chase Dividend Yield vs. SPDR S&P 500 & 1-Year Treasury, Since 1995, Recessions Shaded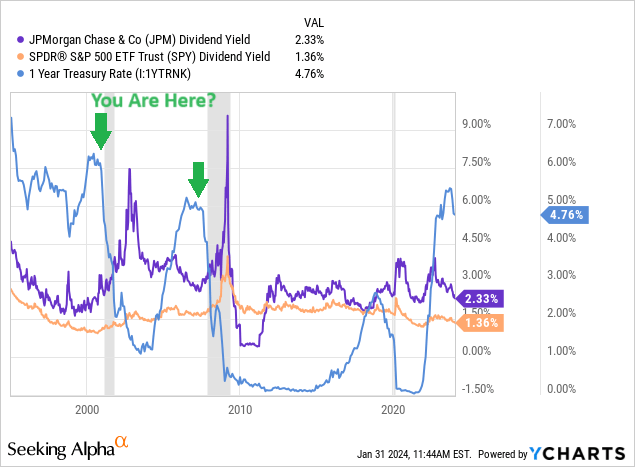
While I cannot guarantee another monster selloff is next for the JPM share quote, statistically speaking, recession performance is something all owners need to consider in their decision process. On the graph below you can review the -60% stock price decline between the middle of 2000 and 2003, alongside the -50% drop from late 2007 to early 2009. The pandemic crash in 2020 amounted to -40% in losses measured from the start of January to April.
YCharts – JPMorgan Chase, Share Price Changes, Since 1995, Recessions Shaded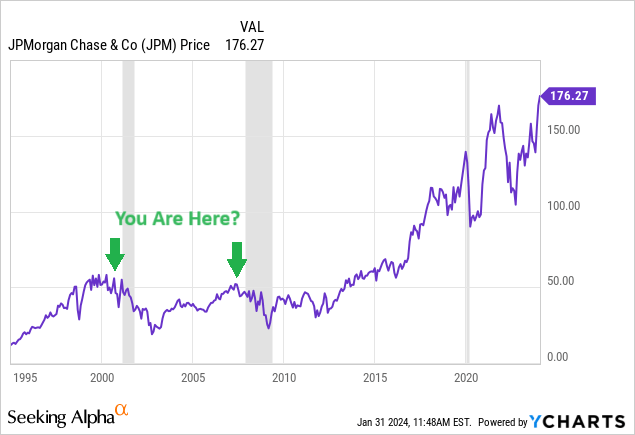
History Repeat – Valuation Setup
When we review valuations, the current JPMorgan ratios on earnings and sales appear to be quite similar to 2000 and 2008. I have circled in green the low P/Es of 9x to 10x at past cycle peaks, with price to sales far lower than today (which is a bad thing for share buyers in January 2024). The present 3.3x multiple on trailing revenue is far above the 3x peak in 2007 and readings as low as 2x in 2000 (circled in green). Price to earnings of 14x and sales of 3.9x predated the 2020 pandemic recession. Ironically, financials can be the most confusing to trade at business cycle turns. The best time to purchase banks often comes after recession when P/Es are highest, with intelligent selling done when P/Es are low, usually in the single digits!
YCharts – JPMorgan Chase, Price to Earnings & Sales Ratios, Since 1995, Recessions Shaded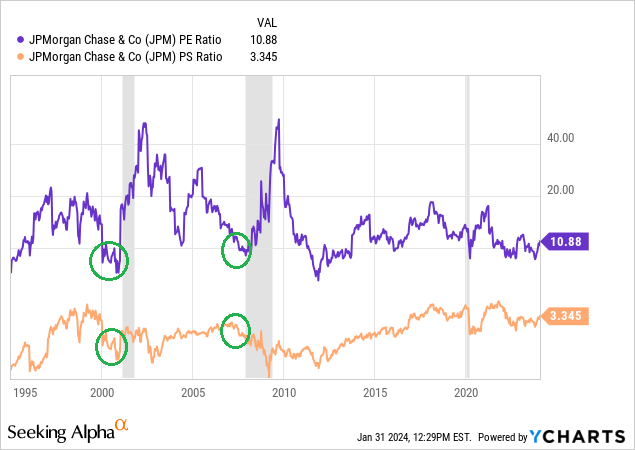
More bad news is Wall Street analysts are already projecting stagnate growth in the operating business during 2024-26. Remember, these “optimistic” estimates are assuming a soft-landing or no-landing scenario is our future. If and when a recession hits this year, a material drop in both earnings and sales is likely.
Seeking Alpha Table – JPMorgan Chase, Analyst Estimates for 2024-26, Made January 30th, 2024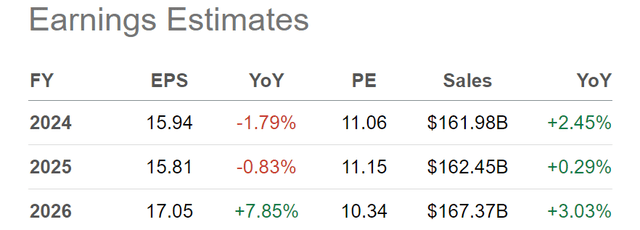
Lastly, the price to book value ratio of 1.7x is running higher than 2007-08 (1.5x), but below the numbers of 1999-2000 (greater than 3x). For newbies in the market over the last decade, you may not be aware of the fact the major banks have a history of trading UNDER book value during recessions, before bottoming and reversing higher. Book values below 1.0x were also common for major banking institutions during the 1970s and 1980s. For sure, the 1.8x P/BV reading of January 2020 did not support price when the pandemic showed up. All told, considerable “risk” of a bearish share move exists in 2024 with book value of 1.7x going into a potentially sizable economic slowdown.
YCharts – JPMorgan Chase, Price to Book Value, Since 1995, Recessions Shaded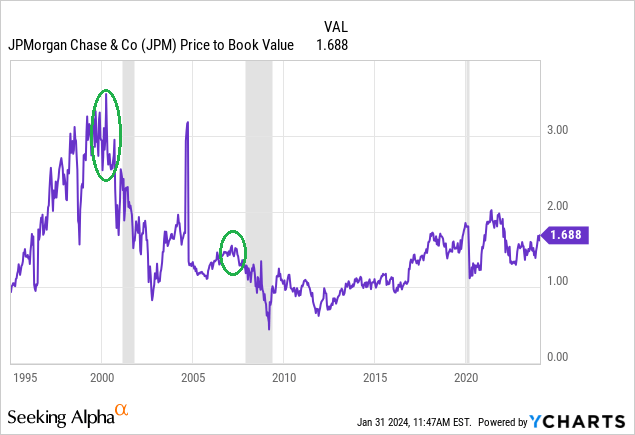
Final Thoughts
Insider sales have been steady over the last 12 months, including a November transaction by CEO Jamie Dimon. I would not term the net selling as extraordinary, but clearly managers at JPMorgan are getting nervous about oversized price gains.
Nasdaq.com – JPMorgan Chase, Insider Transactions, 12 Months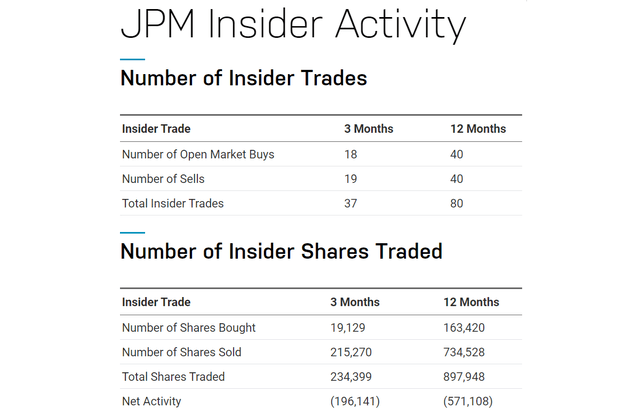
Another point of concern is the stock chart of daily buying/selling activity seems to highlight waning momentum in the rally. The amazing technical trading strength during November-December 2023 has faded rather quickly in January. For example, the Negative Volume Index (looking at net price action on lower volume days) topped in early January. On Balance Volume (price times volume change plotted cumulatively daily) has not confirmed the price gains in January. And, the 14-day Money Flow Index oscillator is nowhere near the heavy accumulation readings of late November.
StockCharts.com – JPMorgan Chase, 2 Years of Daily Price & Volume Changes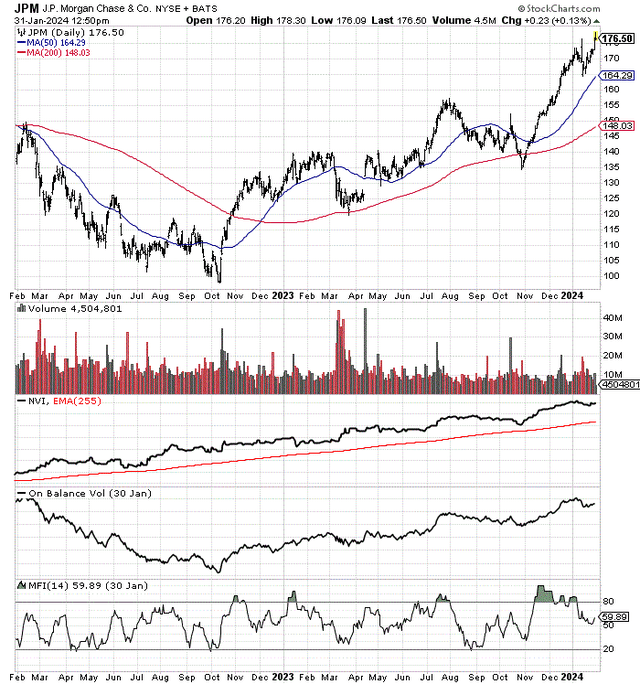
My overall opinion is that JPM is reaching for a share price peak in January-February. Price targets? I do not have any specific target numbers, based on sales, book value, or earnings valuations. Predicting bank quotes is a truly imperfect science when panic selling appears. I will say the average drawdown during and after the last three recessions (2000, 2008, 2020) was close to -50%. Such a drop would take JPMorgan Chase back to $90 a share, and its lowest quote since 2017.
My conclusion is selling some of your JPM position or avoiding the stock altogether may be the smartest way forward. I don’t see the company’s 2.3% dividend yield supporting the stock at all with inflation rates of 3% to 4% this year. Waiting for a meaningful and scary selloff seems the prudent way to play this name in the first half of 2024 if you are interested in owning perhaps the leading bank name in the world. I am downgrading my rating to Sell for a 12-month outlook.
Thanks for reading. Please consider this article a first step in your due diligence process. Consulting with a registered and experienced investment advisor is recommended before making any trade.
Analyst’s Disclosure: I/we have no stock, option or similar derivative position in any of the companies mentioned, and no plans to initiate any such positions within the next 72 hours. I wrote this article myself, and it expresses my own opinions. I am not receiving compensation for it (other than from Seeking Alpha). I have no business relationship with any company whose stock is mentioned in this article.
This writing is for educational and informational purposes only. All opinions expressed herein are not investment recommendations and are not meant to be relied upon in investment decisions. The author is not acting in an investment advisor capacity and is not a registered investment advisor. The author recommends investors consult a qualified investment advisor before making any trade. Any projections, market outlooks, or estimates herein are forward-looking statements based upon certain assumptions that should not be construed as indicative of actual events that will occur. This article is not an investment research report, but an opinion written at a point in time. The author's opinions expressed herein address only a small cross-section of data related to an investment in securities mentioned. Any analysis presented is based on incomplete information and is limited in scope and accuracy. The information and data in this article are obtained from sources believed to be reliable, but their accuracy and completeness are not guaranteed. The author expressly disclaims all liability for errors and omissions in the service and for the use or interpretation by others of information contained herein. Any and all opinions, estimates, and conclusions are based on the author's best judgment at the time of publication and are subject to change without notice. The author undertakes no obligation to correct, update or revise the information in this document or to otherwise provide any additional materials. Past performance is no guarantee of future returns.
Seeking Alpha’s Disclosure: Past performance is no guarantee of future results. No recommendation or advice is being given as to whether any investment is suitable for a particular investor. Any views or opinions expressed above may not reflect those of Seeking Alpha as a whole. Seeking Alpha is not a licensed securities dealer, broker or US investment adviser or investment bank. Our analysts are third party authors that include both professional investors and individual investors who may not be licensed or certified by any institute or regulatory body.
