Summary:
- JPMorgan has a strong track record of generating a double-digit return on tangible common equity.
- JPMorgan has significantly outperformed U.S. bank peers since the Fed began raising interest rates in 2022, with the bank seeing above-average NIM expansion in that time.
- JPMorgan is still over-earning relative to management’s long-term ROTCE target, but at ~12.1x current earnings, the stock may have a credible path to reasonable long-term returns.
winhorse
JPMorgan (NYSE:JPM) is the largest U.S. bank by assets and market capitalization. Its diverse mix of operations, objectively high quality business, and track record of returning capital to shareholders make it a cornerstone holding in many portfolios.
JPM stock has significantly outperformed peers since the Fed began raising interest rates in 2022. Relative to management’s long-term profitability target, JPM has been over earning throughout this period, including in its most recent quarter, in which JPM delivered a return on tangible common equity (“ROTCE”) of 19%.
Relative to management’s long-term ROTCE target, JPM’s P/E would be ~13.5x versus ~12.1x currently. JPM could be roughly fair value assuming a ~9-10% hurdle rate, although JPM’s longer-term prospects depend on many variables, a number of which management has little or no control of. I open on JPM with a ‘Hold’ rating.
JPM Overview
JPM is the largest bank in the U.S. with ~$4 trillion in assets and a current market capitalization of ~$625 billion.
JPM operates many different business lines and is often the leading player in them. For example, it is the top retail deposit gather in the U.S., the largest credit card issuer in the U.S., tops investment banking league tables by revenue, etc.
JPM’s businesses ultimately fall under three broad segments: Consumer & Community Banking (“CCB”), which houses its retail and small business banking operations, Commercial & Investment Banking (“CIB”), which includes corporate and middle-market lending as well as investment banking and trading, and Asset & Wealth Management (“AWM”), which houses JPM’s global asset management business and private bank.
Based on year-to-date figures (through 3Q24), CCB and CIB were roughly equal in terms of their contribution to total revenue (both ~$53 billion), followed by AWM (~$16 billion).
JPM’s total revenue currently skews ~55% to net interest income (“NII”), but this is partly due to its recent strong performance in the hiking cycle. JPM’s significant non-interest income generation remains key and was above 50% of revenue in the past. JPM’s non-interest income sources are diverse and include trading revenue, asset management fees, investment banking fees, transaction banking fees, card income and more.
Non-interest income is arguably more important to JPM than NII given that it could be the source of a major cost advantage for the firm relative to other banks, contributing to its high-quality earnings (see below).
An Objectively High-Quality Business
JPM is an objectively “high quality” business in the sense that it posts above-average profitability metrics. For instance, JPM’s average return on assets (“ROA”) was ~15bps above large bank peers between 2019 and 2Q24 (large bank defined here as FDIC-insured institutions with over $250 billion in total assets). JPM’s average ROTCE over this period was ~20%.
Data Source: JPMorgan Annual & Quarterly Results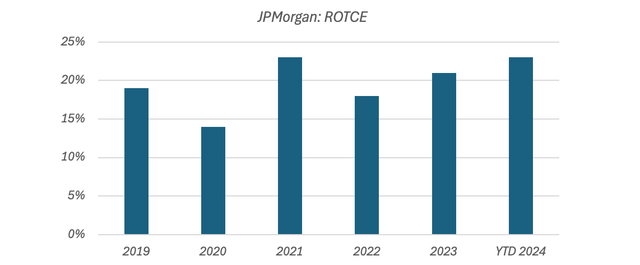
Many of JPM’s businesses are conducive to operating leverage. For example, retail bank branches typically have large fixed costs (e.g. labor, occupancy expenses, etc.), so strong deposit growth can result in positive operating leverage over time. JPM does have a track record of gaining market share in retail deposits.
Source: JPMorgan 2024 Investor Day Presentation
Operating leverage and efficiency are typically measured via the cost/income ratio, though this can often be over/understated if the comp is uneven (e.g. interest rate changes can have a large short-term impact on revenue and, by extension, the C/I ratio).
It can also be helpful to view efficiency relative to assets. Expressed this way, JPM’s operating expenses have declined by ~25bps over the past decade, providing a tailwind to JPM’s ROTCE.
JPM’s size attracts significant additional regulatory costs, yet JPM is still “efficient”. This is partly due to scale advantages, but is also due to JPM’s vast non-interest income generation. Relative to assets, JPM’s gross operating expense was ~10bps below large bank peers between 2019 and 1H24, while its average net operating expense was ~60bps below peers.
This difference naturally becomes more meaningful in terms of ROTCE (due to leverage), and could constitute a major cost advantage for JPM over other banks.
Data Source: JPMorgan Annual & Quarterly Filings; FDIC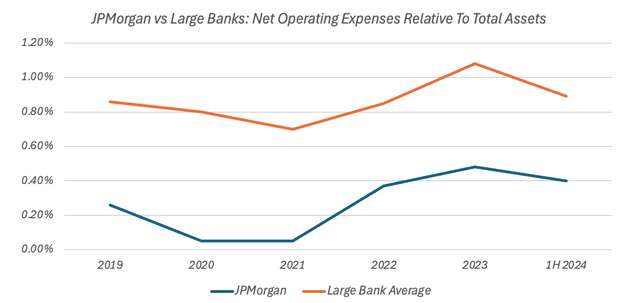
High-quality businesses are attractive insofar as they can realize reasonable rates of growth (because they can afford to pay out more of their earnings while doing so).
JPM’s underlying growth could be constrained by numerous factors, including its size (and possible associated regulatory considerations), but its tangible equity growth has roughly matched nominal U.S. GDP growth in recent years. This implies net income growth would also have matched GDP growth over this period if JPM’s ROTCE remained constant.
Source: JPMorgan Annual Reports; World Bank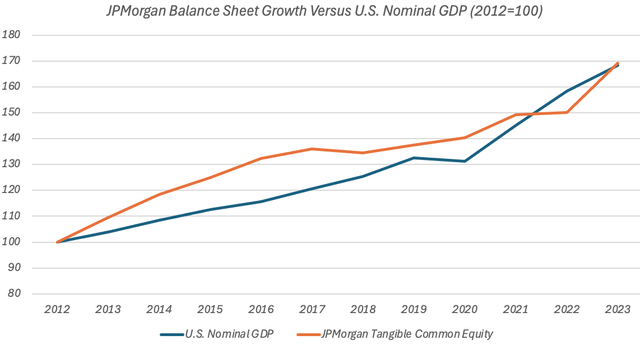
Since 2013, JPM has generated net income of ~$370 billion and has returned ~$230 billion to stockholders via dividends/buybacks. The implied payout ratio (~62%) likely significantly understates JPM’s true capital returning capabilities, as management has built significant excess capital for a number of reasons (e.g. regulatory changes, to retain flexibility in the current macro environment, possible unappealing valuation for buybacks, etc.)
JPM’s Recent Over-Earning
JPM stock has significantly outperformed other U.S. banks since the Fed began increasing interest rates in early 2022.
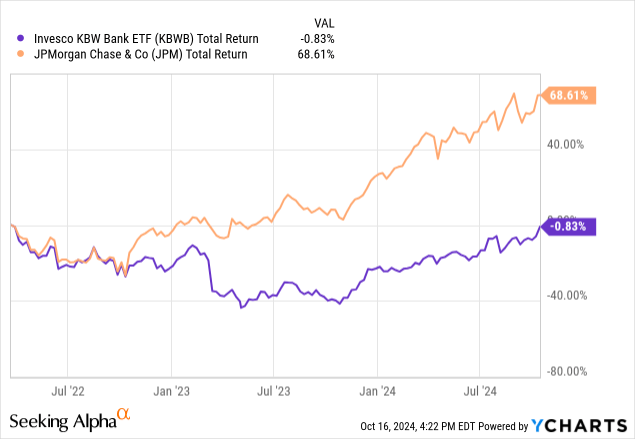
This may be explained by JPM’s recent profitability, which has been ahead of management’s 17% ROTCE target. JPM’s ROTCE was 19% in 3Q24, and was also above management’s target in 2023 (21%) and 2022 (18%).
JPM’s current period of over-earning could be partly explained by its balance sheet composition over the course of the hiking cycle. Relative to peers, JPM realized a ~700bps higher pass-through rate on its interest-earning assets:
Data Source: JPMorgan & Chase Co. Quarterly Results; FDIC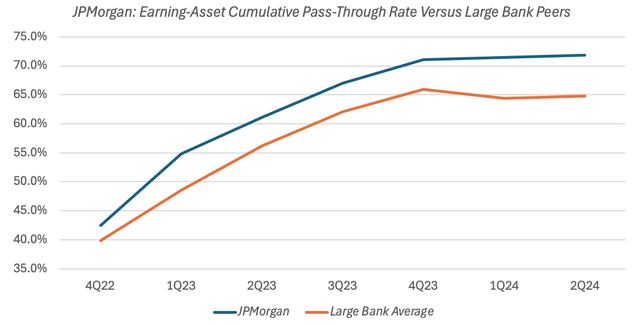
This has helped drive better-than-average net interest margin (“NIM”) expansion, with JPM seeing ~50% NIM expansion during the hiking cycle versus a large bank average of ~40% and a whole-bank average of ~20%.
While some may view this performance as a sign of management’s dexterity, the underlying reality may be significantly more complex, and how JPM ultimately performs on this should probably be measured across the entire interest rate cycle rather than the first leg.
Source: JPMorgan Quarterly Results; FDIC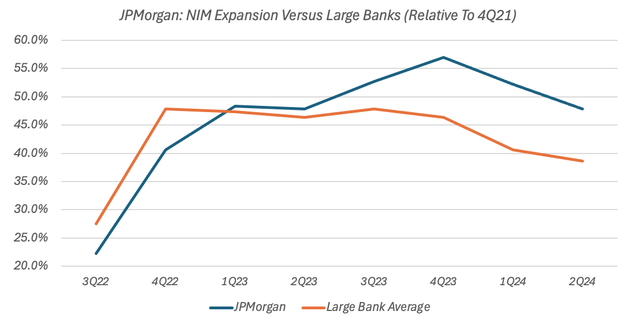
The current easing cycle is expected to be a headwind to JPM’s NIM and net interest income (“NII”). As of the third quarter earnings call, sell-side consensus had 2025 net interest income (“NII”) at ~$87 billion ex-Markets, which is ~5% below 2024 NII ex-Markets guidance of ~$91.5 billion.
So we see the current 2025 consensus for NII ex-markets to be currently at 87, which is obviously lower than it was at the conference earlier in the quarter. So we’re happy to see that move a little bit more in line to us. That still looks a little toppy, but it’s definitely in the ballpark.
Jeremy Barnum, JPMorgan Chase & Co. CFO, Q3 2024 Call
How JPM’s NIM ultimately evolves is difficult to predict accurately, especially over the long term.
Broadly, bank NIM can be broken down into three components: an asset margin, a liability margin and a “remainder” bucket that includes various other factors, including maturity transformation (i.e. borrowing short to lend long).
This means that JPM’s NIM will be influenced by numerous factors. The absolute level of interest rates is probably not that important, but the shape of the yield curve, pass-through rates on both sides of the balance sheet, JPM’s balance sheet composition, interest rate risk management interventions and so on are all factors. These factors make accurate NIM projections challenging. As NIM is a key driver of NII, this also makes NII somewhat tricky to model.
The above may also explain the CEO’s frustration with questions on JPM’s NII outlook on the recent call, particularly the last sentence:
Could I just say some — next time, we should give you the number. I don’t want to spend all time in these calls like going through what they’re guessing what NII is going to be next year. And I just — can I just also point out that NII, all things being equal, is a number, but all things are never equal.
Jamie Dimon, JPMorgan Chase & Co. Chairman & CEO, Q3 2024 Call
For understandable reasons, sell-side analysts probably care more about short-term accuracy than long-term investors, hence their desire to press management for guidance right across the income statement. Their job is to make accurate projections over the next 1–3 years, while long-term investors only need to be roughly right over lengthier time frames.
JPM’s long-term average NIM is ~2.4%. As the bank heads through the easing cycle, that might not be a bad estimate as to its future long-term NIM assuming the interest rate environment is somewhat normal.
Data Source: JPMorgan Chase & Co. Annual Filings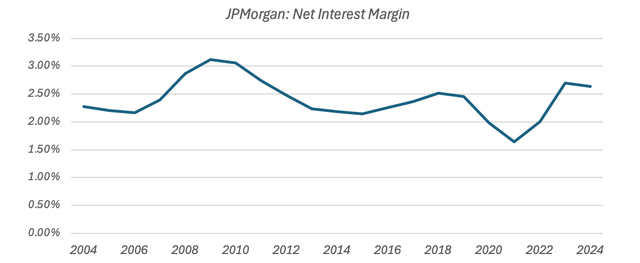
Management places more emphasis on ROTCE. JPM’s ROTCE has averaged ~20% since 2019 and ~17% since 2015. This may be a better guide as to JPM’s future earnings potential, given this period encompasses a variety of different economic environments.
JPM Asset Quality
JPM’s profitability will also be influenced by its credit losses. JPM’s consolidated net charge-off (“NCO”) ratio has been above pre-COVID levels for several quarters now. Loan losses typically follow a cyclical pattern, so this trend was expected.
Data Source: JPMorgan & Chase Co. Quarterly Results Releases
Whether JPM is doing well or badly on this is also a somewhat complex question, as loan losses need to be measured against the types of loans being written as well as the overall gross loan yield (and JPM’s gross loan yield is currently over 7%).
How JPM ultimately performs on this is only partially under management’s control. JPM’s current credit loss allowance is ~$26.3 billion, versus total nonperforming exposure of ~$9.2 billion. JPM’s current credit loss allowance also reflects a worse outlook than the one presented under its central case assumptions. With the usual caveats, JPM looks adequately provisioned.
Furthermore, loans only constitute ~32% of JPM’s assets, so credit charges will naturally be ‘de-magnified’ in terms of their contribution to ROA (and by extension ROTCE). Even if NIM contracts, JPM could still clear ~$75 billion in annual pre-provision net revenue, so in a relatively bad year for credit charges it could still earn its cost of equity, as evidenced by its performance in COVID-affected 2020 (when JPM’s credit expense was ~1.7% of total loans, and it earned a mid-teens ROTCE).
JPM’s Fortress Balance Sheet
JPM’s current regulatory capital ratio suggests it is sitting on a significant level of surplus capital. JPM’s CET1 ratio was ~15.3% in 3Q24, which implies over $50 billion of excess capital versus its current regulatory minimum.
Source: JPMorgan Q3 2024 Earnings Presentation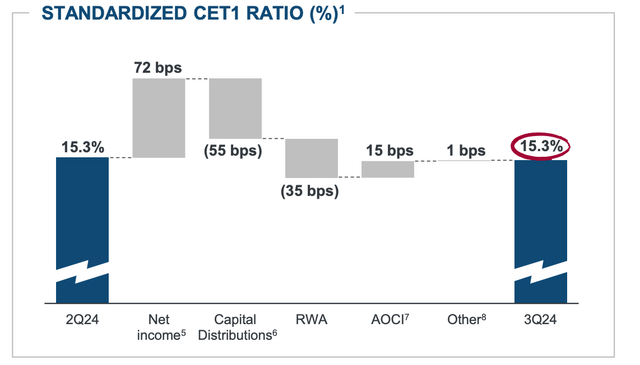
JPM’s actual level of surplus capital depends partly on Basel III endgame proposals, which are yet to be finalized, although management expects surplus capital to be significant even after this:
If you look at it roughly, we have about a minimum $30 billion of excess capital.
Jamie Dimon, JPMorgan Chase & Co. Chairman & CEO, 3Q24 Call
Management is currently adopting a wait-and-see approach with respect to deploying this excess. This may be because management views the current valuation as too rich for buybacks (see below), though it may also be down to other factors, including the aforementioned regulatory uncertainty and a general desire to retain flexibility in the current economic environment. There was some evidence for this on the recent earnings call:
And one last thing. Cash is a very valuable asset sometimes in a turbulent world. And you see my friend Warren Buffett stockpiling cash right now. I mean, people should be a little more thoughtful about how we’re trying to navigate in this world and grow for the long-term for our company.
Jamie Dimon, JPMorgan Chase & Co. Chairman & CEO, Q3 2024 Call
JPM Valuation
At $221.37 currently, JPM trades for 2.3x tangible book value per share (“TBVPS”)($96.42 as of 3Q24). This implies a P/E of ~12.1x based on Q3 ROTCE of 19%, which would rise to ~13.5x based on management’s long-term 17% target.
Versus select large bank peers, JPM’s P/TBV multiple represents a significant premium, though this largely reflects JPM’s superior ROTCE.
Data Source: Q3 2024 Quarterly Results Releases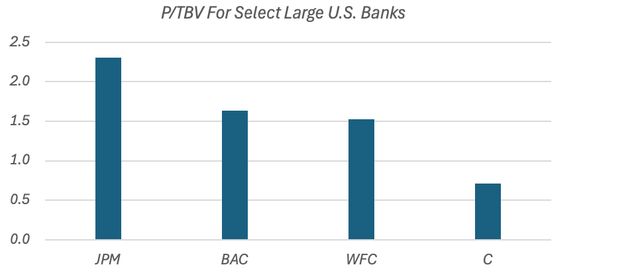
JPM’s current P/E appears more modest relative to peers (which trade for between ~10-12x), though again this could be misleading, as JPM is currently over-earning (relative to management’s long-term target) while peers are currently under-earning (again relative to their respective C-suite targets). In any case, JPM’s superior ROTCE would also command a premium P/E, all else equal.
JPM Possible Long-Term Stock Returns
This article is primarily concerned with JPM as a long-term investment.
JPM’s long-term stock returns will depend on its EPS growth (which includes a capital returns component due to buybacks), the cash dividends it returns directly to stockholders, and how its P/E evolves over time. This formula can also be expressed in terms of its balance sheet (i.e. TBVPS growth, cash dividends, and changes to JPM’s P/TBV multiple).
What is a fair long-term P/E multiple for JPM will ultimately depend on its ROTCE, growth prospects and the return that investors demand.
The Congressional Budget Office thinks that long-term U.S. nominal GDP growth will be roughly ~3.5% annualized. A fair P/E for JPM stock could be ~12.3x under this outlook assuming JPM’s net income grows in line with this. A 12.3x P/E is the same as an 8.1% earnings yield (i.e. one divided by 12.3). On a ~17% ROTCE, JPM could fund a ~80% total payout ratio, which could lead to ~10% annual returns overall (i.e. 3.5% underlying growth plus 80% of 8.1%).
A more ‘conservative’ P/E for JPM could be ~10x normalized earnings, as JPM would theoretically be able to return ~10% annualized simply via dividends/buybacks at this valuation. JPM stock could of course trade below this at any given time, for example when it is under-earning (e.g. in a recession).
JPM stock could see a ~0-1% long-term headwind from P/E compression. This would imply possible total returns potential of 9-10%, consisting of ~3.5% underlying earnings growth, ~6.5% from capital returns and a ~0-1% headwind from long-term P/E changes. At $221.37 currently, JPM stock could be roughly fair value.
Management Commentary On JPM’s Valuation
Management has also provided interesting commentary on JPM’s current valuation, with the CEO’s statement on buybacks at JPM’s recent Investor Day possibly implying that the current valuation is unattractive:
We’re not going to buy back a lot of stock at these prices. And I – we do not consider stock buyback returning cash to shareholders, that’s giving cash to existing shareholders, we want to help the existing shareholders. I look at this as cash in store. So, if the number is $35 billion, $40 billion, whatever you call the number, it’s going to sit there until we could deploy it at very good returns. Buying back stock as a financial company, greatly in excess of 2 times tangible book is a mistake. We aren’t going to do it.
Jamie Dimon, JPMorgan Chase & Co. Chairman & CEO, JPM 2024 Investor Day
This could also be read as management simply sees better opportunities elsewhere, especially as the CEO does not consider buybacks to be a return of cash to current shareholders.
Conclusion
JPMorgan has a track record of strong profitability that supports management’s long-term 17% ROTCE target. Measured against this, JPM may still be over-earning right now due to its positioning in the hiking cycle.
JPM’s current valuation may look rich relative to peers, though this is partly due to its superior profitability. At $221.37 currently, JPM could deliver ~9-10% annualized long-term returns under reasonable assumptions, although the stock’s ultimate returns will be heavily influenced by factors outside of management’s control.
Analyst’s Disclosure: I/we have a beneficial long position in the shares of JPM either through stock ownership, options, or other derivatives. I wrote this article myself, and it expresses my own opinions. I am not receiving compensation for it (other than from Seeking Alpha). I have no business relationship with any company whose stock is mentioned in this article.
Seeking Alpha’s Disclosure: Past performance is no guarantee of future results. No recommendation or advice is being given as to whether any investment is suitable for a particular investor. Any views or opinions expressed above may not reflect those of Seeking Alpha as a whole. Seeking Alpha is not a licensed securities dealer, broker or US investment adviser or investment bank. Our analysts are third party authors that include both professional investors and individual investors who may not be licensed or certified by any institute or regulatory body.
