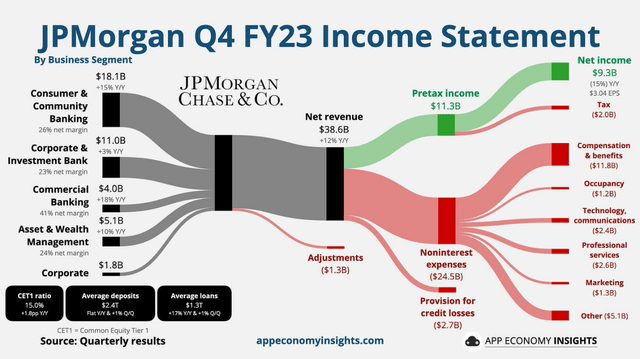
Summary:
- JPMorgan’s ten-year median net interest margin is steady at 1.9%, reflecting the bank’s diversification and consistent loan quality.
- JPMorgan’s net charge-off ratio shows relative consistency, indicating stable credit loss management in line with the other big four banks.
- JPMorgan’s efficiency ratio has mostly hovered around 60%, close to industry averages.
- JPMorgan has maintained a healthy loan-to-deposit ratio under 100% over the past decade, indicating stable and cost-effective funding sources.
- Expected CAGR of 7.1% for JPMorgan over five years, with projections based on normalized financial ratios and current valuation metrics, leading to a ‘hold’ recommendation.
Bloomberg/Bloomberg via Getty Images
Investment Thesis
I think JPMorgan Chase & Co. (NYSE:JPM) stock is a worthy ‘hold’. The bank’s diverse business model and effective operational performance have shown resilience despite recent interest rises where the company has well managed their net interest margin. JPM has shown a steady net charge-off ratio and efficient management of its overhead expenses demonstrating a good approach to loan book risk and expense control. Additionally, the bank has been successful in attracting deposits and funding sources keeping their loan-to-deposit ratio below 100% for the last ten years. The valuation based on today’s stock price estimates a CAGR of 7.1% over the next five. This projection considers book value growth, a potential book value multiple decrease and the annual dividend yield.
Headline Financial Analysis
During the last decade, JPMorgan has produced consistent and moderate revenue growth increasing from $89,202.00 million in 2015 to $146,009.00 million in 2023, indicating a compound annual growth of around 5.1%. During the last year, JPMorgan has announced revenue of $146,009.00 million which is around 22.0% growth YoY compared to 2022. In 2024, analysts expect revenue of $157,320.00 million which is around the business’s historical growth rate which is impressive considering the recent interest hikes.
Created by Author, Data from WiseSheets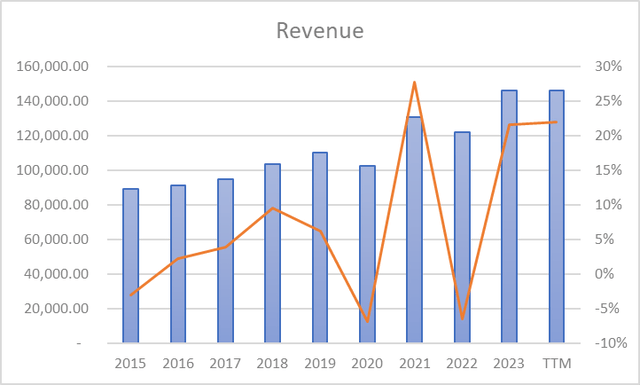
I regard the earnings per share over the last ten years to have been strong, where EPS went from $6.00 in 2015 to $16.23 in 2023, showing a compound annual growth rate of roughly 10.5%. Analysts foresee that in 2024 EPS is anticipated to land at $14.79 denoting that it is believed that EPS growth will be -8.9% YOY due to pressure placed on net income margins from slower expected revenue growth and higher expenses to be incurred in 2024.
Created by Author, Data from WiseSheets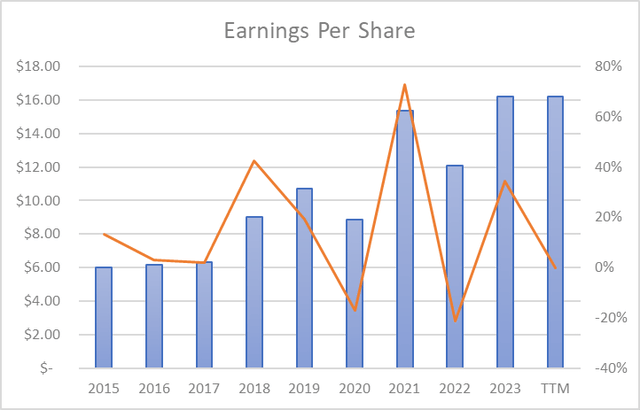
Net Interest Margin
Shifting our focus to net interest margin. I think that in examining the net interest margin, it is imperative to examine the quality of loans held by the bank on its balance sheet. JPMorgan operates worldwide with four divisions that offer a range of services.
These divisions include Asset and Wealth Management, Consumer and Community Banking, Commercial Banking and Corporate and Investment Banking. The Asset and Wealth Management division focuses on investment and wealth management, for both individuals and institutions. Meanwhile, Consumer and Community Banking cater to everyday consumers and small businesses with banking and lending. Commercial Banking offers solutions to larger corporations and organizations. Lastly, the Corporate and Investment Banking, prime brokerage, market making activities to clients including corporate investing institutions as well as government entities. Overall, JPM is a very diversified bank, therefore in terms of NIM we would expect it to be relatively steady with the bank being able to weather more difficult periods better than smaller regional banks. JPMorgan has achieved a median net interest margin over the previous ten years of 1.9%.
Created by Author, Data from WiseSheets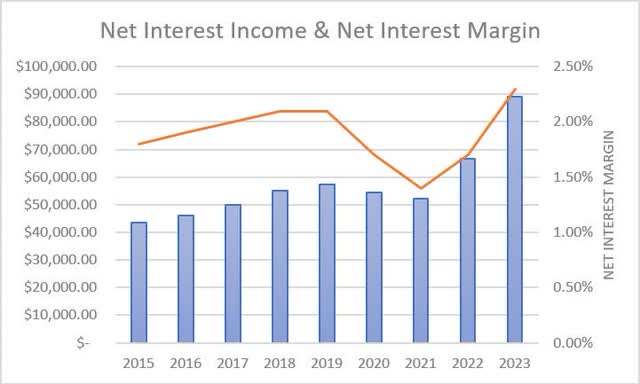
In the process of comparing JPM’s ten-year average NIM relative to its major competitors indicates that Citigroup Inc. (C), Wells Fargo & Company (WFC), and Bank of America Corporation (BAC) each carry a decade-long median net interest margin of 2.4%, 2.5%, and 1.9%, respectively. This puts JPM as holding the tied third-highest ten-year median net interest margin.
Created by Author, Data from WiseSheets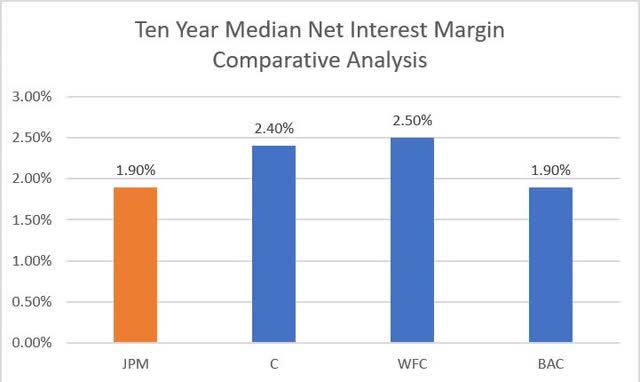
I think considering NIM we should also look into the consistency of the NIM. From my experience a stable net interest margin is generally indicative of better loan quality, whereas a more volatile NIM often suggests lower loan quality, rendering the bank’s future performance harder to predict. When we analyze JPM the standard deviation across the last ten years for their NIM is 0.00271, this puts JPM as having the second-lowest NIM standard deviation amongst its peers. Therefore, in my opinion, this shows that JPM in recent times has held the ship steady in terms of net interest margins when compared to other similar institutions. This also means that there might be less risk associated with their loan book than say WFC and C.
Created by Author, Data from WiseSheets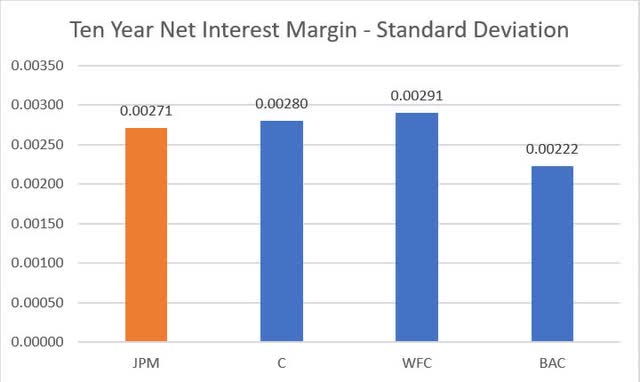
Net Charge-Off Ratio
I see the net charge-off ratio as an important indicator for deciding upon a bank’s loan book quality. As we can see from the graph below, over the previous ten years JPM has had their net charge-off ratio range between 0.60% and 0.30%. In comparison with the banking industry, we can see that JPM’s NCO ratio has been above industry averages though we should consider that JPMorgan’s net charge-off ratio has also been generally stable. The ratio started at 0.50% in 2015, then saw a slight increase to 0.60% in the following two years, then decreased back to 0.50% in 2018. We can see that a more notable decline occurred in 2019 and 2020, where it reached as low as 0.30%, reflecting the multi-decade low interest rates and fiscal stimulus leading to a favorable economic environment. However, there was a return to the earlier level of 0.50% in the subsequent years, which suggests a normalization of NCOs after the exceptional years through 2020 and 2021 due to the recent interest rate rises. However, overall, we can see that this indicates relative consistency in managing credit losses.
Created by Author, Data from WiseSheets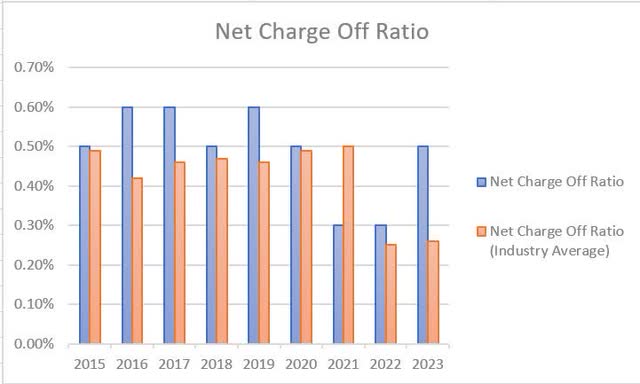
When we compare JPM’s ten-year median net charge-off ratio against the other big four banks we can see that C, WFC, and BAC all maintain a decade-long median net charge-off ratio of 1.10%, 0.30%, and 0.40%, as a result JPM is rated third out of the lot. Since we can see that JPM has maintained a ten-year median NCO ratio of 0.50%, I believe that JPM is similarly positioned to its peers to achieve acceptable net interest margins where the main outlier here is Citigroup with elevated NCO risk.
Created by Author, Data from WiseSheets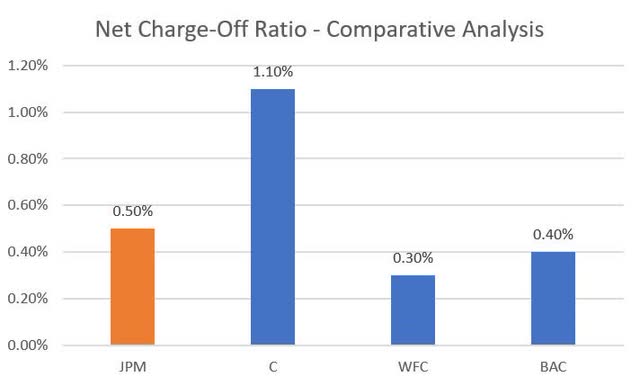
Leverage
Taking a look at leverage is another approach I like to take when evaluating balance sheet risk. In regard to my overall stance, I think it is okay for higher leverage when net charge-offs are low; on the other hand, I believe lower leverage is ideal if the bank engages in riskier loans such as personal credit, construction loans, and auto loans. In the case of JPMorgan, we have seen a decade-long median asset-to-equity ratio of 11.1. To me, it is clear that as interest rates dropped, JPM increased leverage to boost ROE. However, the latest data points suggest a change in direction with the ratio decreasing and stabilizing at 11.82 as concerns over interest rates grow. I see this adjustment in the assets-to-equity ratio as a strategy to mitigate interest rate risks and potential net charge-off risk as we potentially face what I see as a tougher economic environment ahead.
Created by Author, Data from WiseSheets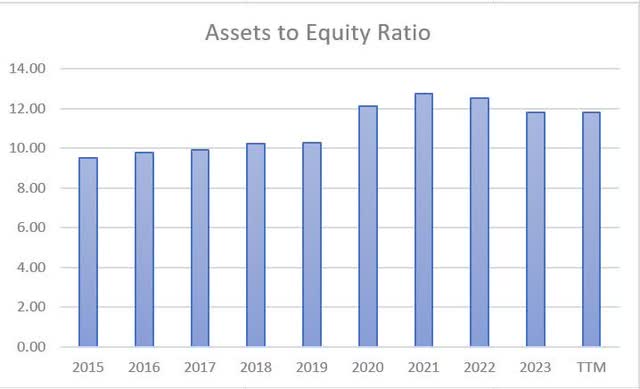
As we can observe in the graph below, JPMorgan had the highest degree of leverage in comparison to its peers, though we should also consider that the bank also has a decently stable NIM with net charge-offs in line with the industry. Therefore, I see JPM as a bank that is in a favorable position to drive a better than average ROE over the coming few years.
Created by Author, Data from WiseSheets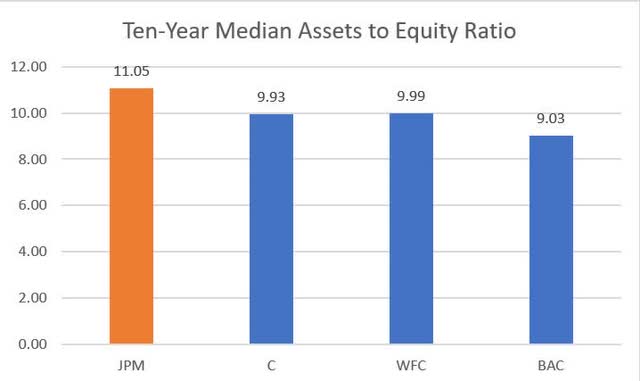
Efficiency Ratio
I see the efficiency ratio as an important metric since it tells us if the management team of the bank is managing the overhead expenses of the bank well. As seen in the graph below, JPMorgan between 2015 and the recent twelve-month period has displayed consistent performance regularly achieving a ratio of about 60% which is quite close to industry standards. The most notable improvement in the ratio was seen in 2020 when it decreased to 54% due to tight cost control as well as strong business growth through that particular year due to stimulus related to the pandemic. However, there has been an increase in the efficiency ratio in the last 24 months. In my opinion, the recent uptick indicates that costs have risen faster than what revenue has risen suggesting that overall operational efficiency has gotten worse but is still acceptable. JPM through the past decade has succeeded in recording a total of four years where the efficiency ratio was less than 60%.
Created by Author, Data from WiseSheets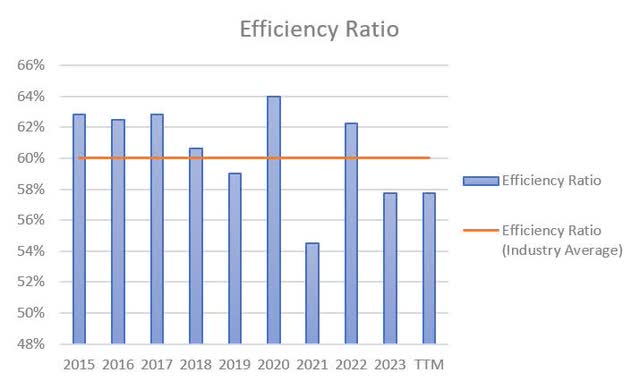
If you now turn your attention to the graph below, we can see that C, WFC, and BAC each hold a ten-year median net charge-off ratio of 61%, 68%, and 65%, therefore JPM is ranked second lowest in its peer circle. In my opinion, when compared to other similar banks, the management team has demonstrated that they have done an effective job at managing overhead costs at the bank.
Created by Author, Data from WiseSheets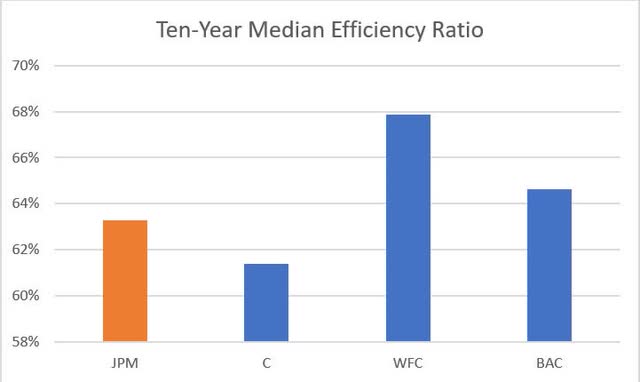
Deposits and Funding Sources
Based on my experience the loan-to-deposit ratio is what I like to analyze when assessing a bank’s ability to access deposits. Ideally, we want to see the loan-to-deposit ratio under 100% as this indicates that other more expensive funding sources such as Federal Home Loan Bank Advances are not required. As we can see below, JPM over the past ten years they have managed to maintain a loan-to-deposit ratio of below 100% in ten of the last ten years. This demonstrates that the deposit side of the bank is strong and that the bank consistently has access to cheaper funding sources such as deposits within bank accounts and certificates of deposits.
Created by Author, Data from WiseSheets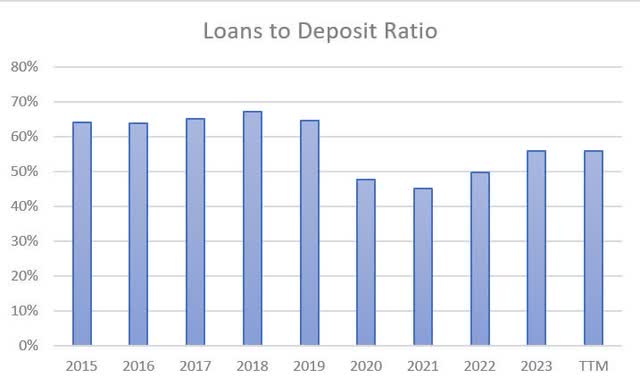
Throughout the most recent 12 months, non-interest bearing deposits have formed a total of 28% of JPM’s total deposits. Undoubtedly, non-interest bearing deposits as a funding source enhance net interest margins. However, in the past, I have seen these types of deposits to be less reliable and prone to withdrawals. While interest-bearing deposits may be a more expensive funding choice for banks, their long-term nature and reliability make them valuable. Since 2021 JPM has faced a decrease of 0.8% in non-interest bearing loans which we have seen be the common trend throughout the banking sector due to increasing interest rates and a widespread drop in liquidity. Though in my opinion (this is also common consensus amongst bank investors) this decrease is not even close to the decrease that most regional banks have felt in the last year. Since this trend is industry-wide and given that the bank has a strong loan-to-deposit ratio, I believe that the deposits and funding sources side of the business is strong.
Return on Assets and Return on Equity
JPMorgan over the last decade, has achieved a median return on assets of 1.2%, while they have attained a ten-year median return on equity of 12.8% as we can observe in the graphs below. Since 2015 through to the recent most twelve months, I am of the opinion that JPM has shown a reasonably consistent return on assets. ROA was initially at 1.0% between 2015 and 2017, where it later increased to 1.4% in 2019 and 2021 indicating an enhanced ability to earn from its assets during these years. There was a drop back down to 1.0% but the ROA has now recovered to 1.3% in the last twelve months, demonstrating resilience in the asset base despite the macro challenges that we currently face. Similarly, the return on equity began at 10.2% in 2015 slightly decreased to 9.6% and then significantly rose to 14.1% reaching a peak of 16.9% in 2021. Currently, we are back to near-decade highs in ROE with a TTM ROE of 16.0% in the twelve months indicating what I see as an opportune time for JPM to continue to grow its book value which should also help increase the intrinsic value of the business.
Created by Author, Data from WiseSheets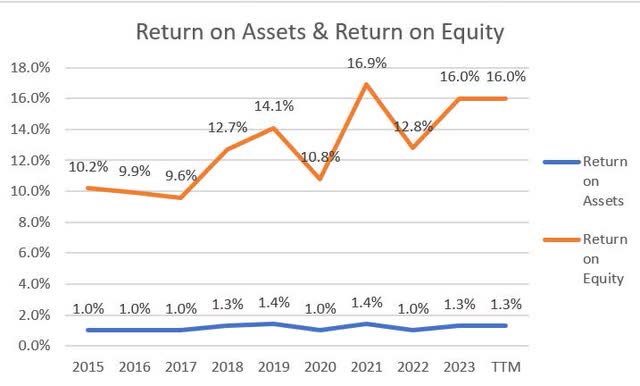
In the process of comparing JPM to its counterparts and as seen in the graph below we can observe that JPM has the second-highest rate of return on assets and the first-highest return on equity over the last decade. However, I do think it is important to know what kind of risk the bank has undertaken to achieve the higher than average returns on equity. Bearing this in mind, I do believe that the executive team has done a solid job at managing risk as supported by the net charge-offs section of this article. Therefore, I am of the opinion that JPM has driven ROE without excessive additional risk.
Created by Author, Data from WiseSheets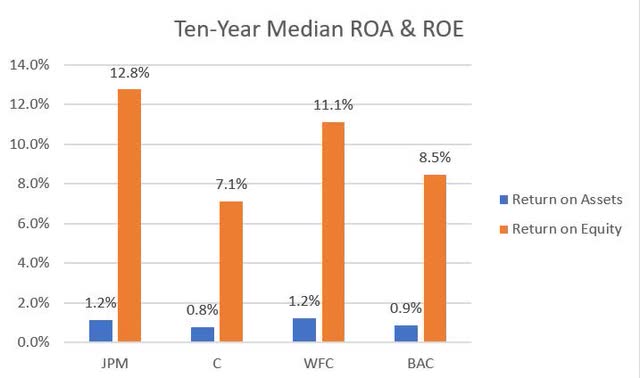
Valuation
When assessing the valuation for JPMorgan, I’ve made the decision to set the following conditions:
- A normalised return on assets of 1.2% which represents the ten-year median covering a range of market scenarios.
- A normalised assets-to-equity ratio of 11.1 representing the ten-year median assets-to-equity ratio.
- A normalised ten-year median payout ratio of 36%.
- A current price-to-book ratio of 1.72 and a future five-year expected price-to-book ratio of 1.42 which is based on the ten-year median.
Created by Author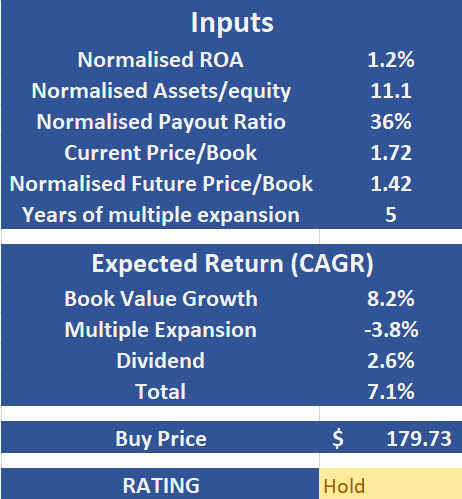
As illustrated earlier, I expect that JPMorgan during the ensuing five years will return a CAGR of 7.1%. Of the 7.1% annual return, I see 8.2% of the return coming from anticipated book value growth however this will be offset by a -3.8% multiple contraction. Based on the payout ratio I expect an annual dividend yield of 2.6%. Accordingly, I think that JPMorgan currently is a hold based on the current share price of $179.73.
Conclusion
When we look at JPMorgan, we see an institution that has consistently managed its net interest margin well to go along with its diverse loan portfolio and stable loan quality. The net charge-off ratio has stayed fairly steady through the last decade indicating effective management of credit losses and has been well managed considered the higher than average assets to equity ratio compared to the other big four banks. While the bank’s efficiency ratio mostly aligns with industry norms showing that the management has reasonable cost management strategies. The handling of deposits and funding sources has been efficient, where they have kept the loan-to-deposit ratio below 100% for the past decade highlighting the banks’ ability to secure deposits. In terms of valuation, I suggest holding on to JPM stock for now as due to the current stock price I can only expect a CAGR of 7.1% over the next five years.
Analyst’s Disclosure: I/we have no stock, option or similar derivative position in any of the companies mentioned, and no plans to initiate any such positions within the next 72 hours. I wrote this article myself, and it expresses my own opinions. I am not receiving compensation for it (other than from Seeking Alpha). I have no business relationship with any company whose stock is mentioned in this article.
Seeking Alpha’s Disclosure: Past performance is no guarantee of future results. No recommendation or advice is being given as to whether any investment is suitable for a particular investor. Any views or opinions expressed above may not reflect those of Seeking Alpha as a whole. Seeking Alpha is not a licensed securities dealer, broker or US investment adviser or investment bank. Our analysts are third party authors that include both professional investors and individual investors who may not be licensed or certified by any institute or regulatory body.
