Summary:
- JPMorgan’s fundamentals are strong, with positive growth across its four main segments, particularly in Commercial Banking and Asset & Wealth Management.
- JPMorgan demonstrates excellent financial stability and strong management with top rankings in operational efficiency, ROA, and ROE.
- JPMorgan’s bonds are a superior choice due to their higher coupon rate, credit rating, asset claim priority, and government protection in times of liquidation.
danielvfung
In our previous analysis, we highlighted JPMorgan Chase & Co.’s (NYSE:JPM) strong diversification across banking areas, which allowed it to withstand market volatility. For example, declines in its consumer business due to lower interest rates were offset by investment banking and wealth management growth, indicating JPMorgan’s resilient business model.
In this analysis, we evaluated whether the company is a suitable investment for fixed-income investors. Firstly, we examined the company’s business fundamentals by analyzing its segment breakdown and performance. Additionally, we assessed the company’s financial stability using the CAMELS framework. Finally, we compared the company’s average yield relative to its credit rating with that of other financial firms.1
Solid Business Fundamentals
In the first section, we examined whether JPMorgan has stable and solid fundamentals. The company consists of 5 segments with 4 major segments which are Consumer Banking, Investment Banking, Commercial Banking, and Asset Management, which account for 95% of revenues combined.
We compiled and analyzed the company’s segment breakdown and performance over the past 10 years, in terms of the company’s segment revenue growth performance below and focused on its 4 main segments by analyzing its growth metrics and market share to determine whether the company’s outlook could remain stable.
Company Data, Khaveen Investments Company Data, Khaveen Investments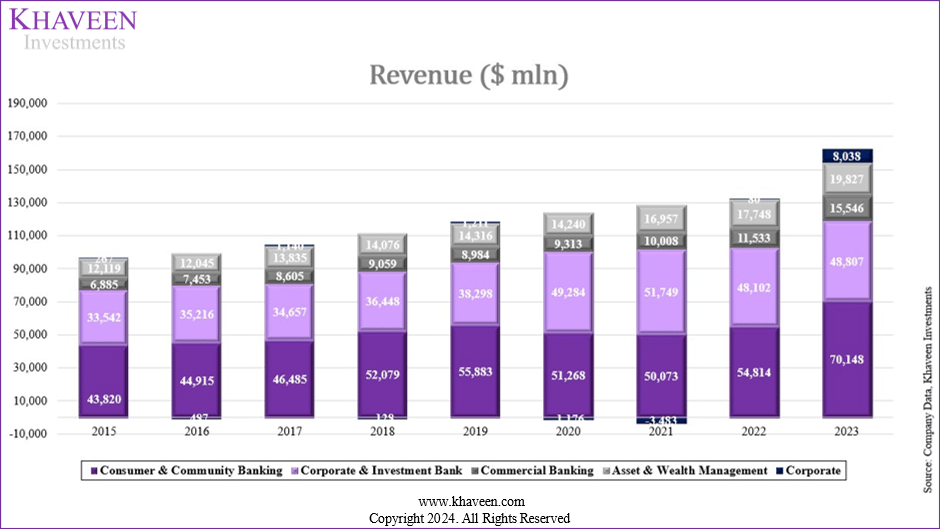
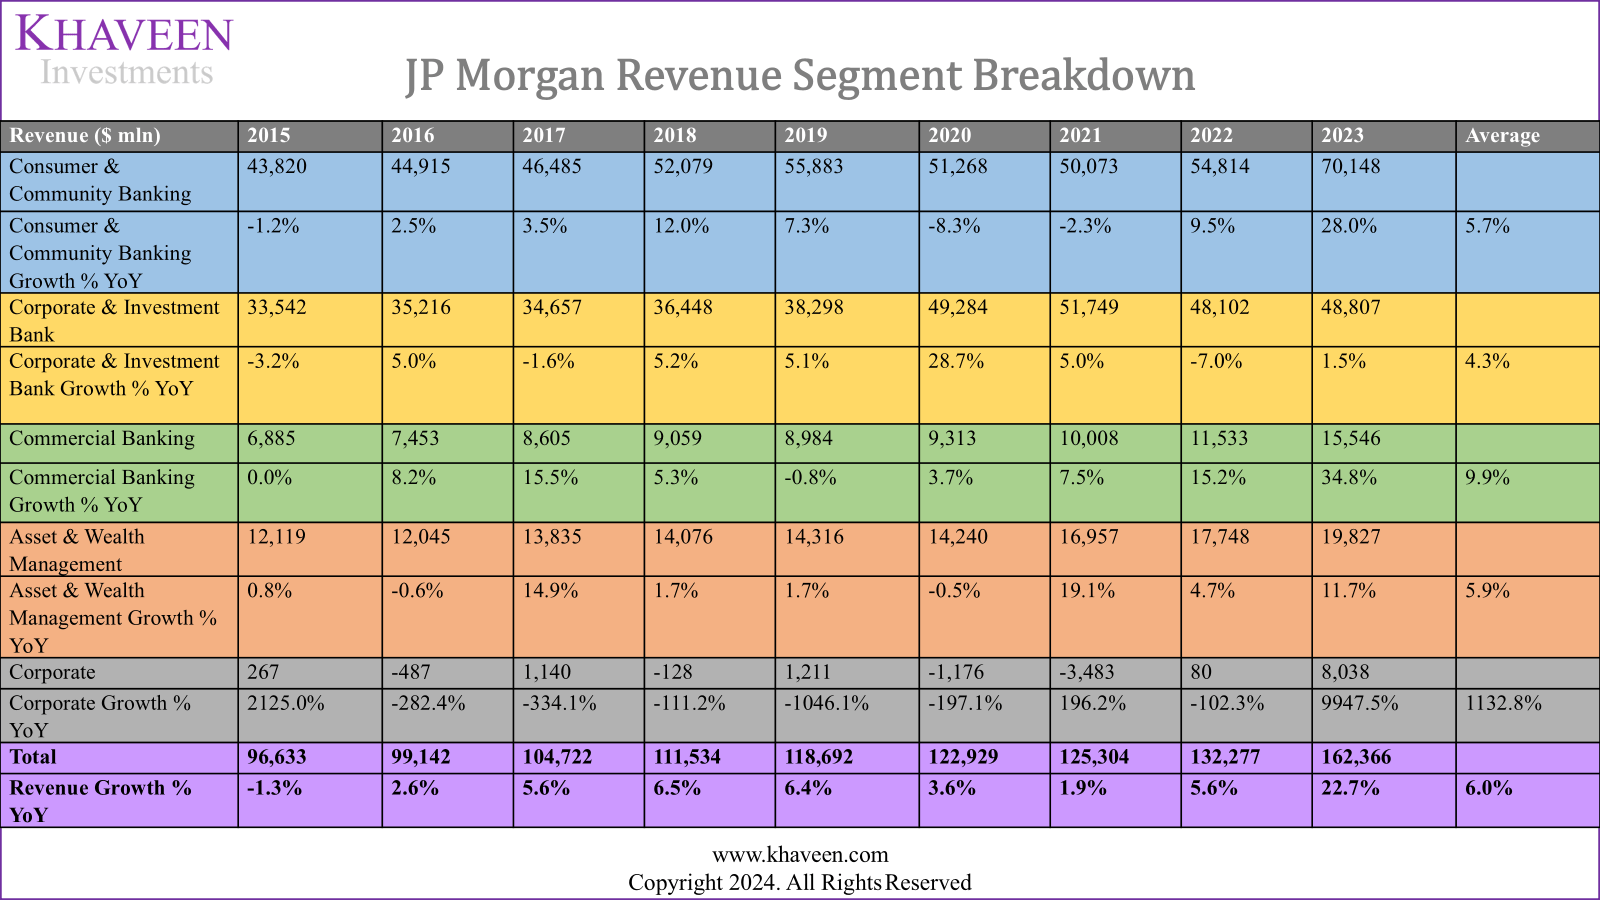
JPMorgan’s segment performance from 2014 to 2023 has been overall positive with an average of 6% for total average growth, with all segments having positive average growth rates. The Consumer & Community Banking segment, which is the largest in terms of revenue, shows an average growth rate of 5.7%, in line with the company’s total average of 6%. The Corporate & Investment Bank segment is smaller and has a lower 4.3% average growth rate. The Asset & Wealth Management segment has an average of 5.9%, while the Commercial Banking segment is the smallest but has the highest average of 9.9%. The Corporate segment relates to internal operations including “staff functions, real estate, technology, legal, corporate finance, and human resources” and grew to $8 bln in 2023 following the acquisition of First Republic. We examined the segment performance further below.
Consumer & Community Banking
Company Data, Khaveen Investments Company Data, Khaveen Investments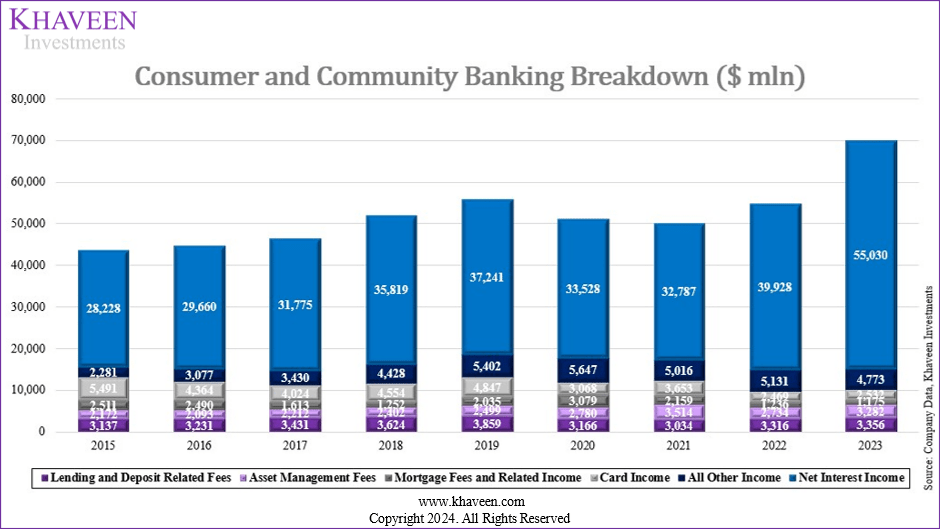

JPMorgan’s Consumer & Community Banking segment performance is positive in some years and negative in other years, but its total average is positive at 5.7%. The largest revenue contributor in this segment is Net Interest Income with a strong average growth rate of 8.4%, with a strong surge in 2022 as the US began hiking interest rates to counter rising inflation. Meanwhile, its non-interest revenue growth was flattish, at an average of -0.27%. The highest average growth rate comes from All Other Income at 15.8%, which consists of miscellaneous revenue streams including service charges, and is the largest revenue contributor of its non-interest income. Mortgage Fees and Card Income both underperformed with negative average growth rates that weighed down on its non-interest revenue.
Company Data, Khaveen Investments Company Data, Khaveen Investments
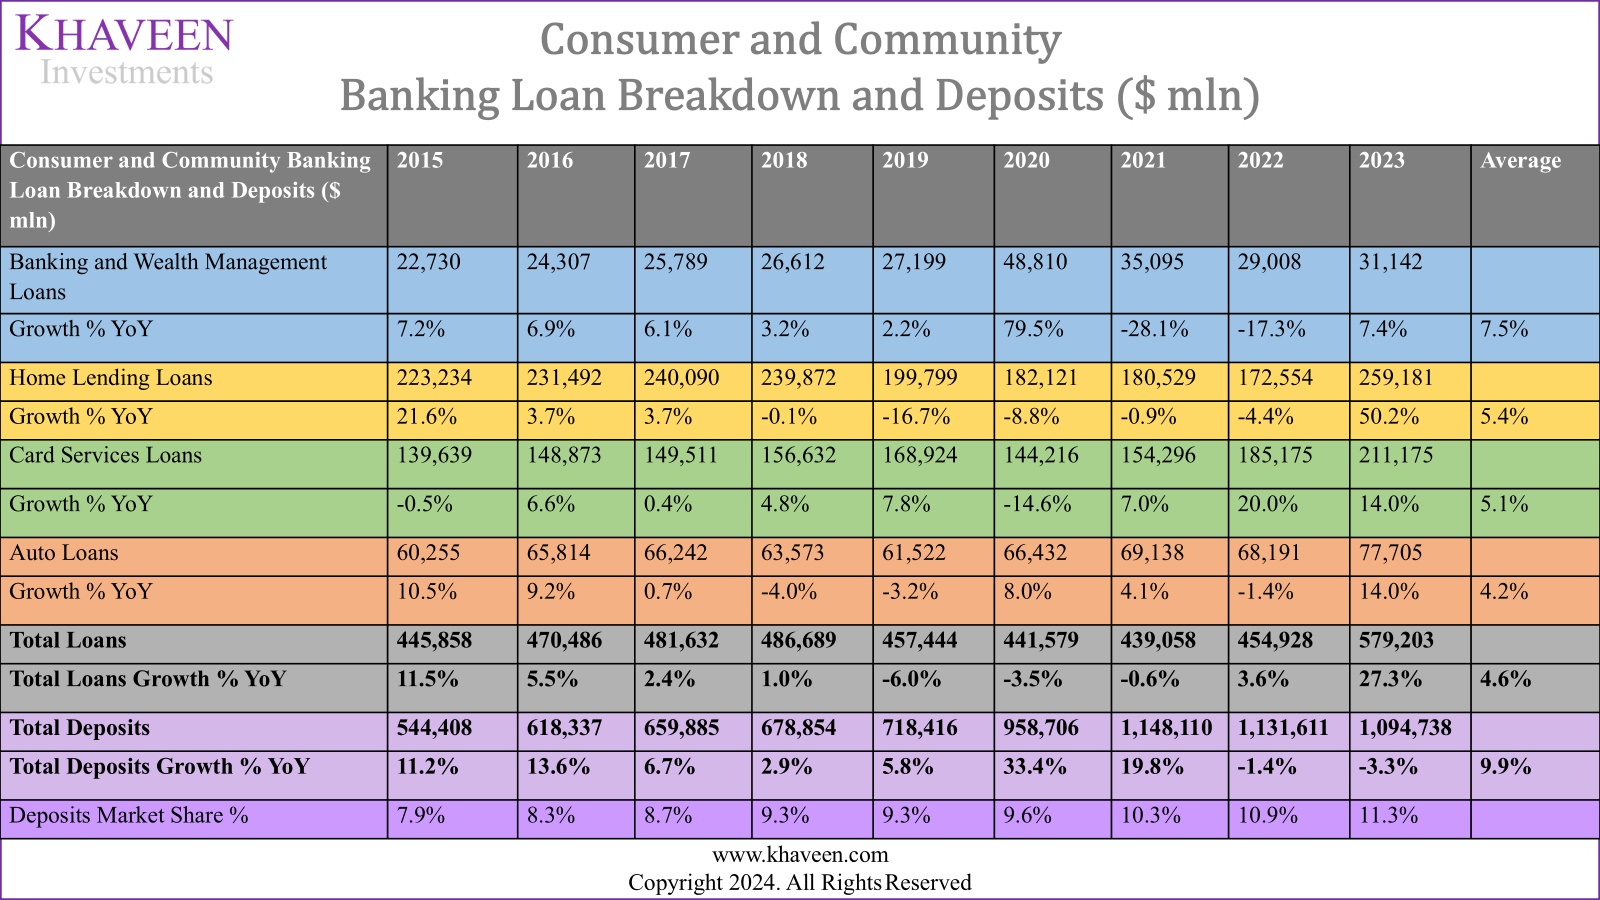
Furthermore, we compared JPMorgan’s Consumer & Community Banking segment loan breakdown and total deposits. The segment with the highest average loan growth rate is Banking and Wealth Management, at 7.45% which reflects strong growth across personal loans. During 2020, Banking and Wealth Management loans grew substantially by 79.5%, due to an inclusion of $19.2 bln of loans under the Paycheck Protection Program (“PPP”). Based on JPM’s Q3 2020 Quarterly Report, PPP was created during COVID-19 and “authorized eligible lenders to provide nonrecourse loans to eligible borrowers” for COVID-19-related financing issues. Furthermore, the Auto segment had the lowest average growth of 4.19%, below its average. This is as automotive vehicle sales in the US have stagnated over the past 10 years, with a CAGR of around -0.6%.
Additionally, the largest segment in terms of loans is Home Lending, which has an average growth of 5.37%. However, its growth had increased significantly by 50.2% during 2023, due to an inclusion of $90.7 bln in loans from the acquisition of First Republic. Excluding 2023, its average growth rate is -0.2%. We believe this is as the US homeownership rate has been stagnant over the past 10 years, increasing only by 1.4% to 69.5% in 2023.
Furthermore, the Card Services segment loan growth has been strong as well with an average of 5.06% as credit card debt in the US has grown at a CAGR of 5% in the past 10 years. From 2015 to 2023, loan growth was flattish as loans grew on average 1.7%, from $445,848 mln in 2015 to $454,829 mln in 2022. Additionally, net interest income fell by 10% in 2020 and 2.2% in 2021, as a result of declining interest rates. However, net interest income increased dramatically from 2017 to 2018 and from 2022 to 2023, due to increasing interest rates. Thus, we believe net interest income growth to reach its peak in the short term as the US has plans to cut interest rates soon.
The overall loan growth for the segment averages 4.60%, while deposit growth is significantly higher at 9.86% which benefits JPMorgan by providing more sources of funding and enhancing its liquidity position. Additionally, the rising market share of deposits in the US, reaching 11.3% in 2023, indicates increasing market penetration and could support the bank’s lending activities and increase its ability to extend more loans and derive more interest income.
Corporate & Investment Bank
Company Data, Khaveen Investments Company Data, Khaveen Investments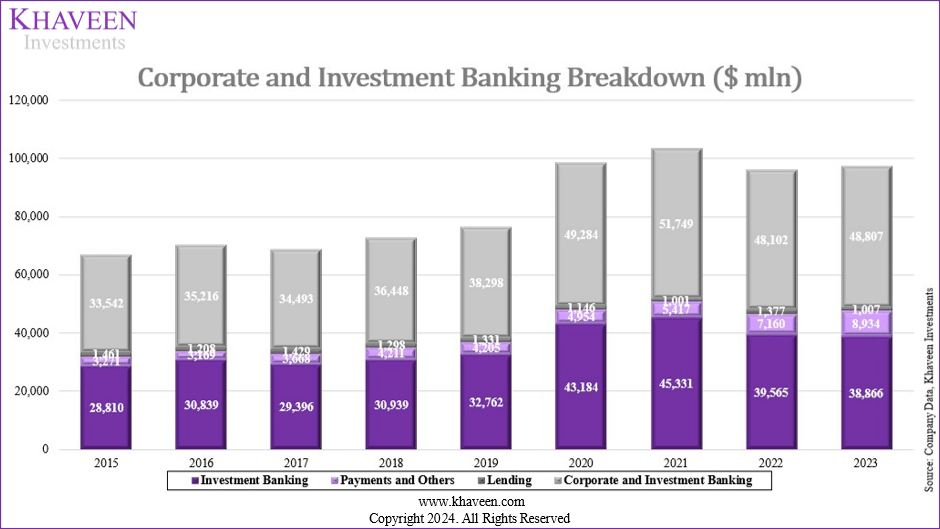
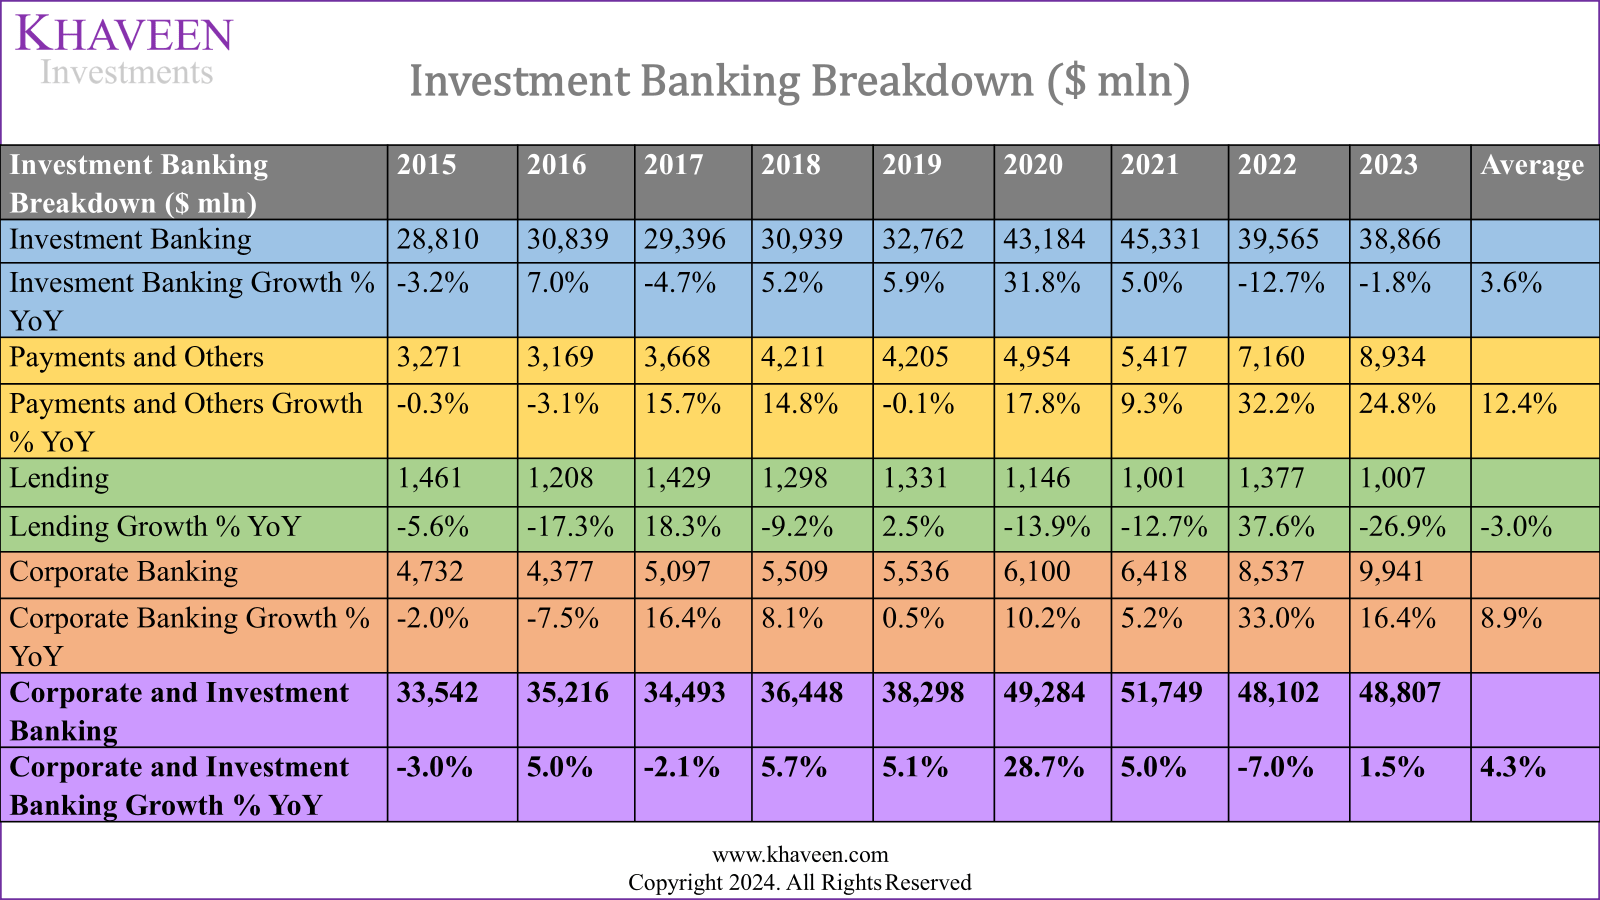
In terms of JPMorgan’s Corporate & Investment Bank segment, the combined Corporate and Investment Banking segment exhibits an average growth rate of 4.3%. The Corporate Banking sub-segment has a higher average growth rate of 8.94%, this growth was primarily driven by the Payments and Others segment which grew at an average of 12.35% over the period, whereas the Investment Banking sub-segment had a lower average growth rate of 3.62%. In 2022, its Investment Banking declined significantly, contracting by 12.7% as the global number of IPOs and M&A activity in terms of value fell by 48.7% and 35.8% amid the rising interest rate environment. Nonetheless, the Investment Banking sub-segment is larger than Corporate Banking.
Company Data, Khaveen Investments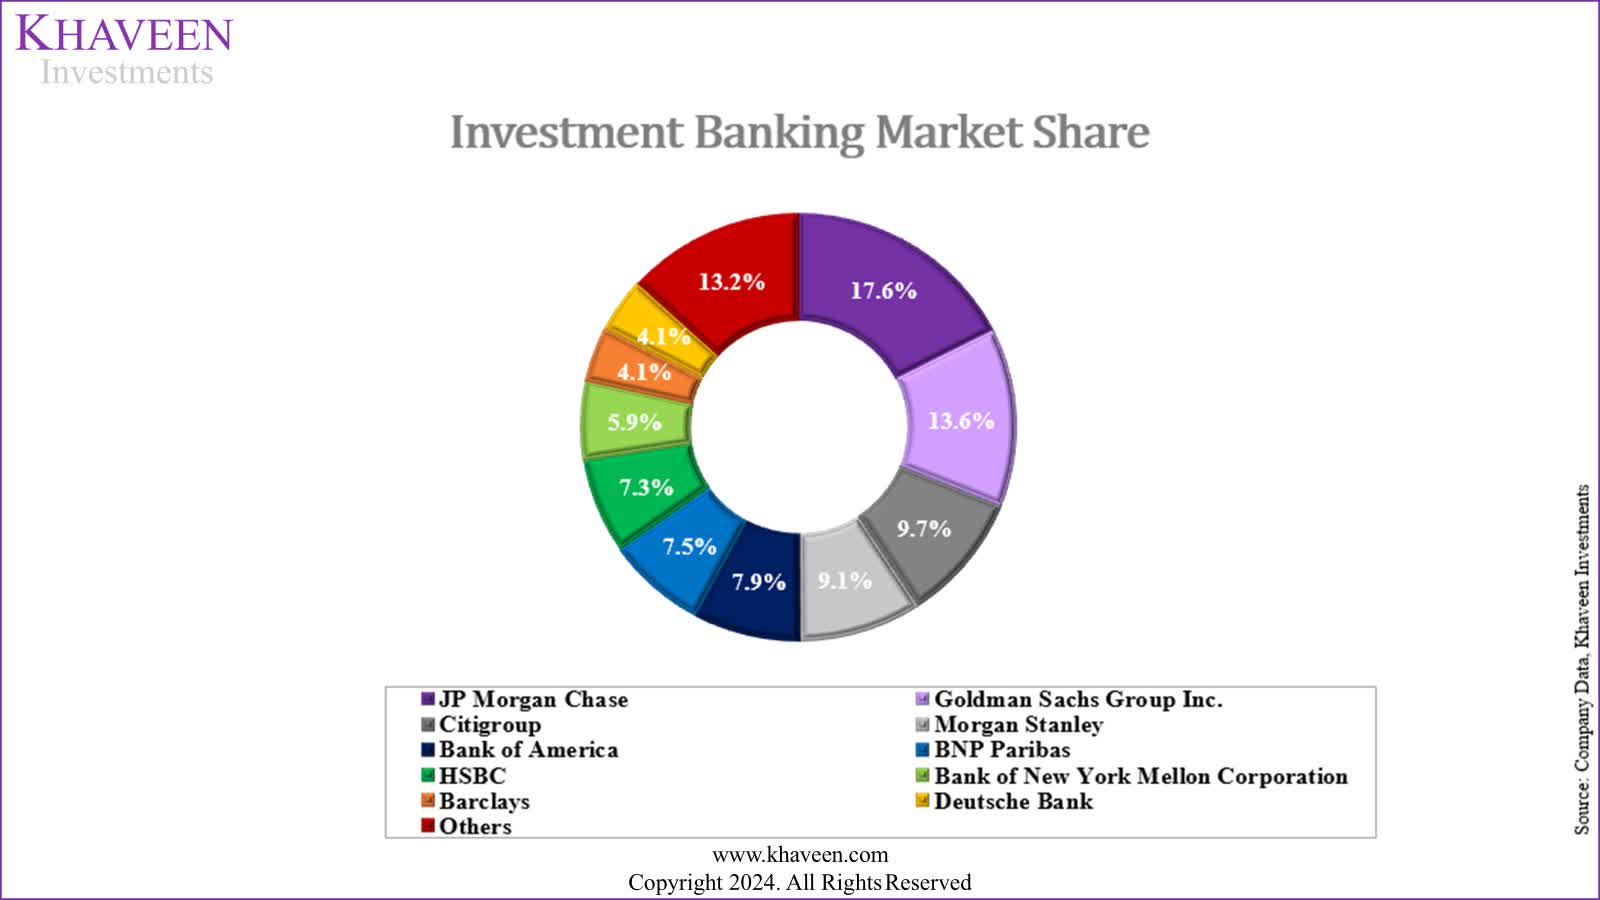
In terms of market share, we updated the investment banking market share from our previous analysis with the latest 2023 company figures based on 26 total companies. JPMorgan continued to lead with the highest market share of 17%, maintaining its leading position compared to 2022 (17%), highlighting JPMorgan’s top position in investment banking.
Asset & Wealth Management
Company Data, Khaveen Investments Company Data, Khaveen Investments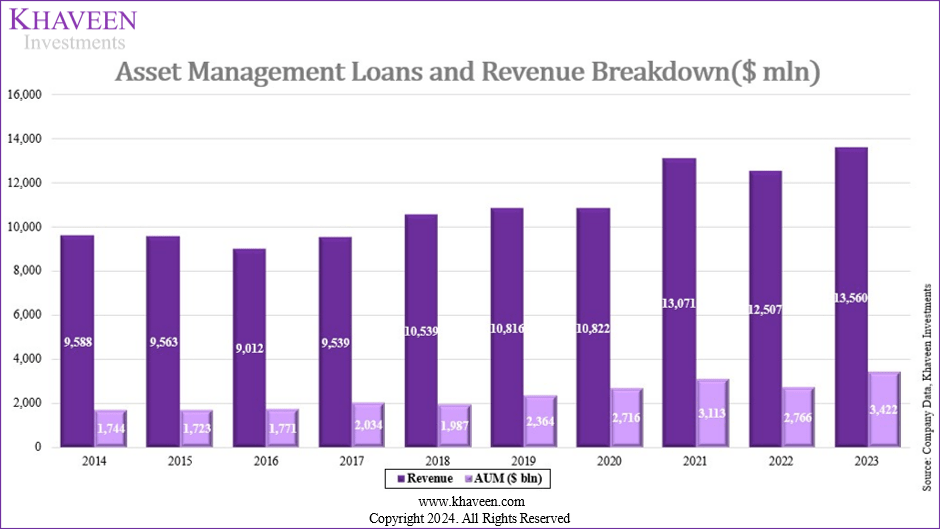
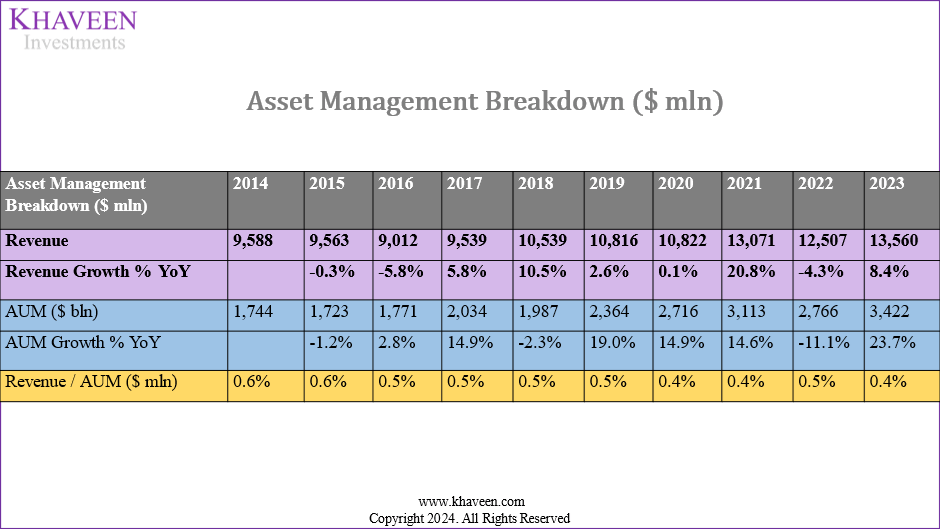
In terms of JPMorgan’s Asset Management segment, the average annual revenue growth was 4.21%. In contrast, the average annual growth in AUM was significantly higher at 8.35%, indicating a robust expansion in the volume of assets managed. Furthermore, this may also reflect JPM’s solid reputation, as it secured 11 of Forbes’ wealth management awards in 2023. Additionally, another factor for its AUM growth could be its declining revenue % of AUMs, which showed a gradual decline from 0.55% to 0.4%, which indicates that while AUM increased substantially, revenue growth did not keep pace proportionally, possibly due to the company lowering fees to attract more funds.
Company Data, Khaveen Investments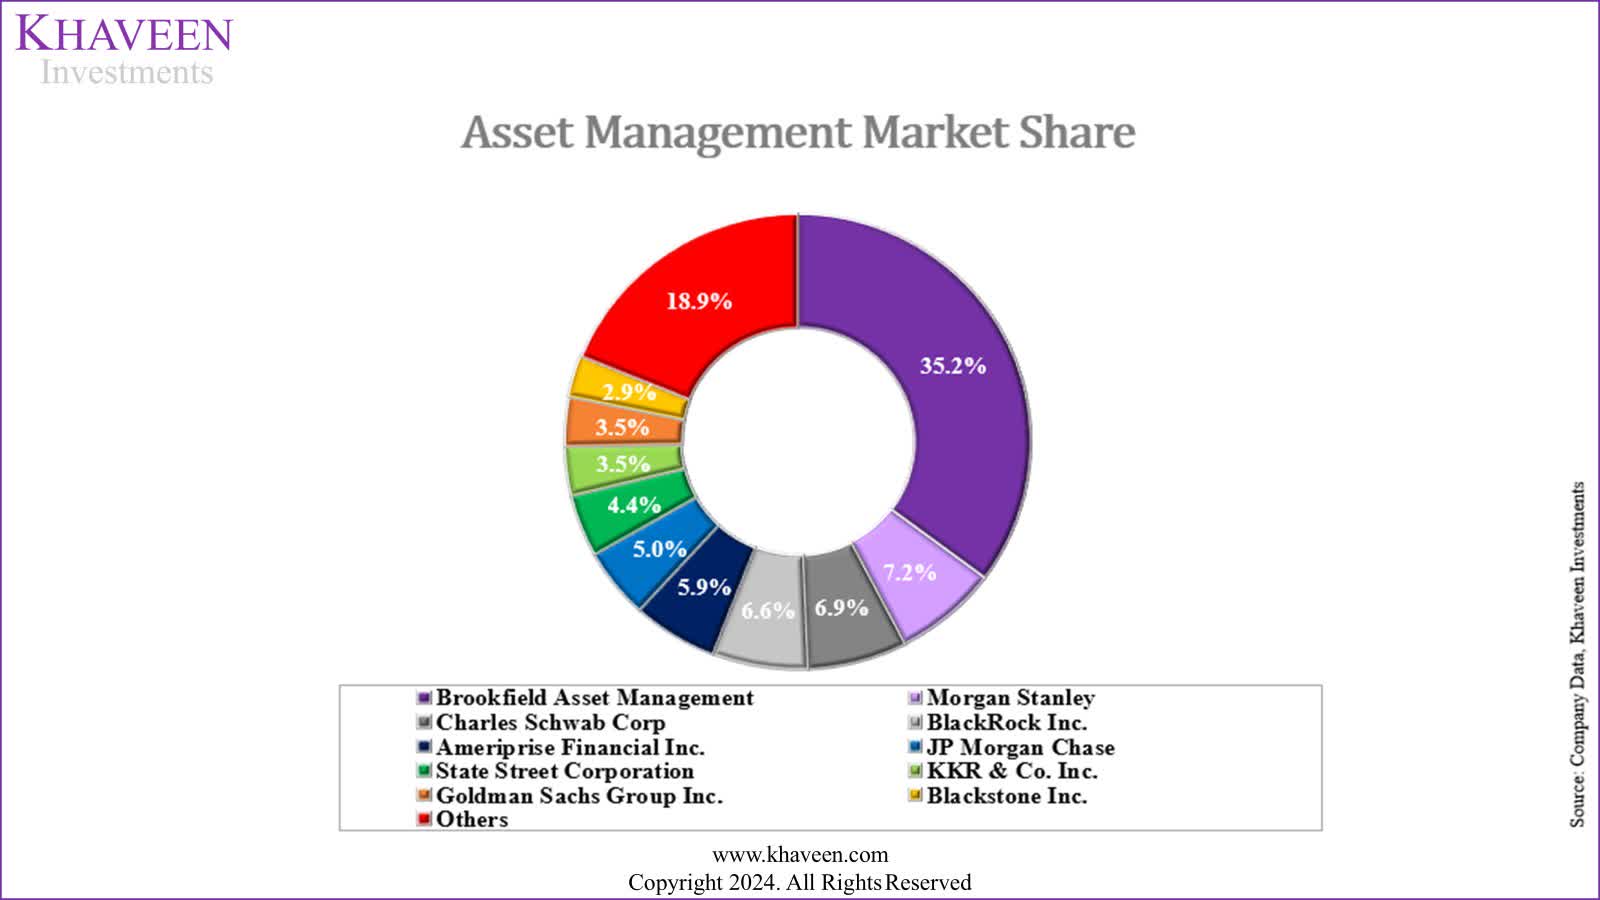
In terms of market share of the asset management market which we updated from our previous analysis, JPMorgan ranks 6th overall with a 5% market share in 2023, an increase of 4.7% compared to the previous year.
Commercial Banking
Company Data, Khaveen Investments Company Data, Khaveen Investments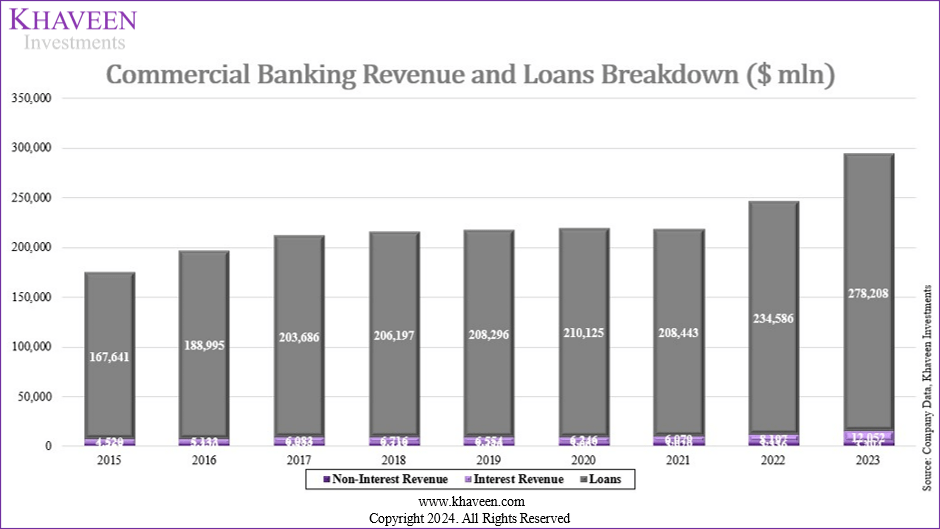
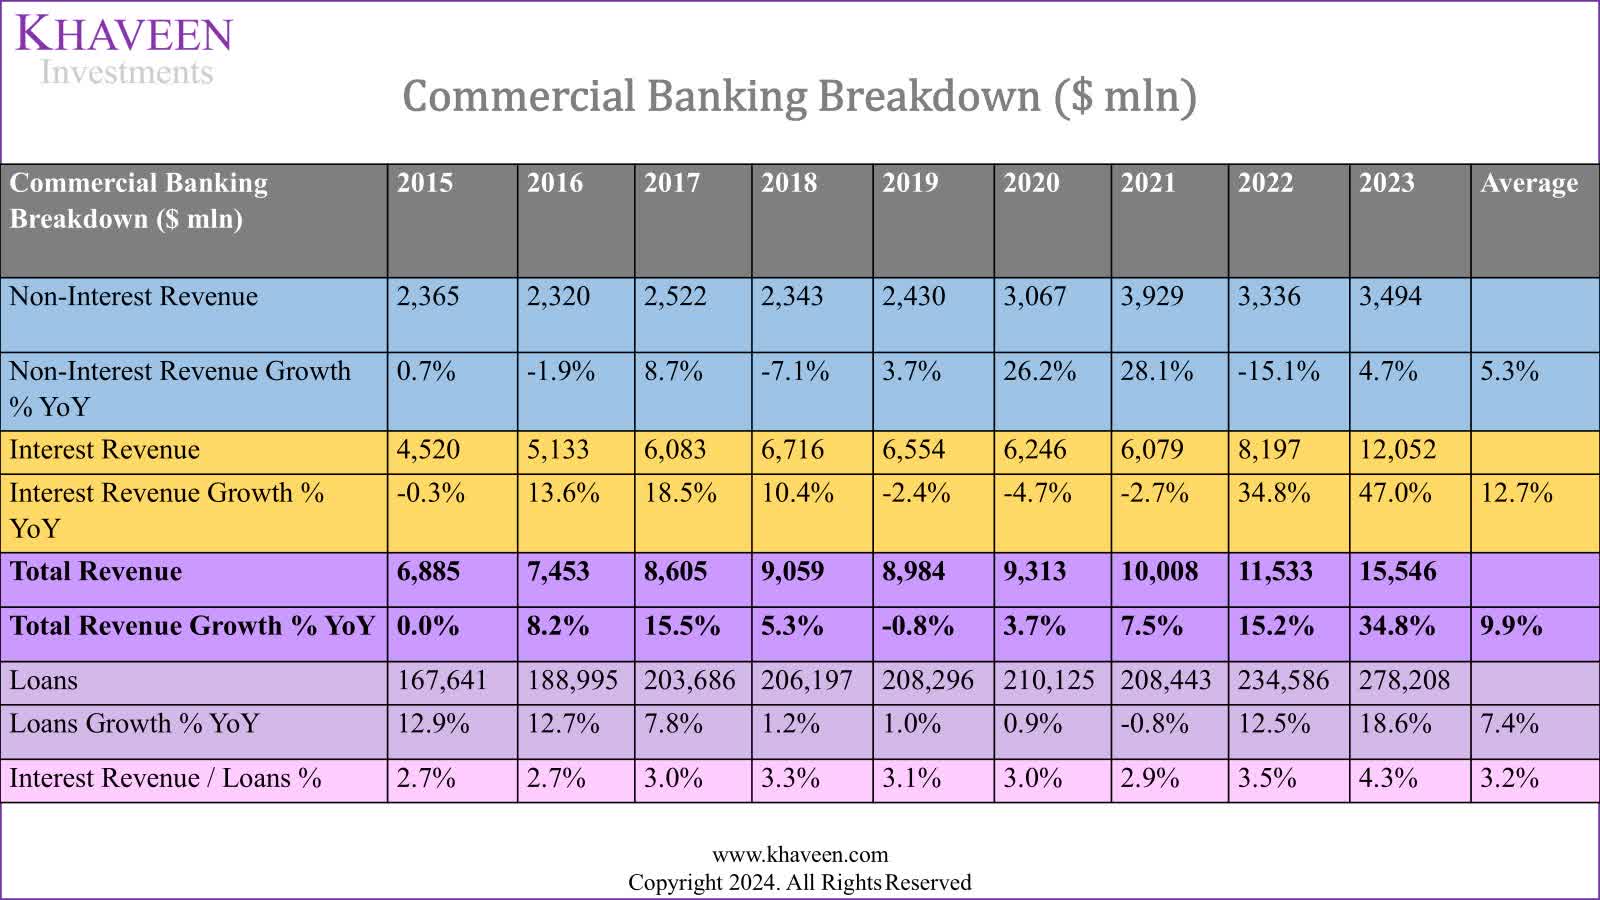
Finally, JPMorgan’s Commercial Banking segment has shown a robust average growth rate of 9.93%. Interest Revenue, the larger contributor, had an average growth rate of 12.7%, outpacing Non-Interest Revenue at 5.34%. The segment’s loan portfolio has expanded steadily, with an average growth rate of 7.43%. This growth in loans has been complemented by an increase in interest revenue as a percentage of loans, which rose from 2.7% in 2015 to 4.3% in 2023.
Outlook
All in all, we believe that the company’s fundamentals are strong, with its performance across its 4 main segments having positive average growth over the past 10-year, with the strongest segment being Commercial Banking (10%). Furthermore, the Consumer & Community Banking segment’s average growth is 5.7%, in line with the company’s total growth. Net interest income is a primary growth driver for both of these segments, with an average growth of 8.4% and 12.7% in Consumer & Community Banking and Commercial Banking respectively. We analyzed the loan growth supporting its net interest income growth with an average growth rate of 7.4% and 4.6% respectively. According to TABInsights, global loan growth is forecasted to grow by 6% in 2024. Moreover, we expect loan demand to be supported by economic growth, the US real GDP is expected to grow at 2.7% and around 2.1% in the long-term while global long-term GDP growth is projected to be at 3.2% this year and accelerate slightly by 0.1% to 3.3% in 2025 based on IMF data. For Consumer & Community Banking, we identified the strong loan segments with strong growth as Card Services, driven by growth in credit card debt, as well as Banking and Wealth Management. In terms of consumer spending, the Congressional Budget Office (CBO) projected an average annual growth rate of approximately 2% from 2026 to 2033. Furthermore, Home Lending is the largest segment for Consumer & Community Banking loans and is highly correlated with its total loan growth. However, the homeownership rate in the US is projected to remain stagnant at 62% by 2040 and the US real estate market is forecasted to grow at a CAGR of 2.6%.
Furthermore, the Asset & Wealth Management segment was the second-best performing segment with an average of 5.9%, in line with the company’s total average growth. Its segment growth was primarily attributed to AUM growth at an average of 8.35%. According to Growth Market Reports, global AUMs are forecasted to grow at a CAGR of 7.3%. One of the drivers for this is the growth in household income, with CBO projecting US gross domestic income to grow at an average of 4% through 2033. Another driver for household income growth would be capital gains, as the total market capitalizations of companies listed on stock exchanges worldwide from 2014 to 2023 grew by 5.75% annually, based on Statista. Another driver could be corporate earnings, whereby corporate profits in the United States from 2014 to 2023 grew by 4.39%. Furthermore, in Corporate & Investment Bank, the main driver of growth is the Payments and others segment with an average growth of 12.3%, which includes corporate treasury services and payment processing for businesses. The total revenue of businesses in the US is projected to grow at a CAGR of 12%, which could bode well for the Corporate & Investment Bank segment. Based on our previous analysis, we highlighted JPMorgan’s growing market share (4.4% in 2021 to 4.7% in 2022) and strong competitive strength within Asset Management, whereby in 2022, JPMorgan “gained market share in asset management and is ranked 5th despite its revenue decreased by 4.3% compared to GS (11.7%) and MS (-1.9%)”.
Financial Stability Based on CAMELS Framework
Next, we examined whether the company has a stable financial position based on the CAMELS framework, which is used for assessing the health of financial institutions. CAMELS stands for “Capital Adequacy, Asset Quality, Management Quality, Earnings, Liquidity, and Sensitivity to Market Risk”. Each component assesses different aspects of a financial institution in terms of its capital adequacy, quality of loans, effectiveness of management’s cost controls, ability to fulfill short-term obligations and risk exposure to market fluctuations.
We compiled and analyzed the company in terms of ratio analysis based on CAMELS including Capital Adequacy Ratios (Tier 1 and Total CAR), Asset Quality (NPL Ratio And Provision Coverage Ratio), Management Quality (Management Efficiency Ratio), Earnings (ROA, ROE, NIM), Liquidity (Current Ratio, Quick Ratio, Cash Ratio, LDR Ratio, Liquidity Coverage Ratio), Sensitivity to Market Risk (VAR) of JPMorgan as well as Goldman Sachs (GS), Morgan Stanley (MS), Bank of America (BAC), Citi (C), UBS (UBS), Deutsche Bank (DB), Barclays (BCS), HSBC (HSBC) and Wells Fargo (WFC).
Capital Adequacy Ratio
|
Companies |
Tier 1 CAR Ratio (5-year) |
Total CAR Ratio (5-year) |
Tier 1 CAR Ratio (2023) |
Total CAR Ratio (2023) |
Min Requirement (Basel III) |
GSIB |
Stress Capital Buffer |
Total Requirement |
Excess |
Tier 1 CAR Ranking (5-year) |
Total CAR Ranking (5-year) |
Overall Capital Adequacy Ranking |
|
JPMorgan |
15.1% |
17.1% |
15.1% |
18.5% |
4.50% |
4.50% |
3.30% |
12.30% |
6.2% |
6 |
6 |
6.0 |
|
Goldman Sachs |
13.6% |
16.1% |
12.4% |
15.4% |
4.50% |
3.50% |
5.50% |
13.50% |
1.9% |
8 |
7 |
7.5 |
|
Morgan Stanley |
17.7% |
20.2% |
17.1% |
19.5% |
4.50% |
3.00% |
5.40% |
12.90% |
6.6% |
3 |
2 |
2.5 |
|
Bank of America |
13.2% |
15.3% |
15.2% |
16.6% |
4.50% |
3.00% |
2.50% |
10.00% |
6.6% |
9 |
10 |
9.5 |
|
Citi |
13.6% |
15.6% |
13.6% |
15.1% |
4.50% |
3.50% |
4.30% |
12.30% |
2.8% |
7 |
8 |
7.5 |
|
UBS |
19.1% |
20.0% |
16.8% |
16.8% |
4.50% |
1.50% |
9.10% |
8.00% |
8.8% |
1 |
3 |
2.0 |
|
Deutsche Bank |
15.5% |
17.9% |
16.1% |
18.6% |
4.50% |
1.50% |
9.30% |
9.50% |
9.1% |
5 |
5 |
5.0 |
|
Barclays |
17.8% |
20.7% |
17.6% |
19.9% |
4.50% |
1.50% |
4.70% |
9.00% |
10.9% |
2 |
1 |
1.5 |
|
HSBC |
17.0% |
19.5% |
17.3% |
20.2% |
4.50% |
2.00% |
6.40% |
9.00% |
11.2% |
4 |
4 |
4.0 |
|
Wells Fargo |
12.8% |
15.5% |
13.0% |
15.7% |
4.50% |
1.50% |
2.90% |
8.90% |
6.8% |
10 |
9 |
9.5 |
|
Average |
15.5% |
17.8% |
15.1% |
18.5% |
4.5% |
2.6% |
5.3% |
10.5% |
7.1% |
Source: Company Data, Khaveen Investments
For financial institutions, there is a minimum capital requirement of 4.5% of Tier 1 capital under the Basel III framework, plus a GSIB (Global Systemically Important Bank) surcharge, which is generally between 1% to 4.5%, depending on the size and systemic importance of the firm. Additionally, banks must maintain a stress capital buffer requirement, which is determined by regulators through stress testing to ensure they can withstand economic downturns. JPMorgan has a low SCB requirement compared to other banks, which indicates its financial soundness.
JPMorgan’s Tier 1 CAR and Total CAR over the past five years are averaged at 15.1% and 17.1%, respectively, fairly in line with the overall average. In 2023, JPMorgan’s ratios are 15.1% for Tier 1 CAR and 18.5% for Total CAR, with the Tier 1 CAR remaining consistent while the Total CAR improved, which indicates that its Tier 2 capital which includes subordinated debt and other instruments increased, leading to the improvement. JPMorgan has one of the highest capital ratio requirements at a total of 12.3% in 2024. Compared to its actual Total CAR, it has a positive surplus, indicating stronger capital adequacy. Overall, we believe these comparisons highlight JPMorgan’s stable capital adequacy.
On the other hand, competitors such as Morgan Stanley and Barclays both consistently have high capital ratios, with Barclays having the highest Total CAR average at 20.7%. UBS also stands out with the highest 5-year average Tier 1 CAR of 19.1%, although its 2023 figures have normalized. Conversely, Wells Fargo has the lowest Tier 1 CAR in both the 5-year average and 2023, indicating a comparatively weaker capital position.
Asset Quality
|
Companies |
Non-Performing Loans % |
Provision Coverage Ratio (Provisions / Gross NPLs) |
Non-Performing Loans Ranking |
Provision Coverage Ratio Ranking |
Overall Asset Quality Ranking |
|
JPMorgan |
0.67% |
2.23 |
4 |
2 |
3 |
|
Goldman Sachs |
1.26% |
1.74 |
9 |
4 |
6.5 |
|
Morgan Stanley |
0.42% |
0.73 |
1 |
8 |
4.5 |
|
Bank of America |
0.59% |
2.08 |
3 |
3 |
3 |
|
Citi |
0.80% |
2.97 |
6 |
1 |
3.5 |
|
UBS |
0.72% |
1.20 |
5 |
6 |
5.5 |
|
Deutsche Bank |
0.53% |
0.29 |
2 |
9 |
5.5 |
|
Barclays |
2.01% |
0.23 |
10 |
10 |
10 |
|
HSBC |
1.25% |
0.97 |
8 |
7 |
7.5 |
|
Wells Fargo |
0.85% |
1.65 |
7 |
5 |
6 |
|
Average |
0.91% |
1.41 |
Source: Company Data, Khaveen Investments
Based on the table, Morgan Stanley has the lowest non-performing loans at 0.42% of total loans, indicating better asset quality compared to its peers. Deutsche Bank and Bank of America also perform well with NPLs of 0.53% and 0.59%, respectively, while JPMorgan has slightly higher NPLs at 0.67%, ranking fourth among the listed banks. In terms of the Provision Coverage Ratio, which measures the extent to which provisions cover gross non-performing loans, Citi stands out with the highest ratio of 2.97, signaling robust coverage for potential loan losses.
JPMorgan is also strong in this area with a ratio of 2.23, positioning it second. In contrast, Barclays and Deutsche Bank have lower coverage ratios of 0.23 and 0.29, respectively, suggesting less provision relative to their NPLs. Notably, JPMorgan, Goldman Sachs, Bank of America, Citi, and Wells Fargo exceed the average provision coverage ratio of 1.41, indicating a higher level of preparedness to absorb potential loan losses compared to the industry average. Overall, we believe JPMorgan, while does not stand out as the best in Asset Quality, is positive given its ratios being better than average.
Management Quality
|
Companies |
Bank Management Efficiency Ratio |
Bank Management Efficiency Ratio Ranking |
|
JPMorgan |
59.5% |
1 |
|
Goldman Sachs |
62.6% |
2 |
|
Morgan Stanley |
72.0% |
7 |
|
Bank of America |
64.7% |
5 |
|
Citi |
64.5% |
4 |
|
UBS |
77.2% |
9 |
|
Deutsche Bank |
84.8% |
10 |
|
Barclays |
67.6% |
6 |
|
HSBC |
63.2% |
3 |
|
Wells Fargo |
73.1% |
8 |
|
Average |
68.9% |
Source: Company Data, Khaveen Investments
Based on the Bank Management Efficiency Ratio, which reflects how effectively a bank controls its operating expenses, JPMorgan ranks highest in management quality with a ratio of 59.5%, significantly below the industry average of 68.9%. JPMorgan’s lower ratio indicates superior efficiency and cost control compared to its peers. Goldman Sachs, Bank of America, and Citi also demonstrate strong management efficiency with ratios below the average, while UBS, Deutsche Bank, and Barclays show higher ratios, implying relatively less efficiency in managing expenses. Overall, we believe JPMorgan’s top ranking highlights its effective expense management and operational efficiency compared to competitors.
Earnings
|
Companies |
ROA (5-year Average) |
ROE (5-year Average) |
NIM (5-year Average) |
ROA (5-year Average) Ranking |
ROE (5-year Average) Ranking |
NIM (5-year Average) Ranking |
Overall Earnings Ranking |
|
JPMorgan |
1.16% |
15.40% |
2.9% |
1 |
2 |
2 |
1.7 |
|
Goldman Sachs |
0.96% |
12.32% |
0.8% |
3 |
3 |
10 |
5.3 |
|
Morgan Stanley |
1.06% |
12.06% |
1.1% |
2 |
4 |
8 |
4.7 |
|
Bank of America |
0.94% |
10.04% |
2.3% |
4 |
5 |
4 |
4.3 |
|
Citi |
0.70% |
7.82% |
3.0% |
7 |
7 |
1 |
5.0 |
|
UBS |
0.88% |
16.78% |
0.9% |
5 |
1 |
9 |
5.0 |
|
Deutsche Bank |
0.16% |
1.56% |
1.8% |
10 |
10 |
7 |
9.0 |
|
Barclays |
0.36% |
5.76% |
1.9% |
9 |
9 |
6 |
8.0 |
|
HSBC |
0.48% |
6.32% |
2.2% |
8 |
8 |
5 |
7.0 |
|
Wells Fargo |
0.80% |
8.56% |
2.9% |
6 |
6 |
3 |
5.0 |
|
Average |
0.8% |
9.7% |
2.0% |
Source: Company Data, Khaveen Investments
JPMorgan exhibits strong financial performance with a 5-year average Return on Assets (ROA) of 1.16% and Return on Equity (ROE) of 15.40%, both surpassing the industry averages of 0.8% and 9.7%, respectively. These figures reflect JPMorgan’s robust profitability and effective use of assets and equity to generate returns. In terms of Net Interest Margin (NIM), which measures the efficiency of earning income from interest-bearing assets, Citi leads with a margin of 3.0%, while JPMorgan and Wells Fargo are closely behind at 2.9%. This high NIM highlights JPMorgan’s strong ability to generate income from its lending activities relative to its interest expenses, demonstrating effective management of its core banking operations. Overall, we believe JPMorgan ranks highly in terms of Earnings.
Liquidity
|
Companies |
Current Ratio (5-year Average) |
Quick Ratio (5-year Average) |
Cash Ratio |
Loan-to-Deposit Ratio |
Liquidity Coverage Ratio (5-year Average) |
Current Ratio (5-year Average) Ranking |
Quick Ratio (5-year Average) Ranking |
Cash Ratio Ranking |
Loan-to-Deposit Ratio Ranking |
Liquidity Coverage Ratio Ranking (5-year Average) |
Overall Liquidity Ranking |
|
JPMorgan |
0.87 |
0.44 |
0.82 |
0.52 |
1.12 |
7 |
8 |
3 |
3 |
10 |
5.3 |
|
Goldman Sachs |
1.78 |
1.44 |
1.26 |
0.47 |
1.27 |
2 |
1 |
1 |
2 |
6 |
3.0 |
|
Morgan Stanley |
1.90 |
1.32 |
1.10 |
0.61 |
1.32 |
1 |
2 |
2 |
6 |
5 |
4.3 |
|
Bank of America |
0.81 |
0.32 |
0.32 |
0.55 |
1.17 |
10 |
9 |
9 |
5 |
8 |
7.3 |
|
Citi |
0.99 |
0.44 |
0.44 |
0.52 |
1.16 |
5 |
6 |
7 |
4 |
9 |
6.7 |
|
UBS |
1.07 |
0.48 |
0.48 |
1.29 |
1.62 |
4 |
5 |
6 |
10 |
3 |
6.3 |
|
Deutsche Bank |
0.83 |
0.6 |
0.60 |
0.77 |
1.64 |
9 |
4 |
5 |
9 |
2 |
5.3 |
|
Barclays |
1.41 |
0.7 |
0.70 |
0.74 |
1.72 |
3 |
3 |
4 |
8 |
1 |
4.3 |
|
HSBC |
0.96 |
0.44 |
0.44 |
0.43 |
1.35 |
6 |
6 |
7 |
1 |
4 |
4.0 |
|
Wells Fargo |
0.85 |
0.26 |
0.26 |
0.67 |
1.24 |
8 |
10 |
10 |
7 |
7 |
8.0 |
|
Average |
1.15 |
0.64 |
0.64 |
0.66 |
1.36 |
Source: Company Data, Khaveen Investments
JPMorgan’s 5-year average Current Ratio of 0.87 and Quick Ratio of 0.44 are both below the industry averages of 1.15 and 0.64, respectively, indicating relatively lower short-term liquidity and potential challenges in covering immediate liabilities. Despite this, JPMorgan maintains a strong Cash Ratio of 0.82, surpassing the average of 0.64, which reflects a solid cash position relative to its liabilities. The bank’s Loan-to-Deposit Ratio of 0.52 is favorable compared to the average of 0.66, suggesting robust liquidity management. However, its Liquidity Coverage Ratio of 1.12 is below the industry average of 1.36, pointing to potential concerns in covering short-term financial obligations. Overall, while we determined JPMorgan has some strengths in cash availability and loan-to-deposit management, it pales in terms of short-term liquidity coverage compared to competitors.
Sensitivity to Market Risk
|
Companies |
VaR |
Net Income ($ mln) (2023) |
VaR % of Net Income |
VaR % of Net Income Ranking |
|
JPMorgan |
58.8 |
49,552 |
0.12% |
2 |
|
Goldman Sachs |
89.4 |
8,516 |
1.05% |
9 |
|
Morgan Stanley |
49.6 |
9,087 |
0.55% |
6 |
|
Bank of America |
92.4 |
26,515 |
0.35% |
5 |
|
Citi |
131.8 |
12,227 |
1.08% |
10 |
|
UBS |
29.6 |
27,849 |
0.11% |
1 |
|
Deutsche Bank |
35.66 |
5,268 |
0.68% |
7 |
|
Barclays |
54.4 |
6,704 |
0.81% |
8 |
|
HSBC |
50.54 |
23,533 |
0.21% |
3 |
|
Wells Fargo |
52.8 |
19,142 |
0.28% |
4 |
|
Average |
64.50 |
0.52% |
5.5 |
Source: Company Data, Khaveen Investments
Furthermore, we analyzed the top companies’ sensitivity to market risks by calculating the Value at Risk (VaR) as a percentage of Net Income, where JPMorgan is ranked first with a VaR of 0.12%, lower than the average of 0.52%. VaR is “a statistic that quantifies the extent of possible financial losses within a firm, portfolio, or position over a specific time frame”. This indicates that JPMorgan has a stronger risk management framework with less exposure to potential losses relative to its net income.
Outlook
|
Overall CAMELS Ranking |
JPMorgan |
Goldman Sachs |
Morgan Stanley |
Bank of America |
Citi |
UBS |
Deutsche Bank |
Barclays |
HSBC |
Wells Fargo |
|
Capital Adequacy Ranking |
6.0 |
7.5 |
2.5 |
9.5 |
7.5 |
2.0 |
5.0 |
1.5 |
4.0 |
9.5 |
|
Asset Quality Ranking |
3.0 |
6.5 |
4.5 |
3.0 |
3.5 |
5.5 |
5.5 |
10.0 |
7.5 |
6.0 |
|
Management Quality Ranking |
1.0 |
2.0 |
7.0 |
5.0 |
4.0 |
9.0 |
10.0 |
6.0 |
3.0 |
8.0 |
|
Earnings Ranking |
1.7 |
5.3 |
4.7 |
4.3 |
5.0 |
5.0 |
9.0 |
8.0 |
7.0 |
5.0 |
|
Liquidity Ranking |
5.3 |
3.0 |
4.3 |
7.3 |
6.7 |
6.3 |
5.3 |
4.3 |
4.0 |
8.0 |
|
Sensitivity to Market Risk Ranking |
2.0 |
9.0 |
6.0 |
5.0 |
10.0 |
1.0 |
7.0 |
8.0 |
3.0 |
4.0 |
|
Overall Ranking |
3.17 |
5.56 |
4.83 |
5.69 |
6.11 |
4.81 |
6.97 |
6.31 |
4.75 |
6.75 |
Source: Company Data, Khaveen Investments
Overall, based on CAMELS, we believe JPMorgan displays excellent financial stability and effective management. We compiled and summarized our rankings in the table above based on the metrics analyzed. Overall, JPMorgan is the first among the 10 companies compared, with an average ranking score of 3.17. We ranked JPMorgan highly in Management Quality in terms of the Management Efficiency Ratio, where it ranks 1st, reflecting superior operational efficiency and cost control. JPMorgan also stands out with high rankings in Earnings in terms of ROA (1st) and ROE (2nd), indicating strong profitability and effective use of assets and equity. Its Net Interest Margin is also robust, ranking 2nd. However, JPMorgan’s rankings in Liquidity and Capital Adequacy are relatively weaker than competitors. It is ranked lower in the Current Ratio (7th) and Quick Ratio (8th).
Its Tier 1 CAR Ratio (6th) and Total CAR Ratio (6th) are moderate compared to its peers, indicating that while it maintains solid capital ratios, other banks are slightly more capitalized. The company’s Liquidity Coverage Ratio is relatively low at 10th, which highlights challenges in meeting short-term obligations. In comparison, Goldman Sachs and Morgan Stanley also show strong performances in areas such as ROA and ROE, but Goldman Sachs outperforms JPMorgan in Liquidity Coverage Ratio and Quick Ratio, while Morgan Stanley leads in Non-Performing Loans % and ROA. UBS ranks highly in Total CAR Ratio and Liquidity Coverage Ratio, showing robust capital and liquidity positions.
Relative High Return Compared to Credit Rating
Finally, we examined whether the company’s bonds have a healthy yield relative to credit rating by comparing the outstanding bonds with its top competitors.
We compiled the top 10 fixed-income securities with the highest coupon rates, including both bonds and preference shares for top Financial companies including JPMorgan, Goldman Sachs, Morgan Stanley, Bank of America, Citi, UBS, Deutsche Bank, Barclays, HSBC, and Wells Fargo, along with the credit rating of each company. We then compared each of the company’s average coupon rates to the total average.
|
Company |
Average Coupon Rate |
Fitch |
Moody’s |
S&P |
Average Credit Rating Score |
Coupon Rate to Credit Rating Score Ratio |
|
JPMorgan |
7.930% |
AA- |
A1 |
A- |
5.3 |
1.49% |
|
Bank of America Corporation |
7.122% |
AA- |
A1 |
A- |
5.3 |
1.34% |
|
Wells Fargo |
6.785% |
A+ |
A1 |
BBB+ |
6.0 |
1.13% |
|
Citigroup |
7.155% |
A |
A3 |
BBB+ |
7.0 |
1.02% |
|
HSBC |
5.986% |
A+ |
A3 |
A- |
6.3 |
0.95% |
|
Morgan Stanley |
5.833% |
A+ |
A1 |
A- |
5.7 |
1.03% |
|
Goldman Sachs |
7.320% |
A |
A2 |
BBB+ |
6.7 |
1.10% |
|
UBS Group |
4.376% |
A |
A3 |
A- |
6.7 |
0.66% |
|
Deutsche Bank |
6.546% |
A- |
A1 |
A |
6.0 |
1.09% |
|
Barclays PLC |
4.842% |
A |
Baa1 |
BBB+ |
7.3 |
0.66% |
|
Total Average |
6.390% |
6.23 |
1.05% |
Source: Company Data, Khaveen Investments
Based on the above, JPMorgan stands out with the highest average coupon rate among the listed top companies at 7.93%, which is higher compared to the overall average of 6.39%, followed by Goldman Sachs (7.320%), Citigroup (7.155%), and Bank of America Corporation (7.122%). Besides, JPMorgan also captures a strong credit rating assigned across the board by Fitch (AA-), Moody’s (A1), and S&P (A-). Furthermore, JPMorgan also has the highest coupon rate to credit rating ratio, which is calculated through average coupon rate over average credit rating, indicating a superior coupon rate relative to credit rating quality compared to competitors.
Seniority Ranking
Furthermore, we compiled the seniority of the top fixed-income securities for JPMorgan in the summary table below, with a corresponding ranking.
|
JPMorgan Fixed Income (ISIN) |
Current Coupon Rate |
Seniority Rating |
Ranking |
|
US06423AAJ25 |
8.750% |
Subordinated Unsecured |
5 |
|
US059438AK79 |
8.000% |
Senior Subordinated Unsecured |
4 |
|
US059438AG67 |
7.750% |
Senior Subordinated Unsecured |
4 |
|
US059438AH41 |
7.625% |
Senior Subordinated Unsecured |
4 |
|
XS2551868255 |
7.300% |
Senior Unsecured |
3 |
|
US48130CCX11 |
7.000% |
Senior Unsecured |
3 |
|
XS1449755450 |
6.620% |
Senior Unsecured |
3 |
|
US46625HHF01 |
6.400% |
Senior Unsecured |
3 |
|
XS1449855169 |
6.350% |
Senior Unsecured |
3 |
|
Average |
7.930% |
Source: Company Data, Cbonds, Khaveen Investments
Corporate Finance Institute
Based on the hierarchy pyramid above, JPMorgan’s top 9 securities which we selected based on their coupon rates, consist of mainly senior unsecured bonds with a small number of senior subordinated unsecured bonds and a single subordinated unsecured bond. Additionally, all 9 securities are unsecured, which indicates a lower priority regarding claims in the event of default compared to secured debts.
We further examined the fundamentals of the advantages of fixed-income securities generally below, including Volatility, Corporate Finance, and Market Structure.
Volatility
One key advantage of investing in fixed-income securities over equities is the generally “less volatility and downside risk” associated with the bond market, which contributes to the resilience of an investment portfolio. However, the typically lower volatility of fixed-income securities comes with a trade-off of “lower potential returns“, as bonds are limited to yields where stocks have the capacity for substantial capital appreciation and higher overall returns.
Corporate Finance
Additionally, in the event of a financial institution encountering liquidation or bankruptcy, fixed-income security holders, are prioritized over equity holders, as they “have the first priority to claim assets”, meaning they are first to receive any remaining assets. This hierarchy is due to the contractual obligations that the institution has towards its debt holders, which legally obligate it to repay debts before distributing any residual value to shareholders. This preferential treatment highlights the lower risk associated with fixed-income investments, as these investors have a higher likelihood of recovering their capital. On the other hand, equity holders, who are last in line, face greater risk but are compensated with the potential for higher returns if the company performs well, highlighting why fixed-income securities are relatively safer compared to equities.
Market Structure
In terms of market structure, we believe the historical incident of the US government interventions to support major financial institutions also suggests a lower risk for fixed-income investors of Financial companies. For instance, in 2009, Citigroup “received $45 billion as part of the federal bailout” as the company was facing bankruptcy. During a similar period, Bank of America also received support with a $20 bln bailout to stabilize its financial position during the depression. As a result, we believe government interventions may provide a layer of protection for bondholders, particularly major financial institutions deemed “too big to fail” as the government and regulators aimed to prevent the spread of systemic bank risk across the economy thus, and we believe indicates that Financial bonds may have advantages over other sectors due to potential government intervention in during high risk of bankruptcy.
Outlook
Overall, we believe JPMorgan’s bonds stand out as a relatively better choice compared to other bonds due to its higher overall coupon rate as well as the highest coupon rate to credit rating score ratio that we have derived, which indicates a higher yield with lower risks associated. Additionally, we believe the benefits of bonds considering the three key factors including volatility (lower volatility and downside risk compared to equities), corporate finance (higher priority to claim assets compared to equity holders), and market structures (high possibility of government interventions when facing liquidation) all reflects the relatively low risks of investing in bonds from institutions like JPMorgan.
Risk: Fixed Income Risks
While we highlighted the advantages of fixed income compared to equity, fixed income securities have several risks, including interest rate risk, credit risk, and liquidity risks in addition to all the economic risks that face the companies that issue these fixed income securities. Interest rate risk is where “rising interest rates can reduce the value of existing bonds”. However, the US Federal Reserve plans on cutting interest rates this year with a rate cut expected in September 2024 following the rate hike cycle from 2022, which could bode well for fixed-income securities. Credit risk involves potential defaults by issuers on payments, whereas liquidity risk is where fixed-income securities might not be easily sold.
Verdict
In summary, we believe JPMorgan is a solid company for fixed-income investors due to its strong and stable business fundamentals, financial stability and high relative return to crediting rating of fixed-income securities compared to peers. JPMorgan’s performance across its four main segments has been positive over the past decade, with the Commercial Banking Consumer & Community Banking segment’s growth being driven by interest income from loan growth which we believe stands to benefit from forecasted global loan growth of 6% in 2024. Whereas, we expect the Asset & Wealth Management segment to be supported by significant increases in global AUMs, which is forecasted to grow at a CAGR of 7.3%. Based on the CAMELS framework analysis, we believe the firm’s financial stability is highlighted by good management as seen with its superb management efficiency ratio, as well as profitability metrics such as ROA and ROE which are higher than its peers. Finally, we believe the firm’s higher relative coupon rates to credit rating to competitors indicate the attractiveness of its top fixed-income securities. Overall, due to these factors, we believe JPMorgan’s fixed-income securities could be an attractive investment.
Analyst’s Disclosure: I/we have a beneficial long position in the shares of JPM.PR.C either through stock ownership, options, or other derivatives. I wrote this article myself, and it expresses my own opinions. I am not receiving compensation for it (other than from Seeking Alpha). I have no business relationship with any company whose stock is mentioned in this article.
No information in this publication is intended as investment, tax, accounting, or legal advice, or as an offer/solicitation to sell or buy. Material provided in this publication is for educational purposes only, and was prepared from sources and data believed to be reliable, but we do not guarantee its accuracy or completeness.
Seeking Alpha’s Disclosure: Past performance is no guarantee of future results. No recommendation or advice is being given as to whether any investment is suitable for a particular investor. Any views or opinions expressed above may not reflect those of Seeking Alpha as a whole. Seeking Alpha is not a licensed securities dealer, broker or US investment adviser or investment bank. Our analysts are third party authors that include both professional investors and individual investors who may not be licensed or certified by any institute or regulatory body.