
Summary:
- KLA’s strong profitability remains a strong feature of the company, generating 20%+ free cash flow margins.
- Its large exposure to legacy nodes may seem like a sustainability issue but has proved to provide stable revenues.
- The company continues to build incremental market share gains in the overall semiconductor equipment market, cementing itself as a key player in the value chain.
SweetBunFactory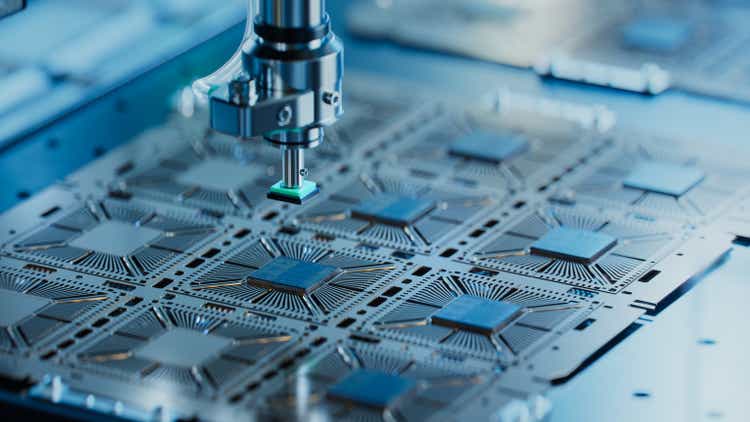
In our previous analysis, we highlighted KLA Corporation’s (NASDAQ:KLAC) process control equipment, emphasizing its patterning and wafer inspection segments, which contribute 44% of total revenues at a 33.3% average growth rate. We believe the shift to high NA EUV benefits KLA’s Wafer Inspection segment, supported by orders from key clients like TSMC and Samsung while the integration of optical and e-beam systems was expected to drive growth.
In this latest analysis, we revisit KLA, noting its robust performance as it concluded FY2023 with an impressive 13.94% revenue growth. While Q1 earnings experienced a modest 1.69% QoQ increase and a 12.02% YoY decline, we interpret this as a non-issue for the company, given historical trends of Q1 being a comparatively weaker quarter. The company underscores a stable business environment, attributing its revenue growth to investments in legacy nodes.
Superb Profitability
We previously highlighted KLA’s strong profitability as one of its major strengths. The company continues to maintain this advantage, and in fact, exceeded our gross margin expectation (60%) to report a 62.4% gross margin for Q1. However, Q2 guidance is for gross margins to decline to 61.5%, which is still higher than our forecast.
Company Data, Khaveen Investments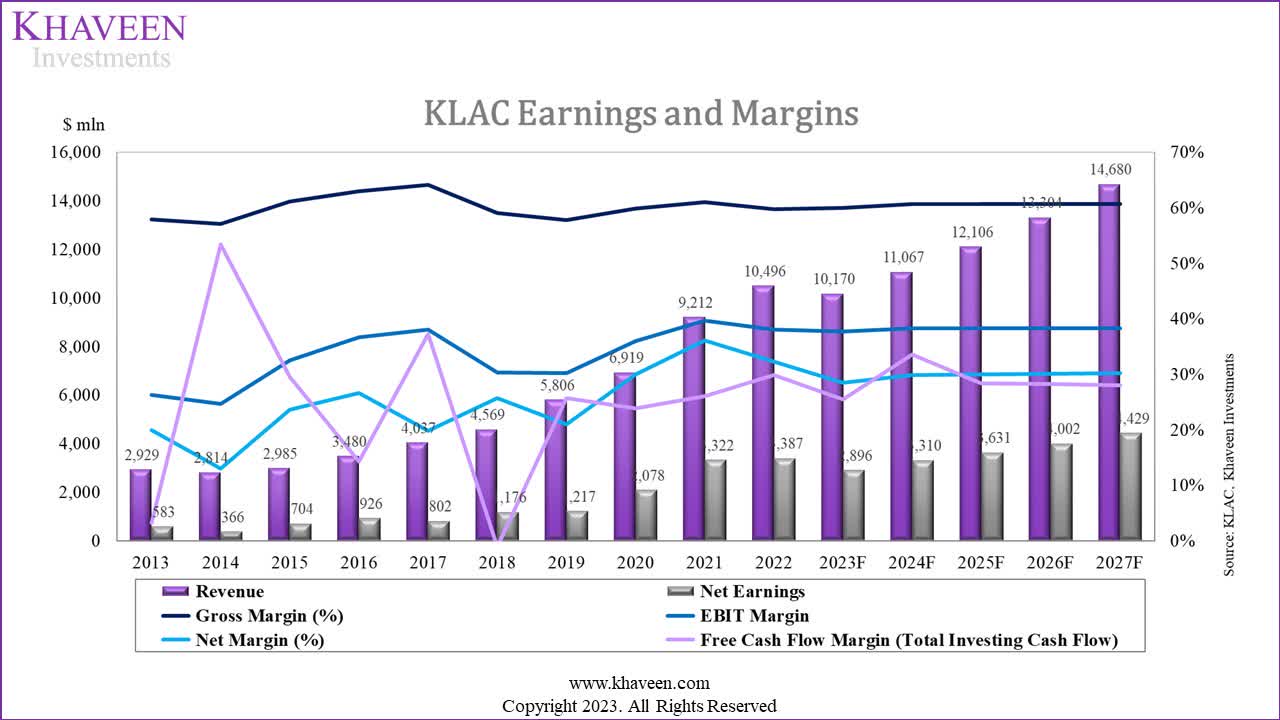
Additionally, its free cash flow margin for Q1 2023 is 30% while our forecasted 2023 FCF margin is 25.52%. The company’s past 5-year average FCF margin is 20.92%.
Furthermore, based on its latest earnings briefing, management highlighted the continuation to focus on its strategic objectives and emphasized its execution resulting in its strong FCF generation abilities.
With the KLA operating model guiding our best-in-class execution, we continue to implement our strategic objectives, which are here to drive outperformance. Our focus on customer success, delivering innovative and differentiated solutions, and operational excellence is what enables us to deliver industry-leading financial and free cash flow performance and return capital on a consistent basis. – Bren Higgins, CFO
Company Data, Khaveen Investments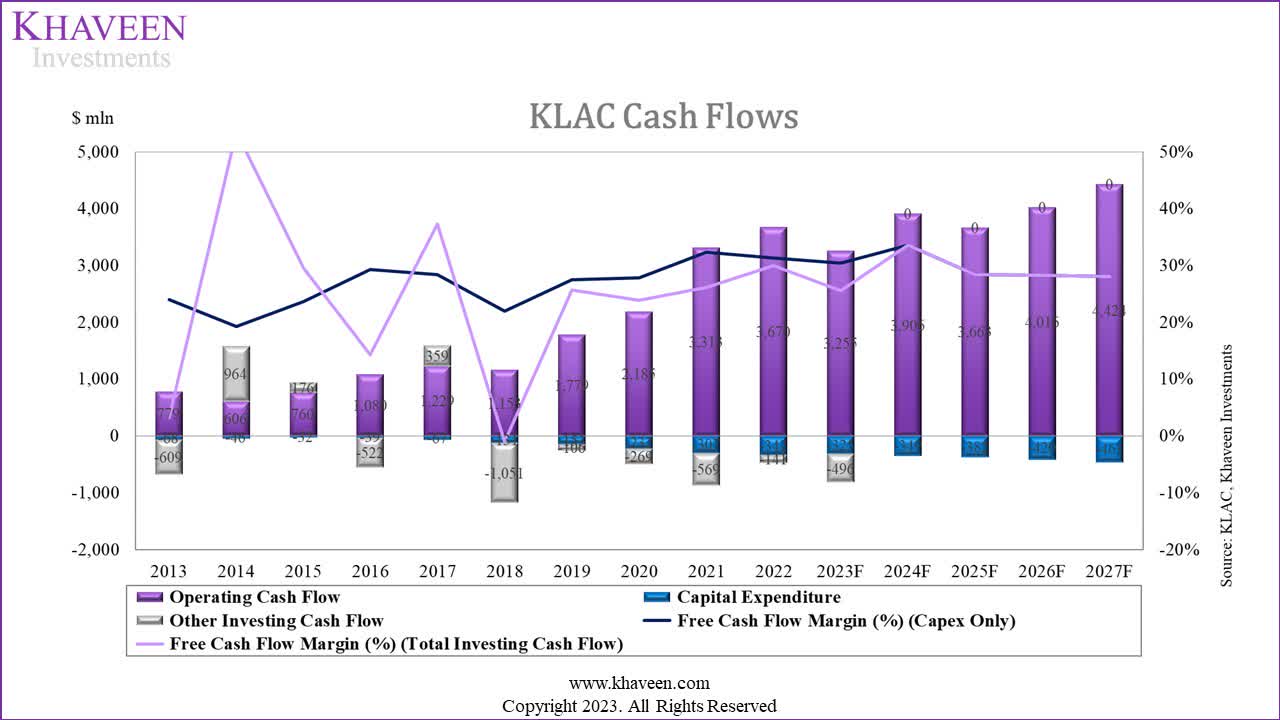
Based on our model, we derived a forecasted FCF margin of 25.52% (2023) assuming capex as a % of revenue of 3.2% and other investing cash flows of $496 mln based on TTM. Our 5-year forward average FCF margin of 28.7% is higher than its past 10-year average of 24.24%, as our forecast does not account for any acquisition costs. As seen in the chart, its FCF margin based on capex only is relatively more stable than its FCF margin based on total investing cash flows as the company made acquisitions in 2018 (Orbotech for $3.4 bln) and 2021 (ECI Technology for $460 mln).
Legacy Nodes Provide Stable Revenues
To examine the sustainability of the company’s revenue growth from legacy nodes, we break down its revenue by customer groups to understand exactly what products utilize legacy nodes.
SEMI, BCG
The chart above from SEMI gives us an idea of the breakdown in the market by nodes, and “the CHIPS and Science Act of 2022 defines legacy devices as those produced with 28-nanometer (nm) technology or larger”. We can see here that the Memory market represents a very small portion of legacy nodes. Should legacy nodes drive KLA’s revenue, we would see KLA’s revenue breakdown reflect it.
|
Semi Process Control Revenue Breakdown by Customer (CY) |
2016 |
2017 |
2018 |
2019 |
2020 |
2021 |
2022 |
Average |
|
Foundry & Logic Revenue |
1,977 |
1,223 |
2,530 |
2,847 |
3,900 |
4,359 |
6,527 |
|
|
Growth % |
-38.2% |
106.9% |
12.5% |
37.0% |
11.8% |
49.7% |
29.96% |
|
|
Foundry & Logic Share % |
58% |
31% |
62% |
60% |
68% |
55% |
70% |
|
|
Memory Revenue |
1,432 |
2,721 |
1,551 |
1,898 |
1,835 |
3,566 |
2,797 |
|
|
Growth % |
90.1% |
-43.0% |
22.4% |
-3.3% |
94.3% |
-21.6% |
23.15% |
|
|
Memory Share % |
42% |
69% |
38% |
40% |
32% |
45% |
30% |
|
|
Total Revenue |
3,409 |
3,944 |
4,081 |
4,745 |
5,735 |
7,925 |
9,324 |
|
|
Growth % |
15.7% |
3.5% |
16.3% |
20.8% |
38.2% |
17.7% |
18.69% |
*2016 and 2018 based on Q3
Source: Company Data, Khaveen Investments
Based on the breakdown above, we can see that the company’s revenue mix has been shifting away from memory over the past few years, and towards non-memory. Memory revenue in fact declined by 21.6% in FY2023. This confirms what KLA is saying about its revenue drivers being from legacy nodes.
IC Insights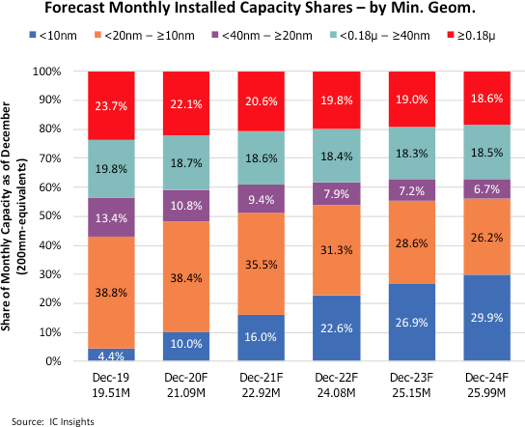
In our previous analysis of United Microelectronics Corporation (UMC), an IC Insights forecast (chart above) showed that while the market share for advanced nodes was forecasted to grow rapidly, the market share for certain legacy nodes, especially in the >40 nm range, is forecasted to remain steady. We find many chips still utilize legacy nodes for various applications, as shown in the table below.
|
Type |
Chip |
Application |
|
Logic |
MCUs |
Automotive |
|
FPGA |
Communications Equipment |
|
|
DAO |
RF |
Smartphones, Communications Equipment |
|
Wi-Fi Chips |
IoT applications |
|
|
Security Controllers |
Payment Terminals |
|
|
PMIC |
Automotive |
Source: Company Data, Khaveen Investments
Most of the chips are still in demand in 40nm except for FPGA which are moving to more advanced nodes. KLA mentioned that demand from China is seeing strength from legacy nodes, which we believe is crucial given that 43% of its revenue is derived from China in Q1. As we have examined the impact of bans and restrictions on various types of chipmakers to determine the impact on their revenues, we consider the risk to KLA to be minimal. Given most of the bans and restrictions targeted advanced chip manufacturing, sales of legacy node-related chips and equipment are largely not covered under US restrictions.
Based on the chart below from our previous analysis of Taiwan Semiconductor Manufacturing Company Limited (TSM) vs SMIC, we can see that SMIC’s nodes are mostly legacy nodes. We believe SMIC’s revenue breakdown is reflective of the Chinese market and similar to KLA’s revenue exposure as SMIC’s customer base is also majority from China (50%).
Company Data, Khaveen Investments
Hence, we believe that the legacy nodes’ share of the market will remain stable enough for KLA to continue to serve it. Additionally, we believe KLA’s revenue exposure to China positions it optimally to maximize its revenue demand from legacy nodes. While risks are at present, we believe the legacy nodes market will not be subject to much, if there are any restrictions by the US. The table below of KLA’s revenue breakdown by geography shows that its revenue from China (and all other countries) has remained almost unchanged over the past 3 years, despite growing at >20% each year. This indicates not only has KLA been unaffected by China restrictions, but also the stability of the legacy nodes market.
KLA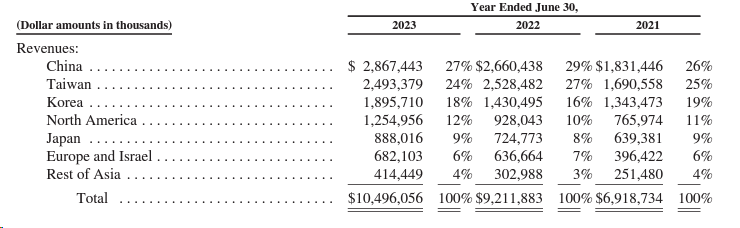
Stable Market Leadership
KLA is known as the market leader in the semicon process control equipment market with over 50% market share leadership. In the context of the entire Semicon equipment Sub-industry, KLA’s share is much smaller. However, as seen below, it has gained the most share over the period (except ASML).
Company Data, SEMI, Khaveen Investments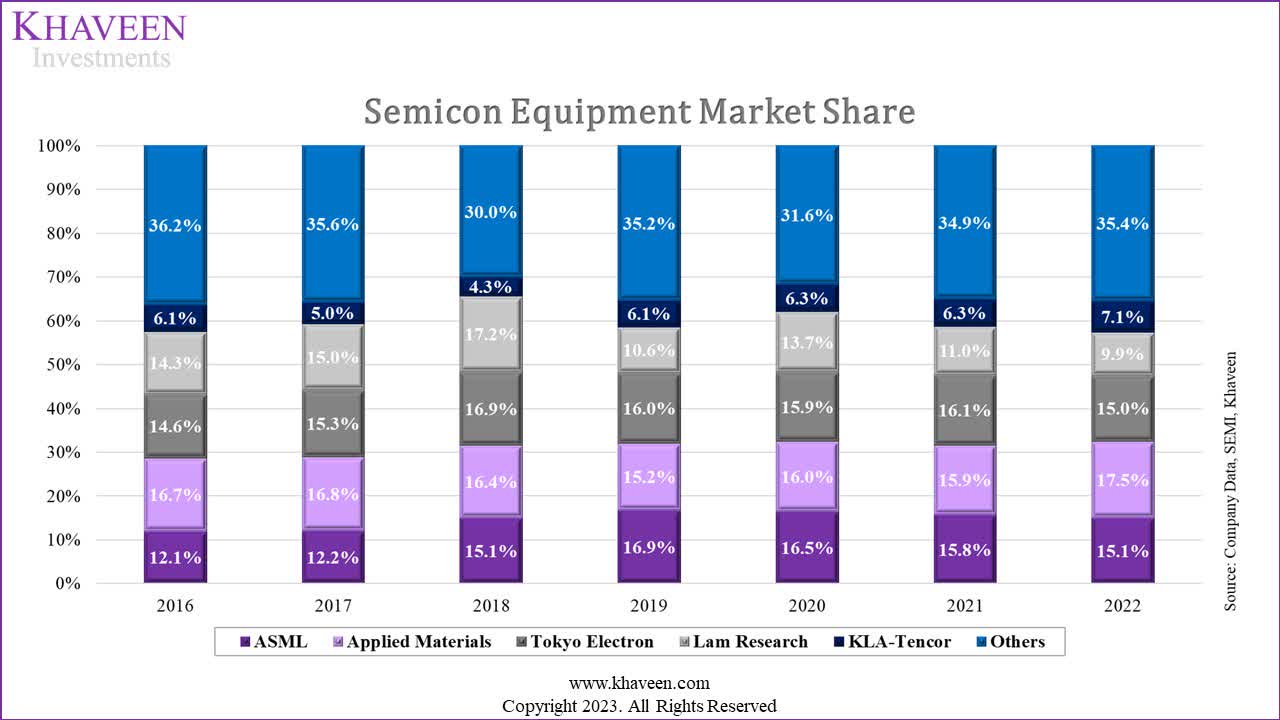
|
Semicon Equipment Market Projections ($ bln) |
2018 |
2019 |
2020 |
2021 |
2022 |
2023F |
2024F |
2025F |
2026F |
2027F |
|
Semicon Industry Market |
468.78 |
412.31 |
440.39 |
555.89 |
574.08 |
514.9 |
575.7 |
618.4 |
664.3 |
713.6 |
|
Semicon Market Growth |
13.7% |
-12.0% |
6.8% |
26.2% |
3.3% |
-10.3% |
11.80% |
7.42% |
7.42% |
7.42% |
|
Semicon Capex as % of Revenue |
22.6% |
24.9% |
25.7% |
27.5% |
31.7% |
28.5% |
27.6% |
27.6% |
27.6% |
27.6% |
|
Semiconductor Industry Capex ($ bln) |
106.1 |
102.5 |
113.1 |
153.1 |
181.7 |
146.6 |
159.1 |
170.9 |
183.6 |
197.2 |
|
Semiconductor Industry Capex Growth % (‘a’) |
11.0% |
-3.4% |
10.3% |
35.4% |
18.7% |
-19.3% |
8.5% |
7.4% |
7.4% |
7.4% |
|
Semicon Equipment Market Size |
64.4 |
59.5 |
71.2 |
102.6 |
107.6 |
87.6 |
98.7 |
109.5 |
121.5 |
134.9 |
|
Semicon Equipment Growth % (‘c’) |
13.8% |
-7.6% |
19.7% |
44.1% |
4.9% |
-18.6% |
12.7% |
11.0% |
11.0% |
11.0% |
|
Semicon Capex/Equipment Growth Factor (‘b’) |
1.25 |
2.24 |
1.90 |
1.25 |
0.26 |
0.96 |
1.48 |
1.48 |
1.48 |
1.48 |
*c = a x b
Source: WSTS, SIA, SEMI, IC Insights, Khaveen Investments
KLA’s 2023 wafer fab equipment outlook reflects a 16% decline from 2022. This is in line with forecasts by SEMI.
Global sales of total semiconductor manufacturing equipment by original equipment manufacturers next year are forecast to bounce back from a projected contraction of 18.6% to $87.4 billion in 2023 following the industry record of $107.4 billion in 2022. – SEMI
Despite current headwinds, the semiconductor equipment market is set to see a strong rebound in 2024 after an adjustment in 2023 following a historic multi-year run, – Ajit Manocha, SEMI president and CEO
KLA mentioned that the demand profile for 2024 was uncertain, emphasizing that it was challenging to predict the future accurately. However, the company’s previous investor day presentation reiterated 2021-2026 CAGR targets of 9-11%.
KLA
We forecasted the semiconductor equipment market based on the semicon industry capex/semiconductor equipment market growth factor from 2024 onwards. We derived our forecasts for the semicon capex based on a 5-year average semicon capex % of the market and semicon industry growth forecast of 11.8% by WSTS and the market forecast CAGR of 7.42% beyond that. Based on a 10-year average growth factor, we derived a growth forecast of 12.7% in 2024 and a forward average of 11.4%. This is also in line with industry experts who expect the semicon equipment market to rebound in 2024.
Moreover, we updated our forecast for KLA in 2023 by segments based on prorated actual Q1 results, Q2 guidance, and our long-term growth forecasts based on market CAGR. We forecasted the company’s semicon equipment revenue growth to be higher than the overall equipment market growth due to higher growth of the semicon process control equipment at a forward average of 12.7%.
|
Revenue by Major Product Categories ($ mln) |
2023F |
2024F |
2025F |
2026F |
2027F |
|
Wafer Inspection |
4,190 |
4,550 |
4,941 |
5,366 |
5,828 |
|
Growth % |
-3.4% |
8.6% |
8.6% |
8.6% |
8.6% |
|
Patterning |
2,665 |
3,153 |
3,730 |
4,412 |
5,220 |
|
Growth % |
-4.5% |
18.3% |
18.3% |
18.3% |
18.3% |
|
Wafer Inspection and Patterning Total |
6,855 |
7,703 |
8,671 |
9,778 |
11,047 |
|
Growth % |
-3.8% |
12.4% |
12.6% |
12.8% |
13.0% |
|
Specialty Semiconductor Process |
483 |
524 |
568 |
616 |
667 |
|
Growth % |
-1.8% |
8.40% |
8.4% |
8.4% |
8.4% |
|
PCB, Display, and Component Inspection |
286 |
217 |
165 |
125 |
94 |
|
Growth % |
-24.2% |
-24.2% |
-24.2% |
-24.2% |
-24.2% |
|
Services |
2,191 |
2,268 |
2,348 |
2,431 |
2,516 |
|
Growth % |
3.5% |
3.5% |
3.5% |
3.5% |
3.5% |
|
Other |
355 |
355 |
355 |
355 |
355 |
|
Growth % |
-6.9% |
0.0% |
0.0% |
0.0% |
0.0% |
|
Total |
10,170 |
11,067 |
12,106 |
13,304 |
14,680 |
|
Growth % |
-3.1% |
8.8% |
9.4% |
9.9% |
10.3% |
Source: Company Data, Khaveen Investments
Khaveen Investments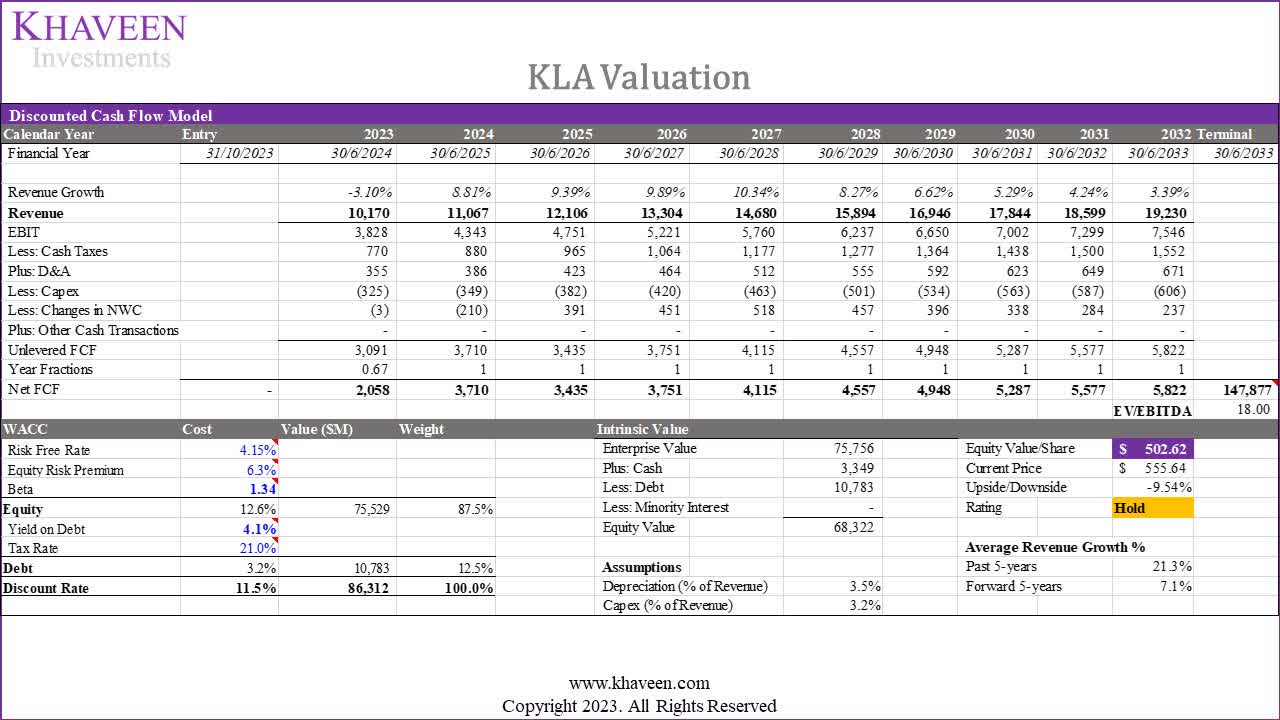
Based on a discount rate of 11.5% (company’s WACC) and terminal value based on the 5-year average top equipment makers’ EV/EBITDA of 18x, our model shows a downside of 9.54%.
Risk: Market Weakness Headwinds
We believe one of the risks to the company is the semicon equipment market weakness headwinds which could pose a threat to the timing of the anticipated market recovery as indicated by management in its latest earnings briefing. While we expect the market to recover in 2023, customers delaying equipment orders and deliveries such as TSMC could lead to higher uncertainty.
While the timing of a meaningful resumption in WFE investment growth remains unclear as most underlying end markets remain soft, we continue to see KLA’s overall demand stabilizing around current business levels. – Bren Higgins, CFO.
Verdict
In summary, we affirm the company’s solid profitability, projecting a forecasted FCF margin of 25.52% for 2023, with a 5-year forward average FCF margin of 28.7%. This outpaces the past 10-year average of 24.24%, excluding acquisition costs. Notably, the stability of the FCF margin based on capex alone contrasts with fluctuations in total investing cash flows due to acquisitions in 2018 and 2021. We believe management’s commitment to strategic objectives and strong FCF generation further supports our positive outlook.
Additionally, we anticipate a stable market share for KLA in legacy nodes, supported by its favorable revenue exposure to China which has been consistent over the past three years. Despite existing risks, we believe the legacy nodes market could likely remain unaffected by potential restrictions. Our semiconductor equipment market forecast aligns with industry expectations, projecting a rebound in 2024. In our updated 2023 forecast for KLA, we anticipate higher semicon equipment revenue growth compared to the overall market, driven by the robust growth of semicon process control equipment at a forward average of 12.7%. Notwithstanding, we rate the company as a Hold with limited upside based on our updated DCF valuation following the strong surge of its stock by 48% YTD.
Analyst’s Disclosure: I/we have a beneficial long position in the shares of KLAC either through stock ownership, options, or other derivatives. I wrote this article myself, and it expresses my own opinions. I am not receiving compensation for it (other than from Seeking Alpha). I have no business relationship with any company whose stock is mentioned in this article.
No information in this publication is intended as investment, tax, accounting, or legal advice, or as an offer/solicitation to sell or buy. Material provided in this publication is for educational purposes only and was prepared from sources and data believed to be reliable, but we do not guarantee its accuracy or completeness.
Seeking Alpha’s Disclosure: Past performance is no guarantee of future results. No recommendation or advice is being given as to whether any investment is suitable for a particular investor. Any views or opinions expressed above may not reflect those of Seeking Alpha as a whole. Seeking Alpha is not a licensed securities dealer, broker or US investment adviser or investment bank. Our analysts are third party authors that include both professional investors and individual investors who may not be licensed or certified by any institute or regulatory body.