Summary:
- LOW reported some headwinds in its Q2 earnings surrounding its DIY demands and weather conditions.
- I see these headwinds as temporary only.
- I expect EPS growth to resume soon thanks to its robust ROCE and sustainable CAPEX investment.
- I also see signs of improvement in macroeconomic conditions and potential policy catalysts from Kamala Harris’ proposed support for first-time homebuyers.

DNY59
Lowe’s stock: previous thesis and Q2 recap
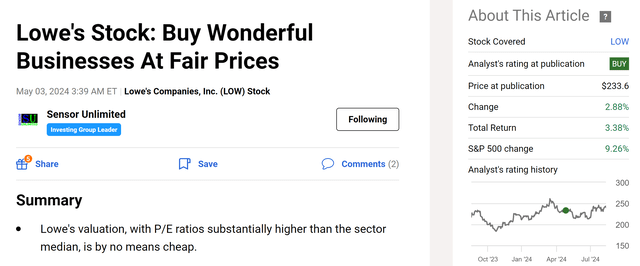
I last wrote on Lowe’s (NYSE:LOW) stock about four months ago. As you can see from the screenshot below, that article, “Lowe’s Stock: Buy Wonderful Businesses At Fair Prices,” was published by Seeking Alpha on May 3, 2024. In that article, I argued for a buy thesis based on the following considerations:
Lowe’s valuation, with P/E ratios substantially higher than the sector median, is by no means cheap. However, I do not see an obvious overvaluation either in terms of P/E or dividend yield in comparison to its historical track record. And during uncertain times like ours, it is especially important to invest in wonderful businesses at fair prices rather than fair businesses at wonderful prices.

Seeking Alpha
That article’s angle is thus more oriented toward the uncertainties of the macroeconomics, and I placed an emphasis on explaining why LOW could serve as an effective hedge against such uncertainties. Since that writing, LOW has released its 2024 Q2 earnings report (ER) with several key updated financial and business operations. Therefore, I think it would be helpful to write this follow-up analysis. In this analysis, I will be reviewing its Q2 results and be more focused on the issues specific to LOW rather than the macroeconomics. In the end, you will see this updated analysis concludes with an iteration of my earlier buy rating. I see the headwinds reported in Q2 to be only temporary, and I am still seeing a business with robust profitability trading at a fair or mildly discounted valuation.
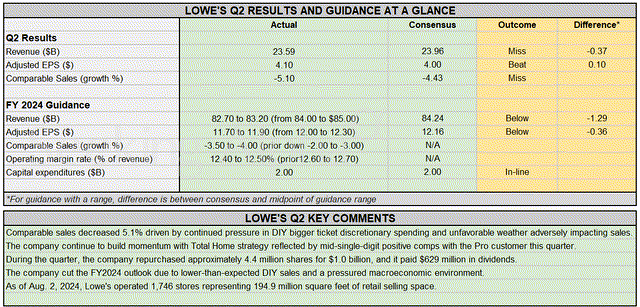
Overall, LOW delivered a quarter with uneven results, as you can see from the chart below. Revenue declined YOY, as widely expected. The figure came in at $23.59B, translating into a 5.5% decline YOY. However, the decline was slightly worse than the consensus estimates and the figure missed the consensus estimate by $0.37 billion. However, adjusted EPS dialed in at $4.10 and beat estimates by $0.10 largely thanks to pricing strategies in my view. Comparable sales also decreased 5.1% due to “continued pressure in DIY bigger-ticket discretionary spending and unfavorable weather adversely impacting sales”.
For the full fiscal year of 2024, the company lowered its guidance range due to the above headwinds. To wit, Lowe’s now expects 2024 full-year revenue to be between $82.70 and $83.20 billion, down from its previous forecast of $84-$85 billion. Adjusted EPS is projected to be between $11.70 and $11.90, down from the previous range of $12.00 to $12.30. Comparable sales are expected to decline between 3.50% and 4.00%.
In the remainder of this article, I will explain why I see these headwinds to be only temporary and expect the company to resume growth soon.

Seeking Alpha
LOW stock: growth outlook and valuation
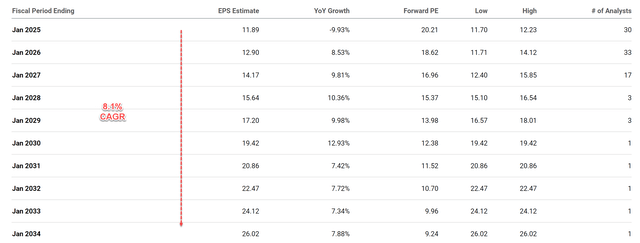
Looking past FY 2024, consensus expects the EPS to resume growth at a healthy pace starting in FY 2026. More specifically, the chart below shows the consensus EPS estimates for LOW stock in the next 10 years. According to the consensus EPS estimates, Lowe’s is expected to enjoy robust EPS growth throughout the next decade. Overall, the company’s EPS is projected to grow at a compound annual growth rate (CAGR) of 8.11% in this period. I think such a forecast is very plausible given the many EPS growth drivers the company describes in its Q2 ER. These drivers included continued share repurchases (it bought back about 4.4 million shares in Q2 alone), robust profitability, sustainable CAPEX (about $2B is budged for full-year 2024), and the improving macroeconomic conditions, as to be elaborated on later.

Seeking Alpha
The above growth recovery potential, combined with its valuation, creates a quite favorable return/risk profile in my mind. As a textbook dividend champion, I will just illustrate the skewness of the return/risk profile by a discounted dividend model (“DDM”) here. In particular, I will use a two-stage DDM model as detailed in my earlier article:
There are a total of 3 key parameters in the 2-stage DDM: the discount rate, the growth rate in stage 1, and the terminal growth rate. For the discount rate, I relied on the so-called WACC, the weighted average cost of the capital model. The discount rate for LOW is about 8.2% on average in recent years following this model.
For the growth rate in stage 1, I will just rely on the above consensus forecast and plug in 8.1%. For the growth rate in stage 2 (i.e., the terminal growth rate), my method involves the use of ROCE and reinvestment rates. The details are provided in my other articles and I will just quote the end results here:
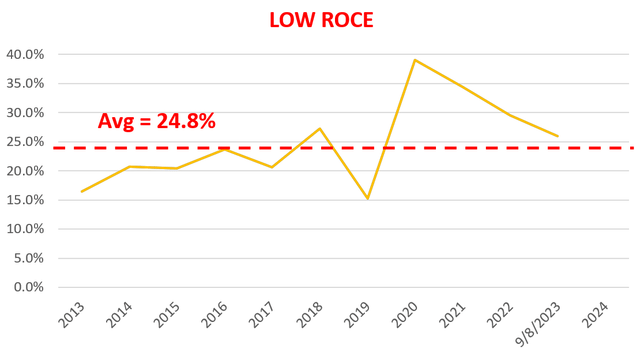
The ROCE for LOW has been around 24.8% on average in the long term as seen in the chart below. Its RR is about 15% on average in recent years. With these inputs, LOW’s perpetual growth rate would be ~3.72% (24.8% ROCE x 15% RR = 3.72%). Note this number is the real growth rate without inflation. To obtain a notional growth rate, one would need to add an inflation escalator. Assuming an average inflation of 2.5% would bring the terminal growth rate to 6.22%.
With all the growth rates and discount rates, the table below shows the results from the 2-stage DDM model. Note, that given LOW’s reliable dividends, I used its FWD dividend payouts of $4.60 per share in the model. Under these parameters, the fair value of LOW turns out to be ~$292. Its market price is about $240 as of this writing, translating into a margin of safety of around 18%.

Author

Author
Other risks and final thoughts
In terms of downside risks, the pressure facing its DIY segment is likely to persist given the elevated housing prices and borrowing rates. Moreover, the weather conditions are ultimately unpredictable and could create more adverse conditions. Finally, note that other valuation metrics may show different results compared to my above 2-stage DDM model. For example, in terms of P/E, the chart below shows that LOW’s current multiple is close to its 5-year historical average, with a difference ranging from about -5% to 14%. However, for dividend champs, I tend to favor the use of dividends for valuation purposes as they reflect the company’s true earnings better in my experience.

Author
As a final upside driver, I think the macroeconomic conditions are also improving. As seen in the next chart, mortgage rates have begun to decline lately and could make home purchasing and improvement more affordable. The current 30-year rate sits at 6.49%. It is admittedly still among the highest levels in at least 10 years. However, it is noticeably lower than its recent peak of around 8%. Also, the ongoing presidential election may provide another near-term catalyst. Vice President Kamala Harris recently announced up to $25,000 in down payment support for first-time homebuyers as part of her economic policy. Quote:
The campaign is vowing that during its first term, the Harris-Walz administration would provide working families who have paid their rent on time for two years and are buying their first home up to $25,000 in down-payment assistance, with more generous support for first-generation homeowners.
All told, my overall conclusion is that the upside potential outweighs the downside risks under current conditions surrounding LOW. To recap, LOW indeed is facing some headwinds due to softened DIY demands and weather conditions. However, I see these headwinds as temporary only. I expect EPS growth to resume soon, thanks to continued share repurchases, robust ROCE, sustainable CAPEX investment, and improvement in macroeconomic conditions. These EPS drivers, when combined with its current reasonable/discounted valuation, create a positively skewed return/risk profile.

Seeking Alpha
Analyst’s Disclosure: I/we have a beneficial long position in the shares of LOW either through stock ownership, options, or other derivatives. I wrote this article myself, and it expresses my own opinions. I am not receiving compensation for it (other than from Seeking Alpha). I have no business relationship with any company whose stock is mentioned in this article.
Seeking Alpha’s Disclosure: Past performance is no guarantee of future results. No recommendation or advice is being given as to whether any investment is suitable for a particular investor. Any views or opinions expressed above may not reflect those of Seeking Alpha as a whole. Seeking Alpha is not a licensed securities dealer, broker or US investment adviser or investment bank. Our analysts are third party authors that include both professional investors and individual investors who may not be licensed or certified by any institute or regulatory body.
Join Envision Early Retirement to navigate such a turbulent market.
- Receive our best ideas, actionable and unambiguous, across multiple assets.
- Access our real-money portfolios, trade alerts, and transparent performance reporting.
- Use our proprietary allocation strategies to isolate and control risks.
We have helped our members beat the S&P 500 with LOWER drawdowns despite the extreme volatilities in both the equity AND bond market.
Join for a 100% Risk-Free trial and see if our proven method can help you too. You do not need to pay for the costly lessons from the market itself.

