Summary:
- This article compares the performance of a $10,000 investment in CVX compared to an ‘alternative’ investment in similar smaller cap companies in search of higher returns.
- The smaller peer group comprises of Diamondback Energy, Occidental Petroleum, Valero Energy, and HF Sinclair Corporation.
- Performance of CVX is compared to its smaller peers in both shareholder returns, valuation, and price appreciation.
- The pros and cons of this alternate strategy are weighed to determine the best course of action.

adventtr
Thesis
Super major oil companies like Exxon Mobil (XOM) or Chevron (NYSE:CVX) are household names. There isn’t a person you could ask who hasn’t at least heard of these companies. These companies are worth more than the GDP of a small country, and as a result, attract attention from investors and hedge funds from around the world. With all of this exposure, is it possible to find value and/or market beating performance?
In this article, I will compare the performance of a $10,000 investment in Chevron to the same investment spread amongst smaller sized companies that operate in the same upstream and downstream markets of the oil and gas industry in search of higher returns. This is my second installment of my experiment. In Version 1.0, I definitively concluded there were better investment options than Exxon Mobil. Now I will flip the script a bit and analyze CVX against an entirely different set of companies to test how robust my thesis actually is.
To draw a definitive answer, the following questions must be answered.
- Would the results be improved if investing in several companies that compete in the same segments but at a smaller scale?
- Is the difference in returns substantial enough to warrant the time spent actively researching and following several companies?
- Specifically, an alternative investment must prove to generate better yield, better value, and better flexibility to be worthy of our investment dollars.
Ground Rules
I’ll define certain criteria I used to framework this comparison.
1. The smaller component companies are still large companies. A market cap of $10 billion is the minimum to be considered.
2. The second investment will be spread as evenly as possible to match Chevron’s production mix. For example, if 60% of Chevron’s earnings (EBITDA) was from refining, $6,000 would be invested in a refiner. The remaining $4,000 invested in an oil and gas producer.
3. All results will be based on Q2’s returns and annualized for a full year. Returns during 2022 will not be considered since energy prices were largely an outlier from the past 10 year average due to the Russian/Ukraine conflict. This has been done to not over inflate the projected numbers. I view Q2 commodity prices as a good barometer for below mid-cycle pricing.
The Competition
To facilitate this experiment, I have chosen to compare CVX against a blend of companies in the refining and E&P spaces. These companies will be totally separate than those selected to compete against Exxon Mobil in the previous experiment.
In the refiner space, I have selected Valero (VLO) and HF Sinclair (DINO). To shake up the producer section, I have selected Diamondback Energy (FANG) and Occidental Petroleum (OXY).
E&P Competition
CVX is a global producer, with major oil and gas projects all over the world. Conversely, the competitors, FANG and OXY, mainly produce out of the Permian Basin of the US. Therefore, there will clearly be operational differences between the companies and this is not necessarily an apples to apples comparison.
Typical Permian production is in the range of 50% oil, 25% NGLs, and 25% natural gas. CVX’s production profile is geared more to the natural gas segment, producing nearly 41% of its production volumes from natural gas. As one would expect, the shear size of volumes produced are also significantly different. In Q2, CVX’s total daily output produced 2,959 MBOE. This dwarfs the output of 450 MBOE and 1,218 MBOE for FANG and OXY respectively.
Aside from these operational differences, the shareholder return packages are structured very differently. CVX employs more of a standard format with a moderate dividend and buyback program. FANG and OXY have altered their programs to match the ebbs and flows of the commodity cycle.
FANG utilizes a base plus variable dividend strategy that is based off 75% FCF (inclusive of base dividend and buybacks). OXY aims to return as much as possible to shareholder through share buybacks and redemption of preferred shares with only a small dividend. So right off the bat, investors should be aware of that important difference between the companies.
Refinery Competition
Chevron’s refinery segment is on the smaller size for a company with a market cap of almost $300 billion. CVX brings home a total capacity of 1.8 million barrels per day. This is on par with the capacity of Valero, which produces 1.42 million barrels per day. The smallest producer of the bunch is HF Sinclair (Market Cap of only $10 billion) which has 716,000 barrels per day of refining capacity.
The competitors in the refinery space have a similar dividend program to CVX but have been pouring an unparalleled amount of cash into buybacks. Record crack spreads have allowed these companies to capitalize on the rapid influx of cash without creating a future liability by ramping up the dividend excessively.
Performance Indicators
Before we get started, let us discuss the indicators we will be using to grade performance.
1. Total Shareholder Returns – This includes dividends and buybacks to demonstrate which investment has superior returns to investors.
2. Valuation – This will evaluate free cash flow generation per share, cash, and debt levels to demonstrate which investment has a superior value.
3. Historical Price Performance – Understanding where we’ve been can help us get an idea of where we are headed.
Through these points, I will look to draw conclusions if there is a superior alternative investment vehicle to CVX.
Total Shareholder Returns
To evaluate our return options, I first had to calculate the percentage of earnings related to each given segment. For CVX, roughly 82% of Q2 earnings came from the upstream segment, leaving 18% spread across the different downstream segments, which can largely be lumped under a refining title.
Below is an annualized summary of dividend payouts and share buybacks from the peer group. It is easy to see that CVX is near the bottom of the group, only beating out OXY by a 1% improvement in total returns.
Annualized Q2 Total Share Holder Returns
| Dividend | Buybacks | Combined Yield | |
| Chevron | $6.04 | $2.33 | 5.25% |
| Diamondback Energy | $3.36 | $10.48 | 9.32% |
| Occidental Petroleum | $0.72 | $2.00 | 4.28% |
| Valero | $4.08 | $10.88 | 11.79% |
| HF Sinclair | $1.8 | $8.56 | 15.56% |
I used the following table to calculate the number of shares that would alternatively be purchased. Note that two different companies were selected for both the upstream and downstream segments to give some diversity to the results.
Investment Distribution
| Producer | Refiner | Price | |
| Investment | $8,213.00 | $1,787.00 | |
| FANG | 55.28 Shares | N/A | $148.57 |
| OXY | 129.30 Shares | N/A | $63.52 |
| VLO | N/A | 14.08 Shares | $126.89 |
| DINO | N/A | 32.53 Shares | $54.94 |
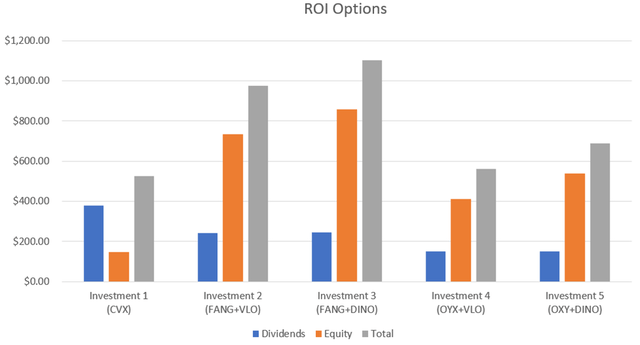
Taking the number of shares in the above table against an equivalent $62.77 shares of CVX (at $159.31/share) generated the following investment options. Using this method, you can see that all of the four alternative methods will yield superior returns than owning solely CVX. Admittedly, Investment 4 is essentially the same result as CVX being only narrowly better than CVX.
An important factor to note is that the return method is shifted more toward equity than dividend payments with these alternative investment options.

10-K reports (CVX, FANG, OXY, VLO, DINO)
Valuation
From a valuation standpoint, it is pretty reasonable to expect that investors will be paying a premium to own a slice of the Chevron brand. But exactly how much of a premium are we paying and how much is that brand value worth?
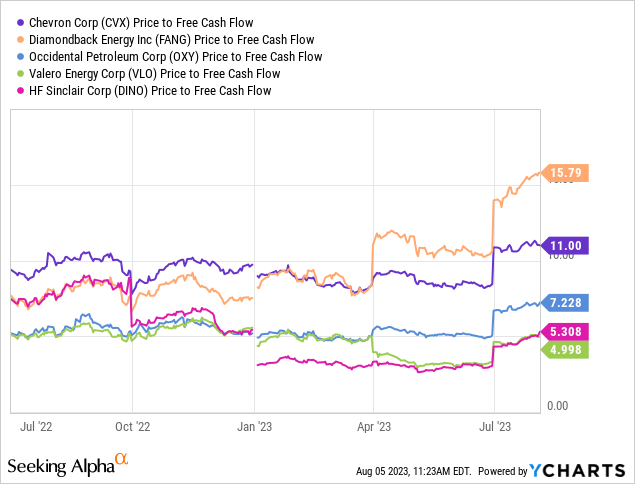
The first item we will look at is Price to FCF, or investment dollars spent for cash produced. Using the chart below CVX looks to be valued at a fair price for a pure producer. The refiners, however, are generating significantly more cash per share. Both VLO and DINO cost less than half that of CVX for every dollar of free cash flow produced suggesting that the refiner stocks are a better overall value.

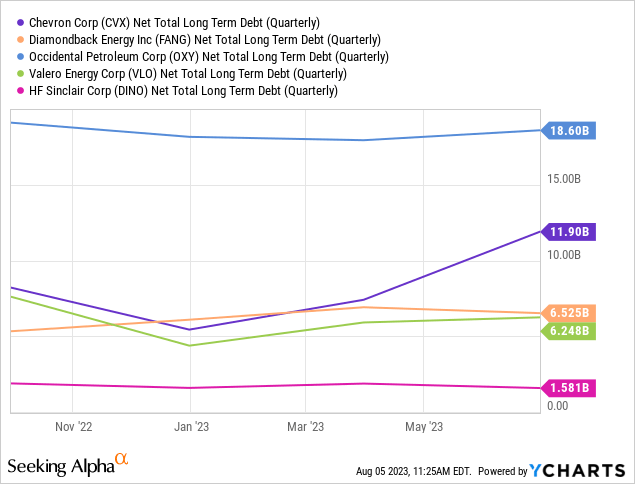
The second item to evaluate will be the cash and debt profiles for CVX. I have taken the net debt position of all five companies and represented that on a per share basis and a percentage of share price.
CVX is a clear front runner in this area. CVX has a miniscule net debt position for a company of its size, setting it up to have a healthy balance sheet for the foreseeable future. This will ensure profits are either directed toward productive endeavors like capital projects or into shareholder’s pockets.

| CVX | FANG | OXY | VLO | DINO | |
| Net Debt per Share | -$6.40 | -$30.00 | -$21.03 | -$17.69 | -$8.58 |
| % of Share Price | -4.00% | -20.18% | -33.10% | -13.94% | -15.62% |
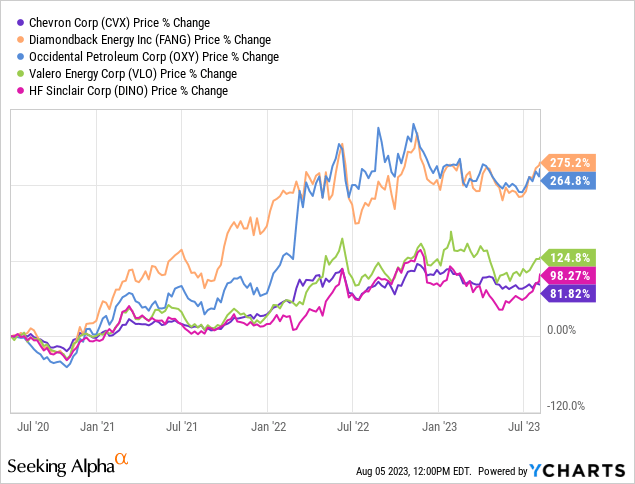
For our last valuation metric, we will look at historical price performance of a $10,000 investment. In this area, CVX is the bottom feeder for share price appreciation over the last 3 years. This unfortunately, makes CVX neither a growth stock nor a compelling income-oriented stock when compared to the peer set presented with a yield of less than 4%.

Risk
The comparison performed here has focused purely on stock performance and does not take into account any operational characteristics such as quality of assets, growth aspects, or management performance. As a result, it does not give credit to CVX for its incredibly diverse set of projects that span the globe.
The resources at Chevron’s disposal are unparalleled. The shear amount of cash flow and cash reserves give the company the capability to find and develop the world’s next major reservoir. Simply put, CVX has the capability to be an industry trail blazer.
Conversely, the smaller peer set does not have this ability. In the big picture, they are optimizers, seeking to be as efficient as possible in the Permian, while CVX is out scouring the globe for big pay days.
There are both pros and cons to this approach. Even though big pay days excite investors and can drive record profits, this is also the status quo for a super major. It is a tall bar to constantly live up too.
Summary
In this article we compared the stock performance of Chevron against a variety of both independent oil and gas producers as well as leading US based refiners. To draw conclusions from our comparison, we tried to answer three questions.
- Would the results be improved if investing in several companies that compete in the same segments but at a smaller scale?
Conclusion: The analysis showed that any combination of the four companies discussed in this space would generate higher total returns but a lower dividend yield.
- Is the difference in returns substantial enough to warrant the time spent actively researching and following several companies?
Conclusion: The analysis showed that it was possible to obtain shareholder returns in the range of 2 to 2.5x times that of CVX. CVX also experienced the worst price performance of the group over the last three years. Therefore, the alternative investment should adequately compensate investors for their additional time.
- Specifically, an alternative investment must prove to generate better yield, better value, and better flexibility to be worthy of our investment dollars.
Conclusion: CVX trades at a premium valuation compared to three of the four competitors and was shown to generate the lowest amount of shareholder returns of the analyzed group. Further, having an investment in my ‘alternative’ approach allows investors to choose the return profile that best meets their needs (buybacks vs dividends), or adjust as one ages.
The downside to this approach will preclude investors from benefiting from CVX’s excellent balance sheet as well as the diversity of its world class assets. From a long-term vantage point, CVX’s vast resources almost guarantee it will be at the forefront of the industry for the foreseeable future. These two factors can provide an ample amount of security that an investor may wish to consider.
When selecting an option, both age and financial goals come into play. After weighing both options, my personal preference would be to select any of the alternative investment options. My personal preference would be to select Investment Option 2 or 3 thanks to FANG’s variable dividend policy which could dramatically boost returns should oil continue its upward trend.
Does this require additional work us as investors? Absolutely. However, in principal, we can be rewarded with both higher dividends and buybacks. CVX still has merit as potentially a more secure and less volatile investment while still producing moderate income, should that be a goal for the current season of your life.
If this thought process has caught your interest, I have written individual analyses on all four of the “alternative” companies discussed in this space for further research.
Happy Investing.
Analyst’s Disclosure: I/we have no stock, option or similar derivative position in any of the companies mentioned, and no plans to initiate any such positions within the next 72 hours. I wrote this article myself, and it expresses my own opinions. I am not receiving compensation for it (other than from Seeking Alpha). I have no business relationship with any company whose stock is mentioned in this article.
Seeking Alpha’s Disclosure: Past performance is no guarantee of future results. No recommendation or advice is being given as to whether any investment is suitable for a particular investor. Any views or opinions expressed above may not reflect those of Seeking Alpha as a whole. Seeking Alpha is not a licensed securities dealer, broker or US investment adviser or investment bank. Our analysts are third party authors that include both professional investors and individual investors who may not be licensed or certified by any institute or regulatory body.
