Summary:
- Mastercard’s revenue growth has been steady, with a 10-year CAGR of 11.7% and increasing operating margins.
- The company has a strong balance sheet and low debt ratio, with a low cost of capital.
- The market is currently pricing in high-growth assumptions for Mastercard, but historical total returns have been lower than the broader market.
- The current market price is at the very top end of my estimate of Mastercard’s intrinsic value.

jir
Author’s Preamble
I have an actively managed investment portfolio and I regularly trade stocks within my investing universe (or watch list) depending upon the stock’s price relative to my intrinsic valuation and its market trading patterns.
I share my valuations with readers as a way to get feedback and to gain new insights from other knowledgeable investors.
I have written previously about Mastercard (Time to Take Profits) and this is my annual update.
Business Overview
Mastercard (NYSE:MA) presents net revenues from 2 sources (the proportion of total FY2023 revenues is shown in brackets) but does not provide any margin information:

Author’s compilation using data from Mastercard’s 10-K filing.
Mastercard has grown its payment network infrastructure organically, and the Value-Added Services segment has predominantly grown through acquisitions.
Over the last 10 years, Mastercard has spent more on acquisitions than capex ($6,420 M versus $9,642 M). Most of these acquisitions have been relatively modest in size, but nevertheless strategically important in adding capability for the growing Value-Added Services & Solutions business.
Mastercard’s focus has always been to replace cash and checks in the consumer payments sector. It has gained share by signing up more financial institutions to issue cards and more merchants who are prepared to accept the card.
Mastercard and its main competitor, Visa (V) have entrenched positions in the global card payments sector.
Payments’ Network Market Size
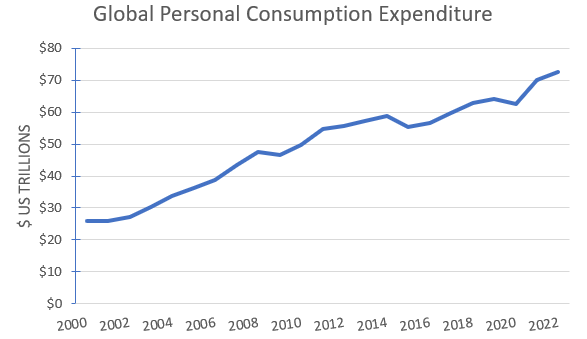
Mastercard’s primary target market is the personal consumption expenditure (PCE) market. The World Bank estimated that at the end of FY2022, the global level of personal consumption was $US 72Trillion. The size of the market since FY2000 is shown on the following chart:
Author’s compilation using data from the World Bank
Over the last 20 years, the market has grown at a compound annual rate of 4.8%. The payment transactions in the market include cash, checks, and cards (both debit and credit).
The market size is dominated by the larger developed economies, with the 15 largest economies contributing 76% of the total expenditure.
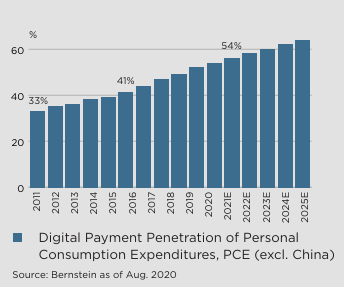
According to a paper published by Worldwide Asset Management in FY2022, digital payments comprise close to 55% of the total PCE market:
Worldwide Asset Management, The Payments Industry after COVID-19.
The authors believe that digital payments in the PCE market will grow at between 10% to 11% per year for the next 5 years.
The card payment network is heavily consolidated, with Visa and Mastercard dominating most markets except China. The Chinese stated owned Union Pay network dominates the Chinese market and is probably the largest player by transaction value in the world (very little public information is available regarding Union Pay’s operations but in FY2018 Union Pay claimed that its gross dollar value of transactions was $US 14.95 Trillion).
The following table shows the reported Gross Dollar Value (GDV) of transactions of the major privately owned card payment networks:

Visa FY2023 10-K filing.
The table highlights the dominance of Visa and Mastercard in the card processing network. I estimate that these 2 companies process approximately 25% of the world’s PCE transaction value.
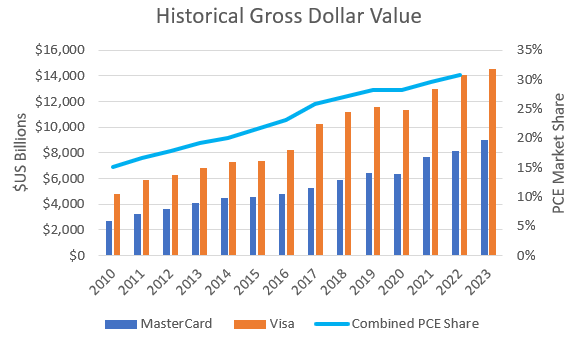
The following chart shows the historical reported GDV for Mastercard and Visa since FY2010 and my estimate of their combined share of the global PCE market:
Author’s compilation using data from Mastercard’s and Visa’s 10-K filings and World Bank data.
The chart highlights the long-run growth that both Mastercard and Visa have achieved (similar compound growth rates of 9% to 10%) and their massive, combined increase in market share (from 15% to 31% since FY2010). Mastercard and Visa have grown their GDV at almost double the underlying market for the last 10 years.
It should be noted that the size of the payments market (particularly the PCE segment) is heavily influenced by the health of the global economy.
This was clearly demonstrated in FY2020 when the COVID-19 pandemic community lockdowns caused the global payments sector to have declining GDV for the first time since the FY2008 / FY2009 global financial crisis.
Mastercard’s Historical Financial Performance
Revenues and Operating Margins
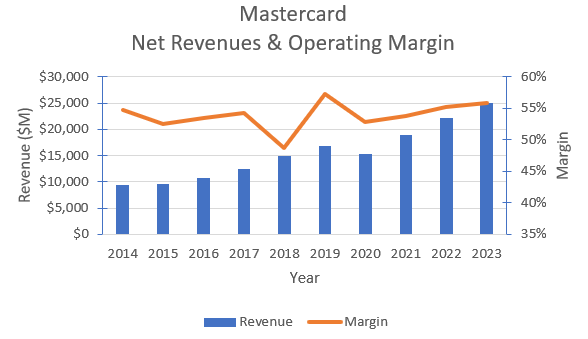
The following chart shows Mastercard’s historical revenues and operating margins:
Author’s compilation using Mastercard’s 10-K filings.
Mastercard’s revenues have grown steadily since the global financial crisis (GFC) and the 10-year CAGR is 11.7%.
The long-term operating margin has been slowly rising for many years. Years in which the margin dipped were generally associated with large provisions for legal expenses. I have not adjusted the operating expenses for these events because I have formed the view that regulatory litigation has become a normal cost of business for MasterCard.
Since FY2020, Mastercard has begun showing net revenues as either coming from its payments network or from value added services. At this stage, it would appear that the value-added services component is growing slightly faster than network revenues. Unfortunately, the company does not provide any information about the relative margins of these activities.
Cash Flows
The following table summarizes Mastercard’s cash flows for the last 10 years:

Author’s compilation using data from Mastercard’s 10-K filings.
Mastercard has only needed to reinvest 10% of its revenues back into the business (60% of the reinvestment were acquisitions). This implies that the base business has an extraordinarily low capital requirement and is comparable to companies such as Apple (AAPL), Visa (V) and Booking Holdings (BKNG).
Over the last 10 years, Mastercard has taken on an additional $15,674 M in debt, which has essentially funded its reinvestment. The company then returned its entire net operating cash flow back to shareholders – spending $53,769 M in buybacks and $12,817 M in dividends.
Mastercard’s dividend has increased every year since FY2011 and based on historical cash flows I see no reason that this won’t continue.
Mastercard is a seriously profitable company.
Provided Mastercard maintains its market position and its margins, then I see no reason why this situation is not sustainable.
Capital Structure
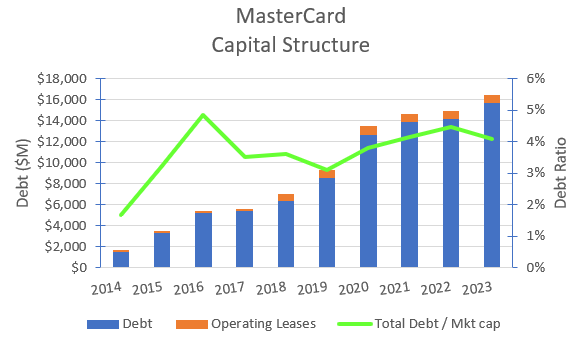
The following chart shows the history of Mastercard’s capital structure over the last 10 years:
Author’s compilation using data from Mastercard’s 10-K filings.
Mastercard’s balance sheet is lightly geared relative to the sector median. This is not surprising given that Mastercard does not take any credit risk in the services that it provides (like Visa) whilst most of its competitors – including American Express (AXP) and Discover (DFS) – have a different business model which accepts a significant amount of transactional credit risk.
Mastercard could take on more debt, release more equity from its balance sheet and generate a lower cost of capital but given the enormous level of cash that it already returns to shareholders I see no reason to do that now. If Mastercard’s competitive circumstances were to change, then this action could be taken.
Return on Invested Capital
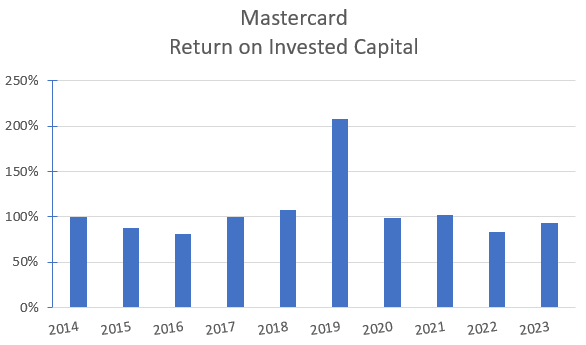
The following chart shows the history of Mastercard’s return on invested capital (‘ROIC’) over the last 10 years:
Author’s compilation using data from Mastercard’s 10-K filings.
Mastercard’s ROIC is outstanding. Note that the unusually high result in FY2019 was caused by an exceptionally high operating profit (the company decided not to make a provision for litigation in that year).
Investors would be hard-pressed to find another company with such high returns on invested capital.
My Investment Thesis for Mastercard
Readers should be aware that there is at least one potential scenario involving the global central banks inviting private citizens to participate in the central bank owned payment network. This scenario works hand in glove with the introduction of digital currencies (so called CBDC’s). This scenario could potentially make the Mastercard payment network worthless.
I currently estimate that this scenario has a low probability but high consequence.
I have chosen not to consider the impact of this scenario on my baseline valuation for Mastercard, but nevertheless, investors should always be cognizant of the possibility that it may happen sometime into the future.
My valuation scenario is essentially “business as usual”.
Growth Story
I accept the consensus estimates that digital payments within the PCE market will grow at 10% per year for the next 5 years. Mastercard has been growing at slightly higher than the market, and I believe that this will continue. My scenario is for revenue growth of 11% per year for the next 5 years before slowly declining to a terminal level of just over 4% within 10 years.
Margin Story
Mastercard’s operating margins have increased year-on-year (notwithstanding the lumpy impact of litigation expenses) and at this stage I don’t see this trend stopping any time soon. I am forecasting that margins will continue to slowly expand over the next 10 years.
Growth Efficiency
Mastercard spends a relatively modest amount of cash sustaining its business. I suspect that over time they will become less efficient (not by a large amount) and need to spend a slightly higher proportion of sales. Historically, only modest acquisitions have been made in the services and solutions business, and I expect that this will continue.
Risk Story
My story for Mastercard is more of the same, and I have ignored (for the time being) the highest risk which faces the business (CBDC’s).
Mastercard’s revenue growth should be sensitive to the condition of the global economy, but because of the tailwinds coming from the replacement of cash by digital transactions, they have been relatively immune from any significant economic slowdown. Over time, the ability to skate through any economic slowdowns will decline.
Mastercard has an extremely strong balance sheet and a low debt ratio. I estimate that Mastercard’s current cost of capital is in the lowest quartile of all US listed companies. I see no significant reasons for the cost of capital to significantly increase over time.
Competitive Advantages
Mastercard’s superior financial metrics leads me to conclude that its operating model (and brand name) has generated a sustainable competitive advantage – noting that Visa has a similar competitive advantage, which likely has the same characteristics.
I don’t believe that Mastercard’s market position will be challenged over the forecast period, which should ensure that its ROIC remains significantly higher than its terminal cost of capital.
Key Inputs into Mastercard’s Valuation
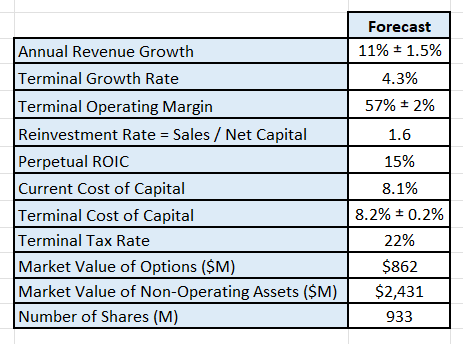
The assumptions can then be summarized into the following inputs for the valuation model:
Author’s valuation model assumptions.
A couple of technical issues to be noted with the valuation inputs:
- I have assumed that Mastercard’s effective tax rate progressively increases over time to the US marginal tax rate (potentially it could go higher).
- I have converted the book value of the equity investments on the balance sheet to an estimated market value by multiplying the book value by the sector’s median price to book ratio of 1.52.
Discounted Cash Flow Valuation
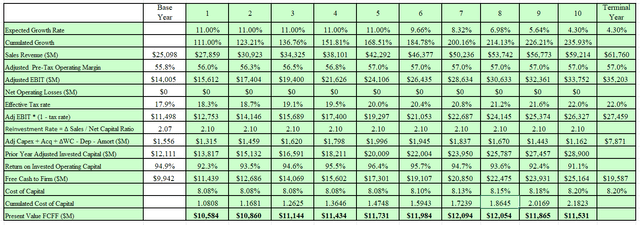
A Free Cash Flow to the Firm approach is used with a 3-stage model (high growth, declining growth, and maturity). The model only seeks to value the cash flows of the operating assets. The valuation has been performed in $USD.
The output from my DCF model for is:
Author’s model.
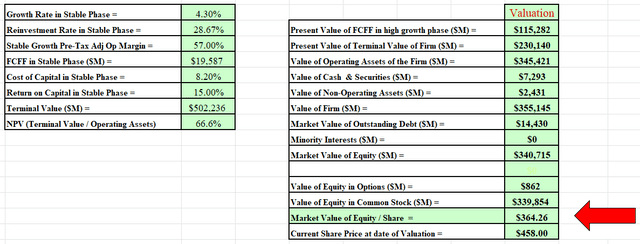
Author’s model.
I have also developed a Monte Carlo simulation for the valuation based on the range of inputs for the valuation. The output of the simulation was developed after 100,000 iterations.
The Monte Carlo simulation can be used to help us to understand the major value drivers in the valuation. It turns out that the key value drivers for Mastercard (based on my scenario) are the revenue growth estimate and the expected terminal cost of capital. These inputs account for 87% of the variation within the valuation and are the greatest source of risk to the valuation.
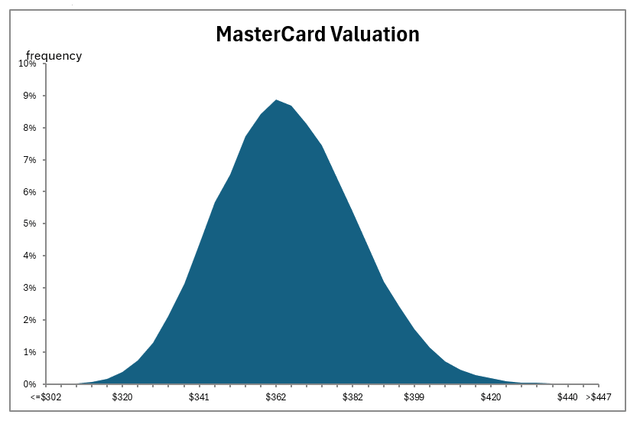
Author’s valuation model output.
The simulation indicates that Mastercard’s intrinsic value is between $302 and $447 per share, with a mid-point of $365.
Based on my scenario, Mastercard is currently priced slightly higher than the top end of my valuation.
Final Recommendation
What assumptions are currently priced into Mastercard?
I have identified that the main drivers of Mastercard’s price are the expected revenue growth rate and the terminal cost of capital. The following table shows the expected intrinsic value for a range of growth and cost of capital assumptions:
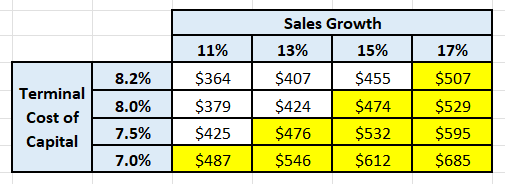
Author’s valuation model.
The table indicates that to justify the current market price, the market is either assuming a significantly higher growth rate or is accepting a lower level of shareholder returns (a simplified way to think about the cost of capital is in terms of the expected total return on investment that shareholders are prepared to accept for the investment’s level of risk).
It is arguable that the growth inputs required to justify the current market price are achievable provided that the investor is prepared to accept a lower return. This opinion is supported by the following table which shows the historical total returns for an investment in Mastercard, Visa, and the S&P 500 index:

Author’s compilation using data from Yahoo Finance.
Interestingly, both Mastercard and Visa have under-performed relative to the broader index for at least the last 5 years.
This would tend to support my conclusion that Mastercard (and potentially Visa) have been over-priced for several years, which has resulted in lower total returns to shareholders relative to the broader market.
Which is a better investment: Mastercard or Visa?
The above table indicates that both companies have achieved similar returns for their investors. Let’s consider their current metrics:
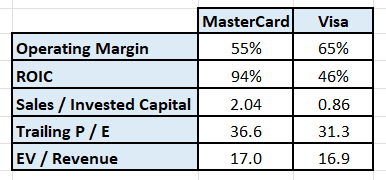
Author’s compilation using data from Yahoo Finance and company 10-K filings.
The table indicates that Visa can generate higher margins (Visa appears to have a much lower labor to sales ratio), but it has a significantly lower ROIC.
The data also suggests that Visa generates significantly fewer revenues from its invested capital.
The distortion in Visa’s invested capital numbers relates to the FY2016 acquisition of Visa Europe. I have reviewed the level of reinvestment required by Visa and Mastercard over the last 10 years, and the data indicates that the ratio of reinvestment to sales is similar (between 9% to 10% of sales).
The current relative valuation metrics for both companies are similar, which suggests that the market is pricing these companies as though they have the same financial performance characteristics.
I currently agree with the market view of Mastercard and Visa. I think that both are excellent companies and at the right price would make a good investment.
What should existing shareholders be doing?
I believe that Mastercard’s current stock price could be at the top end of its valuation. At these levels, I would not buy any more stock and I do not want it to be overweight within my portfolio.
Over the last couple of months, the stock’s price has corrected lower by about 10% from its peak and now appears to be cycling higher. Traders may have even added to their holding following the recent price dip, but my advice would be that once the price corrects higher than I would be looking to take profits, particularly if there is any sign that the stock is over-bought.
Mastercard is one of the better companies on the market and I always want to own it, but I manage my exposure based on my valuation and the stock’s price action. I have an allocation range for the stock in my portfolio, and I own more of it when it is cheap and less of it when it is expensive.
I trimmed back from my maximum holding a couple of months ago. I contemplated trading the recent dip, but I decided against it because I concluded that the potential near term upside was not sufficient to justify the additional risk on my portfolio. My current Mastercard allocation is slightly below the middle of my allocation range for the stock.
My summary advice is that Mastercard is a HOLD, but it needs to be actively managed.
Analyst’s Disclosure: I/we have a beneficial long position in the shares of MA either through stock ownership, options, or other derivatives. I wrote this article myself, and it expresses my own opinions. I am not receiving compensation for it (other than from Seeking Alpha). I have no business relationship with any company whose stock is mentioned in this article.
Seeking Alpha’s Disclosure: Past performance is no guarantee of future results. No recommendation or advice is being given as to whether any investment is suitable for a particular investor. Any views or opinions expressed above may not reflect those of Seeking Alpha as a whole. Seeking Alpha is not a licensed securities dealer, broker or US investment adviser or investment bank. Our analysts are third party authors that include both professional investors and individual investors who may not be licensed or certified by any institute or regulatory body.
