Summary:
- Based on its financial metrics, Mastercard is one of the highest-quality businesses listed on the public markets.
- Mastercard’s business is very sensitive to changes in consumer spending and to date, its performance remains strong in an economy which is becoming increasing turbulent.
- Increases in the Federal Reserve’s overnight funds rate flows directly to the cost of capital for all companies. The cost of capital is the discounting factor in asset valuations.
- Mastercard’s share price is yet to reflect the significant increase in its cost of capital and a corresponding decline in the value of its operating assets.
- The current price seems excessively inflated relative to fundamentals and investors should be braced for any sentiment corrections.
jbk_photography
Company Description
Mastercard Inc. (NYSE:MA) is a technology company in the global payments sector. Mastercard partners with financial institutions to issue Mastercard branded cards (generally co-branded with the issuing financial institution) that are processed through the Mastercard payments network.
In this operating model, Mastercard has no exposure to a breakdown in the credit process of the consumer or the corporate using the card. This risk is borne by the issuing financial institution.
Mastercard predominantly makes its revenues by charging a fee for every transaction flowing through its network but it also has a growing services business where it is using a SaaS approach to providing services such as cyber fraud detection and prevention, loyalty programs, etc.
The origins of Mastercard go back to a group of Californian banks who in 1966 formed an association called the Interbank Card Association (ICA). The association created a card called Master Charge to compete against the BankAmericard which was the precursor to Visa. In 1979 the Master Charge card was renamed Mastercard.
The Interbank Card Association was organized as a co-operative of its bank owners. In 2006 the company was floated on the NYSE.
The company currently only has 1 reportable operating segment, and it has recently changed the way that it presents net revenues into 2 sources (the proportion of total 2022 FY revenues is shown in brackets):
Author’s compilation using data from Mastercard‘s 10-K filings.
Business Overview
Mastercard has primarily grown organically (particularly the Payment Network infrastructure). The Value-Added Services business has predominantly grown through acquisitions.
Over the last 10 years Mastercard has spent more on acquisitions than capex ($5,631 M versus $9,462 M). Most of these acquisitions have been relatively modest in size but nevertheless important strategically, particularly regarding its growing Value-Added Services business.
Mastercard’s focus has always been to replace cash and cheques in the consumer payments sector. It has gained share by signing up more financial institutions to issue cards and more merchants who are prepared to accept the card.
Mastercard and its main competitor, Visa (V), have entrenched positions in the global card payments sector.
How the Card Payment Network Operates
The payments system is a 4-party network as shown in the following diagram:
Mastercard 2019 10-K filing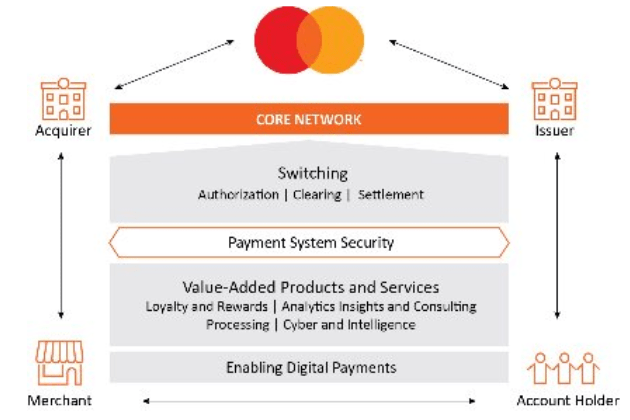
A typical transaction comprises a financial institution’s account holder (credit or debit card) purchasing goods and services from an accredited merchant using a Mastercard payment product (a card or a device).
The transaction is authorized by the card issuer (the cardholder’s financial institution) and the issuer pays the acquirer (the merchant’s financial institution) an amount equal to the transaction less the interchange fee. This transaction is then posted to the account holder’s account.
The acquiring institution pays the value of the transaction net of a discount (called the merchant’s discount) to the merchant’s account.
It is noted that Mastercard does not issue cards nor is it exposed to any credit default issues related to the transactions.
Payments’ Network Market Size
Mastercard estimated that in 2021 the total value of the transactions within the global Payments Network was $US 255 Trillion. There are 3 segments within the Payments Network which are depicted in the following chart:
Mastercard Investment Community Presentation, Nov. 2021.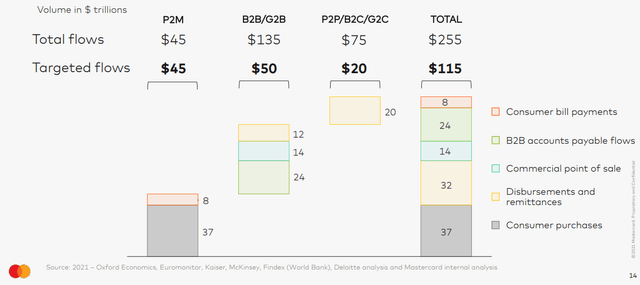
Mastercard’s primary target market segment is the Personal Consumption Expenditure (PCE) payments market. This segment is understood to have transactions totaling $US45 Trillion per year. Based on data from the Federal Reserve, total PCE expenditure in the US is growing between 5% to 6% per year. The payments market is also experiencing a secular shift within the segment away from cash and cheques to cards (both debit and credit). This shift has accelerated because of the COVID-19 pandemic which forced consumers to transact electronically when stores were shut down.
The following table shows the reported Gross Dollar Value of transactions of the major card payment networks:
Author’s compilation using data sourced from VISA’s 2022 10-K filing.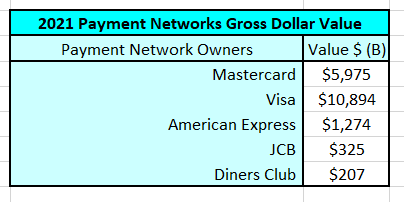
The table demonstrates the dominance of Visa and Mastercard in the card processing network.
It should be noted that the size of the Payments market (particularly the PCE segment) is directly influenced by the health of the global economy. This was clearly demonstrated in 2020 when the COVID-19 pandemic community lockdowns caused the global payments sector to have declining GDV for the first time since the 2008 / 2009 global financial crisis.
Mastercard’s Strategy
Mastercard’s strategy is reasonably straight-forward:
- Maintain its share of the PCE market and continue to grow through the natural growth of the global economy and by the secular shift away from cash and cheques to cards.
- Continue to penetrate the business to business (B2B) and government to business (G2B) segments by providing cost effective solutions to reduce client operating costs. Growth will come by providing a ramp on to the ACH network (the network used by banks to transfer payments between each other) or its own network and by converting current cash and cheque transactions to cards.
- Diversify its revenue streams by developing analytical solutions to either enhance the data mining of network transactions (thus providing unique insights to network participants) and by developing solutions to reduce fraud and cyber-crime.
Mastercard summarizes its strategy in the following slide:
Mastercard Investment Community Presentation, Nov. 2021.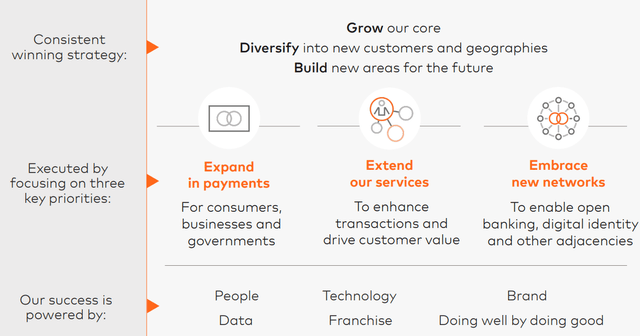
Mastercard has done an excellent job to date from a strategic execution stand-point as demonstrated by the growth in Gross Product Value (GPV) transacted over its network and net revenues per GPV since 2007:
Author’s compilation using data from Mastercard‘s 10-K filings.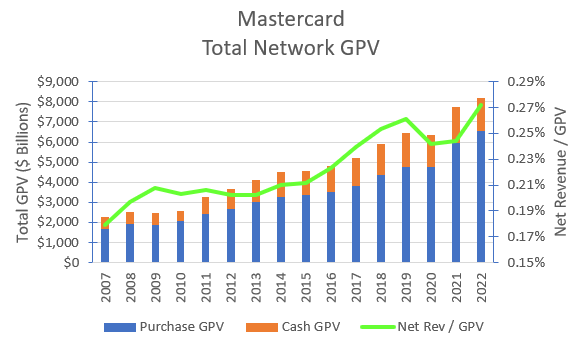
The data indicates that Mastercard has been able to grow its network GPV on average by 8.4% every year for the last 10 years. The growth in purchase transaction value is significantly higher than the cash transactions and far more consistent.
More importantly the chart indicates that Mastercard has been able to increase its net revenues as a proportion of total GPV. As GPV has increased, Mastercard has been able to increase its “take” per transaction.
Mastercard’s Historical Financial Performance
The following chart shows Mastercard’s historical revenues and operating margins:
Author’s compilation using data from Mastercard‘s 10-K filings.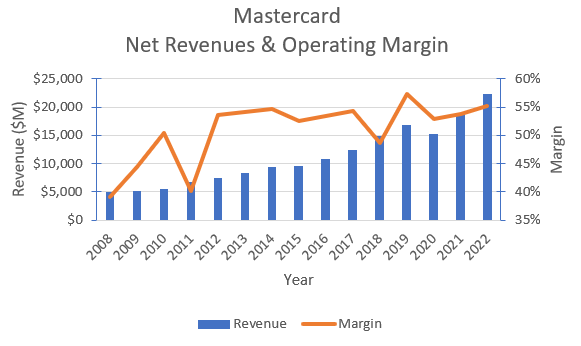
Mastercard’s revenues have grown steadily since the global financial crisis (GFC) and the 10-year CAGR is 11.6%.
Operating margins have been relatively steady (or slightly rising) for many years. The declines in margins in 2011 and 2018 were caused by large provisions for legal expenses. I have not adjusted the operating expenses for these events because I have formed the view that regulatory litigation has become a normal cost of business for Mastercard because of their dominant market position.
It is noted that Mastercard has recently begun showing net revenues as either coming from its payments network or from value added services. At this stage it is difficult to draw conclusions as to which revenue source is growing faster and the company is not providing any information about the relative margins of these activities.
I measure the strength of a company’s competitive position by its return on invested capital:
Author’s compilation using data from Mastercard‘s 10-K filings.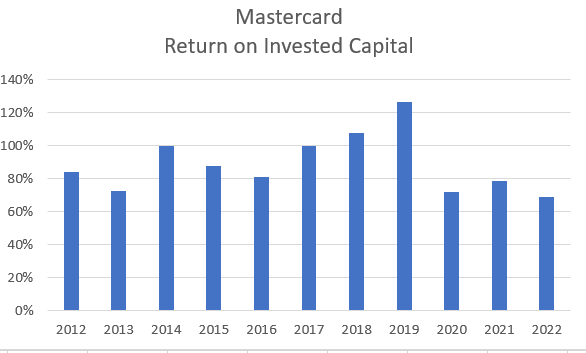
Mastercard’s return on invested capital (ROIC) is excellent but it has sharply declined since 2019 following a series of acquisitions related to the value-added services business.
This does not necessarily imply that Mastercard over-paid for these businesses, it serves to remind us about the extraordinary profitability of the network processing business.
Mastercard’s Capital Structure
Mastercard has slowly been increasing its debt levels as the company has grown older, but the debt ratio remains very low:
Author’s compilation using data from Mastercard‘s 10-K filings.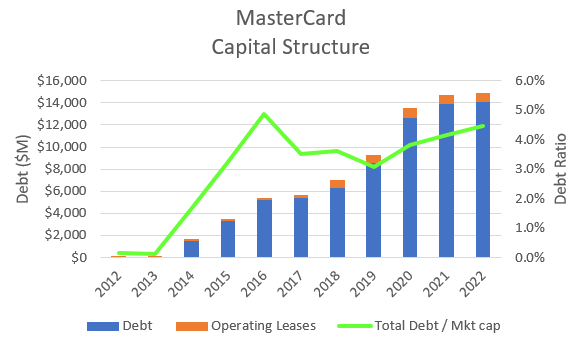
Mastercard’s Cash Flows
A review of Mastercard’s cash flow statements for the last 10 years reveals the following information:
Author’s compilation using data from Mastercard‘s 10-K filings.
Mastercard has reinvested almost 24% of its operating cash flows back into the business. It has taken on an additional $14,155 M in debt. The company then returned $58,094 M back to its shareholders (81% buybacks and 19% dividends). In total, the company has returned almost 91% of its operating cash flows back to shareholders.
This is an example of a seriously profitable company.
Mastercard has used its excess Free Cash Flow to Capital to shrink the capital component of its Balance Sheet. As a result, the numerator of the ROIC ratio has expanded whilst the denominator has shrunk. This has caused the ratio to grow to levels only associated with the very best companies.
Key Risks Facing Mastercard
I see two significant risks facing Mastercard which could dramatically impact the future profitability of the company:
- A new competitor with superior technology enters the payments market. This could cause Mastercard’s revenue growth and operating margins to shrink considerably.
- There is much speculation that the major central banks (such as the Federal Reserve) may in the future establish their own digital currencies [CBDC]. In my opinion if this were to occur it would cause major changes to the global banking and payments systems. Potentially it could make the private sector payment networks obsolete. The Federal Reserve is soon to go live with an upgraded payments system (FedNow) which will be used by participating financial institutions to instantly transfer payments with each other. I would think that this system could be expanded to handle the activities of the private sector payment networks.
Investors may currently assign low probabilities to these risks but nevertheless the risks cannot be totally dismissed when assessing Mastercard’s future prospects.
My Investment Thesis for Mastercard
I think there are 2 scenarios that should be evaluated:
- The status quo where Mastercard and Visa continue to dominate the payments market. Mastercard’s long-term growth rate is sustained for the next 7 years and there is no disruption to its operating margins.
- A new competitor enters the payments market with a superior product. This causes Mastercard’s revenue growth to drop to 5% and its operating margin to fall to 38.3% (the 75th percentile of the sector).
I see no point in valuing the scenario where CBDC’s are introduced because in this scenario I think that Mastercard’s payment network is essentially worthless.
Key Inputs into Mastercard’s Valuation
The assumptions can then be summarised into the following inputs for the valuation model:
Author’s model assumptions.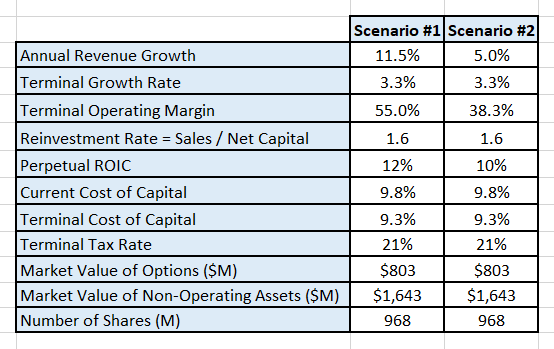
- The valuation is based on a forecast for the next 10 years.
- The revenue growth refers to years 3 to 6 with the current consensus analyst estimates being used for years 1 and 2. The growth rate will gently decline in years 7 to 9 to the terminal growth rate.
- The terminal cost of capital is my current estimate of the median cost of capital of the 2,000 largest US non-finance sector companies.
Discounted Cash Flow Valuation
A Free Cash Flow to the Firm approach is used with a 3-stage model (high growth, declining growth and maturity). The model only seeks to value the cash flows of the operating assets. The valuation has been performed in $USD.
The output from my DCF model for Scenario 1 is:
Author’s model output. Author’s model output.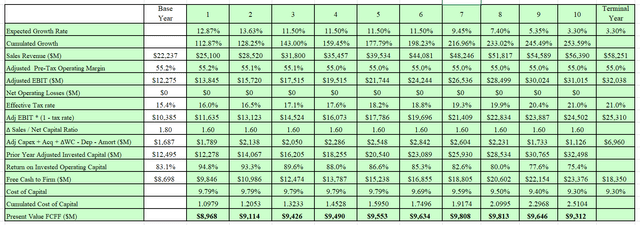
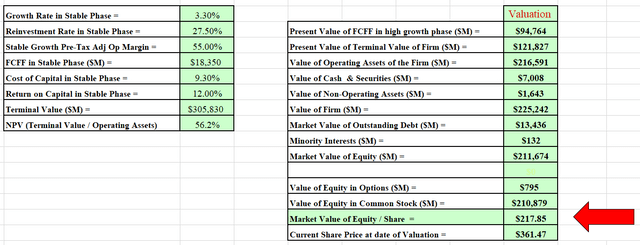
I have also developed a Monte Carlo simulation for the valuation based on the range of inputs for the valuation. The output of the simulation was developed after 100,000 iterations.
The Monte Carlo simulation can be used to help us to understand the major value drivers in the valuation. It turns out that the key value drivers for Mastercard (based on my scenario) are the revenue growth estimate and the expected terminal cost of capital. These inputs account for 73% of the variation within the valuation and are the greatest source of risk in the valuation.
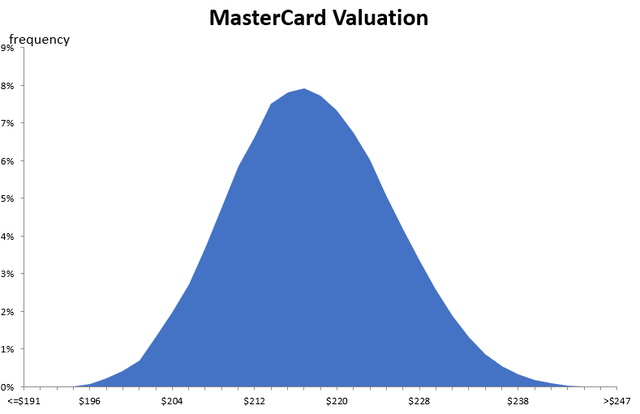
The simulation indicates that Mastercard’s intrinsic value is between $191 and $247 per share with a mid-point of $218.
Valuation for Scenario 2
For reason of brevity, I won’t show the base output of Scenario 2’s valuation but the valuation result is $130 per share. Unsurprisingly, if Mastercard’s sales growth and margins are dramatically reduced then the value of the company is significantly lower.
Final Recommendation
The Mastercard franchise has been (and may continue to be) a wonderful business. It has provided excellent returns for investors who have bought the stock at the times during the economic cycle when it was cheap.
I have been a shareholder of Mastercard for many years, and I have valued the company many times over the journey. By my estimate, MA stock is currently very expensive for even the most optimistic scenario.
The following table attempts to assess what the most impactful valuation inputs would need to be to justify the current market price for Mastercard:
Author’s model.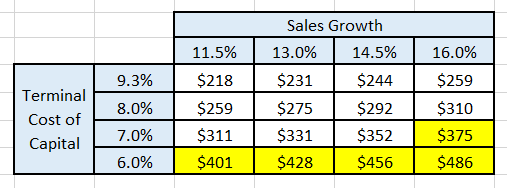
The table indicates that to justify the current market price the terminal cost of capital needs to be significantly lower. I have observed cost of capital at these levels in the past but they were when the 10-year US Treasury bond rate was closer to 1.5%.
I have major concerns about the prices being paid for risk assets in the current economic environment. The market’s cost of capital has increased significantly in the last year because of rising risk-free interest rates. This has contributed to many stocks being repriced lower but there are other stocks (such as Mastercard) which have continued to trade near their 12-month highs.
It is for this reason I believe that Mastercard is a SELL.
I have recently taken the opportunity to trim my Mastercard holding back to my minimum allocation and I would recommend that other holders of the stock should carefully consider their strategic allocation to the stock.
Analyst’s Disclosure: I/we have a beneficial long position in the shares of MA either through stock ownership, options, or other derivatives. I wrote this article myself, and it expresses my own opinions. I am not receiving compensation for it (other than from Seeking Alpha). I have no business relationship with any company whose stock is mentioned in this article.
Seeking Alpha’s Disclosure: Past performance is no guarantee of future results. No recommendation or advice is being given as to whether any investment is suitable for a particular investor. Any views or opinions expressed above may not reflect those of Seeking Alpha as a whole. Seeking Alpha is not a licensed securities dealer, broker or US investment adviser or investment bank. Our analysts are third party authors that include both professional investors and individual investors who may not be licensed or certified by any institute or regulatory body.

