
Summary:
- In today’s analysis, I will show you why I have decided to incorporate Mastercard into The Dividend Income Accelerator Portfolio.
- I will compare Mastercard with competitors such as Visa, PayPal, Block and Fiserv, and will show the company’s superiority in terms of Profitability and Dividend Growth.
- After the acquisition of Mastercard, we have raised the portfolio’s 5-Year Weighted Average Dividend Growth Rate [CAGR] to 10.73% and have further optimized it in terms of risk/reward.
- With a proportion of 6.86% of the overall investment portfolio, Apple continues to be the largest individual position of The Dividend Income Accelerator Portfolio, followed by Mastercard (6.58%).
jir
Investment Thesis
Approximately 6 weeks ago, I started building The Dividend Income Accelerator Portfolio and transparently documenting its construction here on Seeking Alpha.
The investment portfolio’s goal is to strive for an attractive Total Return while providing you with a reduced risk level, and helping you generate extra income through the combination of high dividend yield and dividend growth companies.
Within the past weeks, I have focused on adding companies that pay an attractive Dividend Yield, in order to increase the portfolio’s Weighted Average Dividend Yield. I’ve also looked at companies that come attached to a low risk level, thus contributing to decreasing the portfolio’s volatility. Among the companies that have already been added to the portfolio are: Realty Income (O), Philip Morris (PM), Royal Bank of Canada (RY), and AT&T (T).
With the inclusion of Apple (AAPL), we have optimized The Dividend Income Accelerator Portfolio in terms of risk/reward by striving for an attractive Total Return.
With the incorporation of Mastercard (NYSE:MA), we want to further improve the investment portfolio when it comes to risk/reward, and aim to raise its Weighted Average Dividend Growth Rate at the same time. This helps us to increase the additional income via dividend payments at an attractive rate, thus helping us to become more independent from stock market price fluctuations over the long term.
I believe that Mastercard is one of the world’s best risk/reward choices for long-term investors and I think it can significantly contribute to raising the Weighted Average Dividend Growth Rate of our portfolio (the company has shown a Dividend Growth Rate [CAGR] of 17.80% over the past 5 years).
Due to Mastercard’s strong competitive advantages, its financial health (Aa3 credit rating from Moody’s), and its attractive growth rates (3 Year Revenue Growth Rate [CAGR] of 13.29%), in combination with the relatively low risk level, I am convinced that the company is an excellent pick in terms of risk/reward.
Therefore, I plan to overweight the Mastercard position within the Dividend Income Accelerator Portfolio. This further aligns with the investment approach of my private investment portfolio, in which Mastercard is one of my largest positions.
At this moment in time, Apple is the largest individual position of The Dividend Income Accelerator Portfolio (with a proportion of 6.86% of the overall portfolio), followed by Mastercard (6.58%). This strengthens my belief that the portfolio is very well positioned in terms of risk and reward.
The Dividend Income Accelerator Portfolio
The Dividend Income Accelerator Portfolio’s objective is the generation of income via dividend payments, and to annually raise this sum. In addition to that, its goal is to attain an appealing Total Return when investing with a reduced risk level over the long-term.
The Dividend Income Accelerator Portfolio’s reduced risk level will be reached due to the portfolio’s broad diversification over sectors and industries and the inclusion of companies with a low Beta Factor.
Below you can find the characteristics of The Dividend Income Accelerator Portfolio:
Attractive Weighted Average Dividend Yield [TTM]
Attractive Weighted Average Dividend Growth Rate [CAGR] 5 Year
Relatively low Volatility
Relatively low Risk-Level
Attractive expected reward in the form of the expected compound annual rate of return
Diversification over asset classes
Diversification over sectors
Diversification over industries
Diversification over countries
Buy-and-Hold suitability
Mastercard’s Competitive Advantages
Mastercard’s strong Brand Image
According to Brand Finance, Mastercard currently holds position 74 in the ranking of the most valuable brands in the world (it held position 88 in the previous year). The company’s strong brand image is important within the Transaction & Payment Processing Services Industry, in which values such as trust and reliability are essential.
Mastercard’s Strong Network within the Financials Industry
Mastercard was founded in 1966. The company has established a broad network within the Financials Industry with financial institutions, companies from the fintech sector and banks, which provide the company with another competitive edge over competitors.
Mastercard’s Network Effect
Mastercard’s Network effect provides the company with an additional competitive edge over competitors: the more retailers that accept Mastercard payments, the more consumers will tend to pay with Mastercard. This also applies the other way around: the more consumers want to pay with Mastercard, the more likely retailers are to enter into a partnership with Mastercard and accept this payment method.
Mastercard’s Economies of Scale
Mastercard’s Economies of Scale contribute significantly to the company having cost advantages over smaller competitors, thus providing it with additional advantages when compared to such opponents.
Mastercard’s strength in terms of Profitability
It is further worth mentioning that Mastercard is an excellent choice in terms of Profitability. The company has an EBITDA Margin [TTM] of 60.33%, which is 207.11% above the Sector Median of 19.64%. Its Net Income Margin [TTM] of 43.37% stands 68.19% above the Sector Median.
In addition to that, Mastercard has a Return on Equity of 175.25%, which is significantly above the Sector Median of 11.37%.
Mastercard’s financial strength is further underlined by its Aa3 credit rating from Moody’s. All of these metrics confirm my investment thesis that Mastercard is a great pick when it comes to Profitability.
Resuming, it can be highlighted that all of these competitive advantages contribute to the economic moat that Mastercard has over its competitors, thus strengthening my investment thesis that the company is an excellent risk/reward choice for investors.
Mastercard’s Valuation
Discounted Cash Flow Model for Mastercard
At Mastercard’s current stock price of $393.00, my DCF Model indicates an Internal Rate of Return of 9.1%. Below you can find an overview of the Internal Rate of Return when assuming different purchasing prices for the Mastercard stock. For the calculations of my DCF Model, I have assumed a Revenue and EBIT Growth Rate of 12% for the following 5 years, and a Perpetual Growth Rate of 4% afterwards.
|
Purchase Price of the Mastercard Stock |
Internal Rate of Return as according to my DCF Model |
|
$350.00 |
12% |
|
$360.00 |
12% |
|
$370.00 |
11% |
|
$380.00 |
10% |
|
$390.00 |
9% |
|
$393.00 |
9% |
|
$400.00 |
9% |
|
$410.00 |
8% |
|
$420.00 |
7% |
|
$430.00 |
7% |
|
$440.00 |
6% |
Source: The Author
Mastercard’s Dividend and Dividend Growth and the Projection of its Yield on Cost
Mastercard has shown a Dividend Growth Rate [CAGR] of 12.53% over the past 3 years. Due to the company’s low Payout Ratio of 19.96% in combination with its excellent growth perspectives (Revenue Growth Rate [CAGR] of 13.29% over the past 3 years), I believe that it could show similar Dividend Growth Rates in the following years.
When assuming that Mastercard would be able to raise its Dividend by 11% per year for the following 30 years, investors could potentially reach a Yield on Cost of 1.65% in 2033, 4.68% in 2043, and 13.28% in 2053.
Assuming the same Dividend Growth Rates, investors could potentially get back their initial investment in the form of dividends by 2051 (no withholding taxes have been included in this calculation).
Source: The Author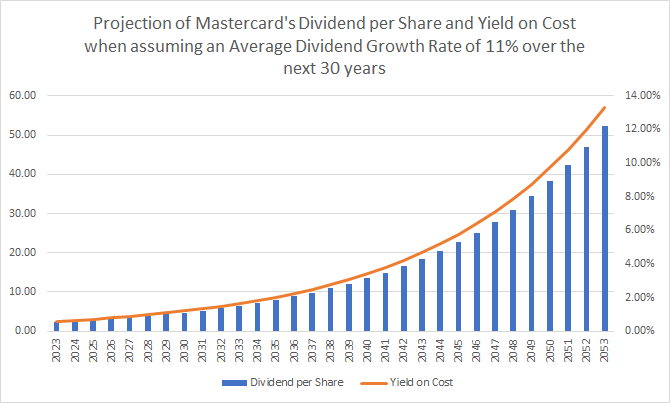
Mastercard compared to its Peer Group
In the following, I will compare Mastercard to competitors such as Visa (V), PayPal (PYPL), Block (SQ) and Fiserv (FI).
In terms of Profitability, both Mastercard and Visa are superior when compared to PayPal, Block and Fiserv. Mastercard and Visa’s EBIT Margins [TTM] are 57,14% and 67.09% respectively, while PayPal’s is 16.54%, Block’s is -1.92% and Fiserv’s is 22.82%.
In addition to that, it can be highlighted that Mastercard’s Return on Equity of 172.79% is significantly higher than Visa’s (Return on Equity of 44.40%), PayPal’s (20.67%), Block’s (-1.62%) and Fiserv’s (8.15%), thus underscoring my investment thesis that Mastercard is an excellent pick in terms of Profitability.
I believe that Mastercard is also a great choice when it comes to Dividend Growth. The company has shown a Dividend Growth Rate [CAGR] of 17.80% over the past 5 years while Visa’s is at 16.89%. PayPal, Block and Fiserv do not currently pay a Dividend.
In terms of Valuation, however, PayPal seems to be the most adequate pick for investors: with a P/E [FWD] Ratio of 16.39, its Valuation is significantly below Fiserv’s (P/E [FWD] Ratio of 23.98), Visa’s (27.65), and Mastercard’s (32.72).
Mastercard’s relatively high Valuation serves as an indicator that relatively high growth expectations are priced into the company’s stock price (you will find additional information on this topic in the risk section of this analysis).
|
MA |
V |
PYPL |
SQ |
FI |
|
|
Company Name |
Mastercard |
Visa |
PayPal |
Block |
Fiserv |
|
Sector |
Financials |
Financials |
Financials |
Financials |
Financials |
|
Industry |
Transaction & Payment Processing Services |
Transaction & Payment Processing Services |
Transaction & Payment Processing Services |
Transaction & Payment Processing Services |
Transaction & Payment Processing Services |
|
Market Capitalization |
368.46B |
465.71B |
64.30B |
25.66B |
67.70B |
|
P/E GAAP [FWD] |
32.72 |
27.65 |
16.39 |
NM |
23.98 |
|
Dividend Yield [FWD] |
0.58% |
0.79% |
– |
– |
– |
|
Dividend Growth 5 Yr [CAGR] |
17.80% |
16.89% |
– |
– |
– |
|
Consecutive Years of Dividend Growth |
11 Years |
14 Years |
– |
– |
– |
|
Payout Ratio |
19.96% |
21.53% |
– |
– |
– |
|
Revenue 3 Year [CAGR] |
13.29% |
11.63% |
14.11% |
49.57% |
8.60% |
|
EBIT Margin |
57.14% |
67.09% |
16.54% |
-1.92% |
22.82% |
|
Return on Equity |
172.79% |
44.40% |
20.67% |
-1.62% |
8.15% |
|
60M Beta |
1.09 |
0.95 |
1.34 |
2.34 |
0.88 |
Source: Seeking Alpha
Why Mastercard aligns with the investment approach of The Dividend Income Accelerator Portfolio
- Mastercard has significant competitive advantages over its opponents (such as its network effects, strong brand image, and economies of scale), helping the company build an economic moat over competitors.
- Besides Mastercard’s strong competitive advantages, the company is financially healthy, underlined by its high EBIT Margin of 57.14%, its high Return on Equity of 172.79%, in addition to its Aa3 credit rating from Moody’s, matching with the investment approach of The Dividend Income Accelerator Portfolio.
- Mastercard has shown a Dividend Growth Rate [CAGR] of 17.80% over the past 5 years, indicating that it can contribute significantly to raise the portfolio’s Weighted Average Dividend Growth Rate. This aligns with the approach of The Dividend Income Accelerator Portfolio to raise your extra income on an annual basis via dividend payments.
- My DCF Model indicates an Internal Rate of Return of 9.1% for Mastercard, indicating that the reward for investors seems to be appealing.
- I believe that the risk level is relatively low for investors. This is due to Mastercard’s strong competitive advantages and enormous financial health, once again reinforcing my belief that the company is a great match for The Dividend Income Accelerator Portfolio.
- For all of the reasons mentioned above, I believe that Mastercard is an excellent risk/reward choice, aligning strongly with the investment approach of The Dividend Income Accelerator Portfolio, which aims to overweight companies that are particularly attractive in terms of risk/reward.
Investor Benefits of The Dividend Income Accelerator Portfolio after Investing $100 in Mastercard
With the inclusion of Mastercard into The Dividend Income Accelerator Portfolio, we have further optimized the portfolio when it comes to risk and reward.
I believe that an investment in Mastercard comes attached to a relatively low risk level while providing us with an attractive reward (in the form of an appealing expected annual rate of return).
After the acquisition of Mastercard, The Dividend Income Accelerator Portfolio shows a Weighted Average Dividend Yield [TTM] of 3.70%, and we have raised the Weighted Average Dividend Growth Rate [CAGR] over the past 5 years to 10.73%.
Below you can find an overview of the current positions of The Dividend Income Accelerator Portfolio.
Source: Interactive Brokers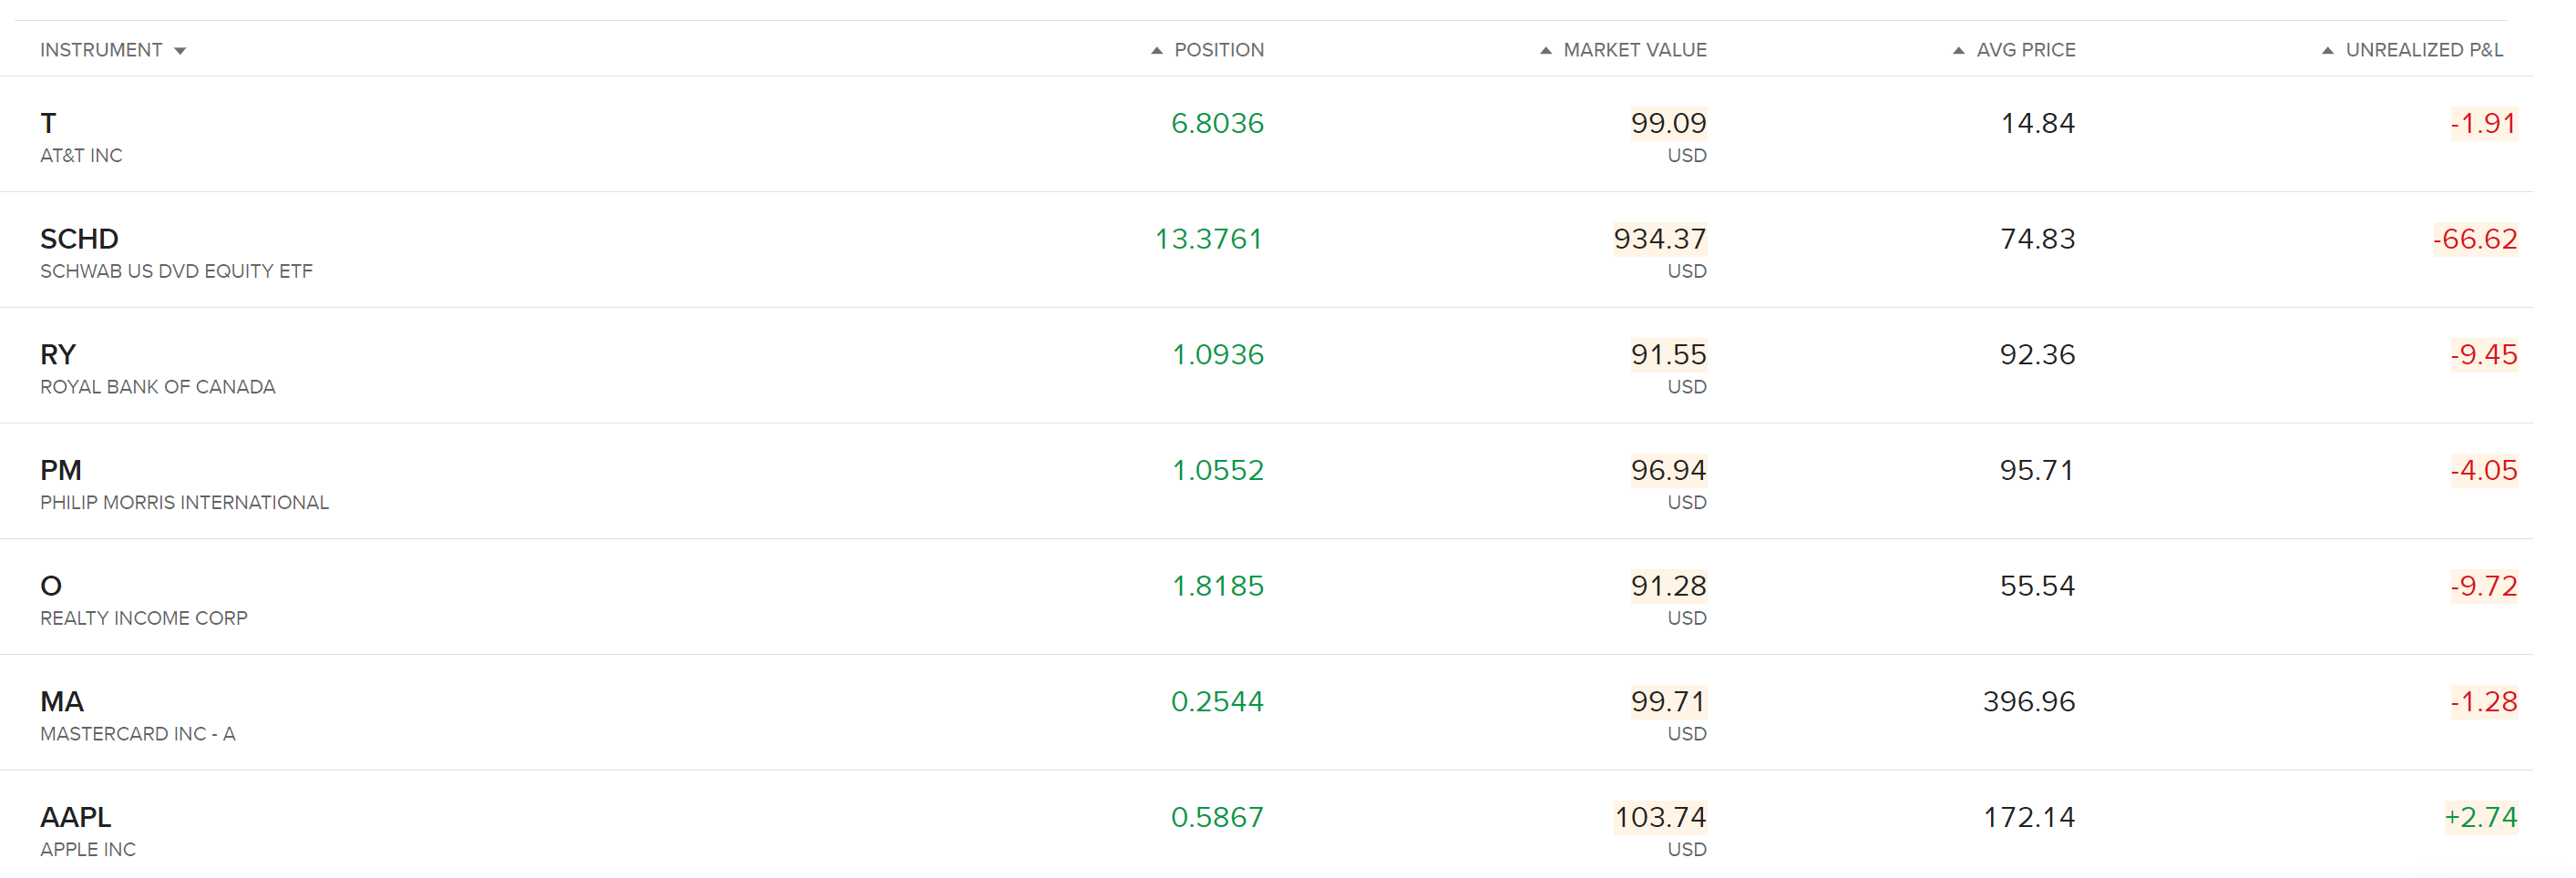
I am convinced that The Dividend Income Accelerator Portfolio offers investors a reduced risk level. This is due to the inclusion of companies with strong competitive advantages and which are financially healthy, in addition to including companies with a Beta Factor below 1 (such as Realty Income, Philip Morris, Royal Bank of Canada, and AT&T).
After the acquisition of Mastercard, Apple continues to be the largest position of The Dividend Income Accelerator Portfolio, with a proportion of 6.86%, followed by Mastercard with a proportion of 6.58%. I believe that both companies are highly attractive in terms of risk and reward, increasing my confidence to overweight both within The Dividend Income Accelerator Portfolio.
All of these characteristics make me strongly believe that The Dividend Income Accelerator Portfolio is highly attractive for long-term investors who are aiming to generate extra income, want to combine dividend income with dividend growth and are striving for an attractive Total Return.
Risk Factors
Due to Mastercard’s strong competitive advantages (which I explained in more detail at the beginning of this analysis), in combination with its financial health, I believe that the risk factors for investors are relatively low.
However, there are still risk factors that Mastercard investors should be aware of before they decide to invest in the company.
Mastercard’s relatively high Valuation
One of the main risk factors I see for Mastercard investors is the company’s relatively high P/E [FWD] Ratio of 32.72. This means that the growth expectations that are priced into the share price of Mastercard are relatively high. It further implies that the company’s share price could drop significantly if it was not able to meet its growth targets.
However, I believe that this risk factor is less significant for long-term investors. Since the investment approach of The Dividend Income Accelerator Portfolio is based on a long-term horizon, I believe that Mastercard has a strong alignment with the portfolio’s investment approach.
A recession could negatively affect Mastercard’s Financial Performance
A recession is another risk factor that I see for Mastercard investors, as it could have a relatively strong impact on the company’s financial performance. Significantly lower consumer spending would affect Mastercard’s Revenue and Profits negatively, and could have a relatively strong impact on its stock price. This is particularly the case since relatively high growth expectations are priced into the company’s stock price.
In my DCF Model, for example, I have calculated with a Revenue and EBIT Growth Rate of 12% for the following 5 years and a Perpetual Growth Rate of 4% afterwards. If Mastercard’s growth rates were significantly below these rates, the company’s stock price could decline significantly.
However, I believe that such scenarios would mainly affect those who invest over the short term. Over the long term, I believe that Mastercard’s competitive advantages will help the company to perform strongly and keep its growth perspective intact.
Final thoughts about the Risk Factors for Mastercard investors
Due to Mastercard’s relatively high Valuation, and the fact that relatively high growth expectations are priced into the company’s stock price, I suggest to invest in Mastercard over the long term. When investing over the long term, I see the risk factors for investors as being significantly lower, due to the company’s robust business model, its financial health, and significant competitive advantages.
Therefore, I strongly believe that Mastercard aligns perfectly with the investment approach of The Dividend Income Accelerator Portfolio. The portfolio is built for the long term and aims to overweight companies that are attractive in terms of risk and reward.
Conclusion
With Mastercard’s inclusion into The Dividend Income Accelerator Portfolio, we have further optimized the portfolio when it comes to risk and reward, aiming to achieve an attractive Total Return when investing over the long term. In addition to that, we have increased the portfolio’s Weighted Average Dividend Growth Rate [CAGR] over the past 5 years, helping you to raise extra income via dividend payments on an annual basis.
I believe that Mastercard is an excellent fit for The Dividend Income Accelerator Portfolio, due to its strong competitive advantages, its financial health, and its relatively low risk level, in combination with the company’s attractive growth outlook.
At this moment in time, The Dividend Income Accelerator Portfolio provides investors with a Weighted Average Dividend Yield [TTM] of 3.70%, and with a Weighted Average Dividend Growth Rate over the past 5 years of 10.73%. This means that it can already help you generate significant extra income via dividend payments. At the same time, I expect the portfolio to provide you with significant dividend growth within the next years.
Another benefit I see for investors when implementing the investment approach of The Dividend Income Accelerator Portfolio is that it can help you to achieve excellent investment results in both bullish and bearish market scenarios.
This is the case due to the portfolio’s balanced combination of high dividend yield and dividend growth companies, and its inclusion of companies with a low risk level. Furthermore, the portfolio includes companies with attractive growth perspectives (such as Mastercard). The composition of The Dividend Income Accelerator Portfolio helps you to benefit in both market scenarios, providing you with a win-win situation.
Author’s Note: Thank you for reading! I would appreciate hearing your opinion on my selection of Mastercard as the seventh acquisition for The Dividend Income Accelerator Portfolio. I also appreciate any thoughts about The Dividend Income Accelerator Portfolio or any suggestion of companies that would fit into the portfolio’s investment approach!
Analyst’s Disclosure: I/we have a beneficial long position in the shares of MA, V, PYPL, AAPL, SQ, O, PM, T, RY either through stock ownership, options, or other derivatives. I wrote this article myself, and it expresses my own opinions. I am not receiving compensation for it (other than from Seeking Alpha). I have no business relationship with any company whose stock is mentioned in this article.
Seeking Alpha’s Disclosure: Past performance is no guarantee of future results. No recommendation or advice is being given as to whether any investment is suitable for a particular investor. Any views or opinions expressed above may not reflect those of Seeking Alpha as a whole. Seeking Alpha is not a licensed securities dealer, broker or US investment adviser or investment bank. Our analysts are third party authors that include both professional investors and individual investors who may not be licensed or certified by any institute or regulatory body.