Summary:
- Mastercard stock now trades at a high P/E ratio of 32.18x, significantly higher than the sector median and the overall market.
- However, MA is still well positioned to deliver marketing-beating returns in the years to come despite its current valuation premium.
- Analysts expect strong EPS growth for MA, which could lead to a decline in the P/E ratio rapidly.
- Once the growth potential and consistency (plus the financial strength) are factored in, it’s a textbook GARP opportunity (growth at a reasonable price).

jir
MA stock trades at 32x P/E
Mastercard (NYSE:MA) shares have rallied strongly in the past 1~2 years thanks to its stellar results. The stock recently reached an all-time high of around $530. The price has come down by about 14% since then and hovers around $460 as of this writing. Despite the correction, the current stock price still translates into an elevated P/E ratio of 32.18x as seen in the chart below (on an FWD basis).

Seeking Alpha
To better contextualize things, the chart below summarizes MA stock’s valuation metrics and compares them to the sector median. As seen, MA stock’s P/E ratios are significantly higher than the sector median (although a bit lower than its five-year average). For example, on a trailing twelve months (“TTM”) and non-GAAP basis, its P/E ratio is 35.95x. In contrast, the sector median is only 10.62x. This translates to a difference of more than 238%. The forward non-GAAP P/E tells a similar story, with MA’s ratio (32.18x) nearly doubling that of the sector median (10.81x). Broadening the comparison a bit more, MA’s P/E ratio is also substantially above that of the S&P 500 index (about 28x currently), which is among the most expensive levels in its own history.
Against this background, the thesis of this article is to explain why MA is still well positioned to deliver market-beating returns in the years to come despite its current prices.

Seeking Alpha
MA stock: EPS and growth outlook
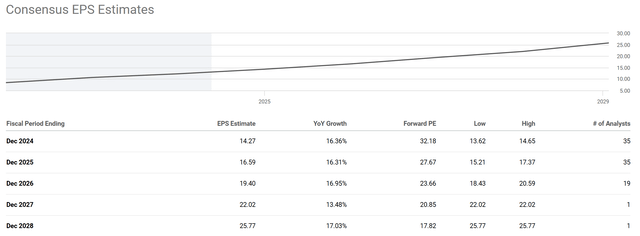
First, I anticipate strong EPS growth ahead to shrink its P/E quickly. The chart below shows the consensus EPS estimates for MA stock in the next five fiscal years. Based on the chart, analysts expect Mastercard’s EPS to grow consistently at double-digit rates over the next five years. For instance, the consensus EPS estimate for fiscal year 2024 is $14.27, translating into an annual growth rate of 16.3% year-over-year. This is then predicted to grow by more than 16% in the next two years to $19.4 in fiscal year 2026. Under the EPS projections, MA’s forward P/E ratio is expected to decline rapidly. The current forward P/E ratio of 32.18x would decline to about 27x by fiscal year 2025 (i.e., cheaper than the S&P 500) and to only about 17.8x in five years.
I think the above projection is very plausible, and the key drivers are twofold: its strong growth in transaction volumes, and its astronomical return on capital employed, as detailed next.
Seeking Alpha
MA stock: Even ROE underestimates its profitability
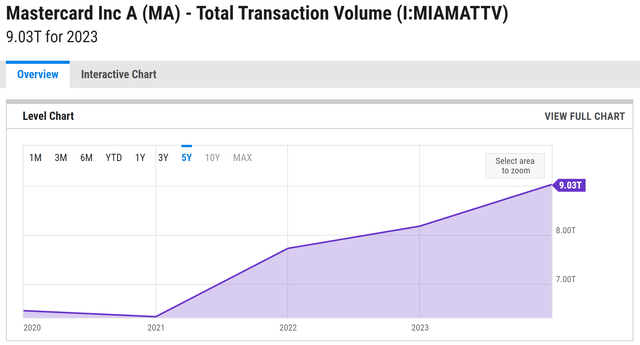
I’m very optimistic that its transaction activity will keep expanding at a good clip in years to come. Its gross dollar volume (“GDV”) increased 12% in 2023, to a company-record $9.0 trillion (see the chart below). All geographies contributed to the strong growth. Some emerging markets showed especially strong momentum, such as growth in Latin America exceeding 22.0%, Transaction volumes in mature markets (i.e., North America) were also solid, including progress in the United States (+5.9%) and Canada (+5.8%). Looking ahead, thanks to its scale, brand recognition, and the expansion of e-commerce, I anticipate its GDV to keep growing at around a 10% annual rate in the next few years.
YCharts
To provide an independent assessment, here I will also estimate its growth rates based on its ROCE (return on capital employed) and reinvestment rates. The method is detailed in my other articles. So I will only quote the end results:
The method involves the return on capital employed (“ROCE”) and the reinvestment rate (“RR”). The ROCE for MA has been exceeding 180% consistently in recent years. Assuming an RR of about 7% on average (which is its average in recent years), its organic growth rate would be ~12.6% (180% ROCE x 7% RR = 12.6%). Note this number is the real growth rate without inflation. To obtain a notional growth rate, one would need to add an inflation escalator. Assuming an average inflation of 2.5% would bring the nominal growth rate to over 15%, quite close to the consensus estimates above.
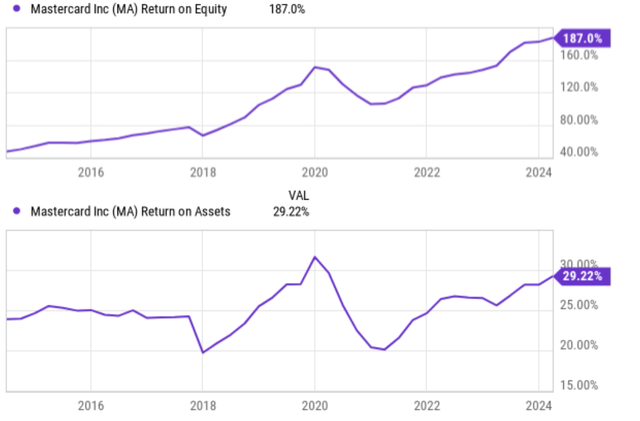
Here I want to make a special note of the distinctions between ROCE and the commonly quoted metrics such as ROA and ROE as shown below. For a business like MA, ROA severely underestimates its profitability, as a large portion of the assets are not required in its operation. ROE does not reflect true profitability either, as it can be almost arbitrarily altered with the use of leverage. As you can see from the chart below, MA’s ROE has steadily increased by more than four-fold (from about 40% to the current 187% over the past decade), although this is largely due to the change in its capital structure and my analysis shows that the changes in its ROCEs are not nearly as dramatic (although still considerable).
Readers interested in more details can see my free blog article entitled “ROE Vs. ROCE With Q&A.” But in any case, for most businesses, I considered the capital necessary for their operations to include account receivables (about $4B), account payables (about $0.8B), inventory (which is negligible for MA), and net PPE (plants, property, and equipment, about $2B). With these items alone, MA’s ROCE would exceed 200%. However, for a business like MA which relies heavily on its intangibles and technology infrastructure, I also include the amortization of intangibles and deprecation as part of the capital required. The inclusion of these items shrank its ROCE a bit to about 180% mentioned above.
Seeking Alpha
MA stock: Return projections
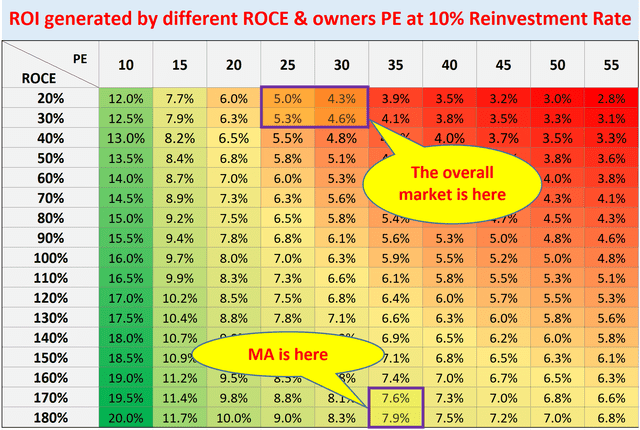
With the ROCE analyzed, it’s quite straightforward to estimate MA’s return projections, thanks to its consistent RR and growth rate. The model I used to estimate long-term returns (i.e., as a business owner, not a trader) is summarized in the table below. As detailed in our earlier article:
- The long-term ROI (return on investment) for a business owner is simply determined by two things: A) the price paid to buy the business and B) the quality of the business. More specifically, part A is determined by the owner’s earning yield (“OEY”) when we purchased the business. And that is why P/E is the first dimension in our roadmap. Part B is determined by the quality of the business and that is why ROCE, the most important metric for profitability, is the second dimension in our roadmap.
- The Longer-Term ROI is then the sum of A and B, which equals = OEY + Growth Rate = OEY + ROCE*Reinvestment Rate
As seen, thanks to MA’s stellar ROCE and growth rates, the long-term ROI is projected to be ~8%, noticeably higher than that of the broader market despite its much higher P/E ratio.
Author
Other risks and final thoughts
In terms of downside risks, MA shares most of the key risks common to its payment-processing peers. These risks include impacts from economic downturns, regulatory changes, etc. A recession could lead to decreased consumer spending and fewer transactions, impacting fee revenue across the industry. Additionally, regulators may enact stricter rules on fees, data privacy, or even cap their fees, thus squeezing profit margins for all payment processors. In terms of risks more specific to MA, it relies heavily on credit card transaction growth compared to some competitors who offer a broader range of financial services. This reliance could make MA more sensitive to alternative payment methods and the rise of fintech startups.
All told, my view is that the positives will be the dominating forces in the years to come. I consider MA to be a solid hold for most accounts, especially for more conservative investors, even though it could feel counterintuitive that a stock with such a high P/E could be a good hold for conservative accounts. But I think it will make sense once the growth potential, growth consistency, and financial strength of the company are factored into consideration. On the contrary, for more aggressive investors, an annual return of ~8% in the long term might leave more to be desired.
Analyst’s Disclosure: I/we have no stock, option or similar derivative position in any of the companies mentioned, and no plans to initiate any such positions within the next 72 hours. I wrote this article myself, and it expresses my own opinions. I am not receiving compensation for it (other than from Seeking Alpha). I have no business relationship with any company whose stock is mentioned in this article.
Seeking Alpha’s Disclosure: Past performance is no guarantee of future results. No recommendation or advice is being given as to whether any investment is suitable for a particular investor. Any views or opinions expressed above may not reflect those of Seeking Alpha as a whole. Seeking Alpha is not a licensed securities dealer, broker or US investment adviser or investment bank. Our analysts are third party authors that include both professional investors and individual investors who may not be licensed or certified by any institute or regulatory body.
As you can tell, our core style is to provide actionable and unambiguous ideas from our independent research. If your share this investment style, check out Envision Early Retirement. It provides at least 1x in-depth articles per week on such ideas.
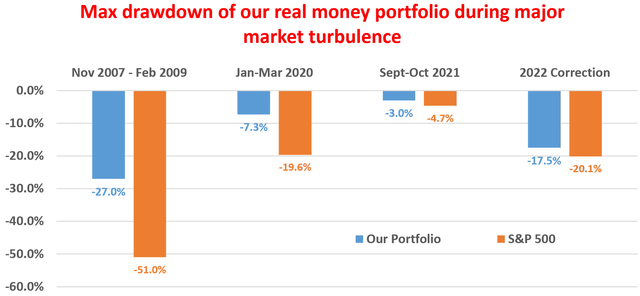
We have helped our members not only to beat S&P 500 but also avoid heavy drawdowns despite the extreme volatilities in BOTH the equity AND bond market.
Join for a 100% Risk-Free trial and see if our proven method can help you too.
