Summary:
- MCD announced new long-term targets at the end of 2023, including restaurant expansion of 4-5% annually going forward.
- Traffic development is weak, while MCD increased prices faster than peers over the past decade. MCD expects comparable sales growth in line with GDP growth going forward.
- MCD can payout 125% of Free Cash Flow without weakening the balance sheet, resulting in enhanced shareholder returns.
- My DCF valuation leaves me to assume that MCD is very close to fairly valued, with a small margin of safety.
- The major risk is that we do not know if MCD will be able to achieve the optimistic restaurant growth targets.
Anna Linda Knoll/iStock Editorial via Getty Images
Introduction
In my earlier articles on Starbucks (NASDAQ:SBUX), I commented about one of SBUX’s major peers in the restaurant industry, McDonald’s (NYSE:MCD). In my latest article on SBUX, I highlighted that MCD’s store growth plans are bullish for SBUX because they show that, despite having an enormous global footprint, MCD expects to be able to keep growing store (or restaurant) count by 4-5% annually going forward.
Since I already referred to it in the past, this is a good time to dedicate a stand-alone article to MCD. Since the nature of the business is very similar, I will structure this article the same way as I did in my prior SBUX articles. This article will cover the following topics:
- Business model
- Restaurant growth
- Comparable sales
- Financials
After that, I will finish with a separate section on valuation, risks, and a conclusion.
Business Model
I would be surprised if you don’t know McDonald’s, so I will just go over the most important points from an investor’s point of view. If you have read financial analysis on MCD before, you have probably seen this slide from MCD’s 2023 Investor Update:
MCD Business Model (2023 Investor Update Fact Sheets – Slide 2)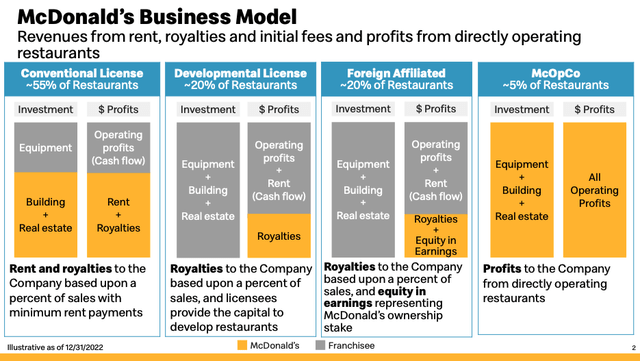
MCD only operates 5% of restaurants themselves. It collects franchise fees (royalties) for the remaining 95% of restaurants. Depending on the contract with the restaurant owner, MCD also collects rent (if it owns the ground and property) or equity earnings as a co-investor. A franchise contract usually grants the Franchisee the right to operate the restaurant for 20 years. After the initial 20 years, the contract gets renewed, MCD has to find a new Franchisee or the restaurant gets closed.
Business Model – Franchise System
The franchise fee is supposed to amount to 4% of sales for old restaurants (until the end of 2023) and 5% for new restaurants (opened in 2024 or later). Hence, MCD itself lists the fee as 4-5% on its website. Interestingly, I double-checked the actual reported numbers and came to the conclusion that in the years 2021-2023, the actual royalty fee seems to have been 4.5%, 50 basis points higher than the aforementioned 4%. Here is my calculation (numbers = $million):
| Year | 2021 | 2022 | 2023 |
| Systemwide sales | 112,500 | 118,200 | 129,500 |
| – company-operated sales | -9,788 | -8,748 | -9,742 |
| = Franchisee sales (A) | 102,712 | 109,452 | 119,758 |
| Reported royalty revenue (B) | 4,645 | 5,006 | 5,531 |
| (B) divided by (A) = Royalty fee % | 4.52% | 4.57% | 4.62% |
Systemwide sales refers to the sales of all restaurants, franchised and company-operated alike. By deducting the reported company-operated sales, we arrive at what I call “Franchisee sales” (the sales of the franchised restaurants). If the royalty fee amounted to 4% of sales in these years, royalty revenue should come very close to 4% of Franchisee sales. I am not 100% sure where the difference of 50 basis points comes from. However, with the now hiked fee of 5% for new restaurants (and re-contracted franchised restaurants), we should see this number rise over the coming years.
I also tried to find out how much rent MCD charges its Franchisees, but it is very difficult. We know that MCD charges a percentage of sales or a fixed amount as rent while setting a minimum rent. I used the same approach as I did in the table above while using the numbers MCD is giving us in the slide above. Here is my calculation:
| Year | 2021 | 2022 | 2023 |
| Franchisee sales | 102,712 | 109,452 | 119,758 |
| x (55/95) = Conventional License sales (A) | 59,465 | 63,367 | 69,334 |
| Reported rent revenue | 8,381 | 9,046 | 9,840 |
| (B) divided by (A) = Rent fee | 14.1% | 14.3% | 14.2% |
By multiplying the Franchisee sales x (55% conventional license/95% total franchised), we arrive at an estimated sales number for the restaurants that have to pay rent to MCD. When dividing the reported rent revenue by this number, we can conclude that a Franchisee who has to pay rent to MCD pays somewhere around 14% of sales as rent. This seems to be a very high number. Combined with the 4-5% royalty fee, Franchisees seem to pass over somewhere close to 20% of sales to MCD while paying all operating expenses.
While I am at it I want to discuss how the recent royalty fee hike should affect MCD’s Franchisees. If I were a Franchisee of MCD, I wouldn’t be happy about a 25% royalty fee hike.
MCD reports revenue and operating earnings for the restaurants they operate on their own. According to MCD, these numbers already include occupancy costs so I can only assume that rent expenses are already accounted for. Here are the numbers:
| Year | 2021 | 2022 | 2023 |
| Company-operated sales | 9,788 | 8,748 | 9,742 |
| Company-operated operating earnings | 1,740 | 1,368 | 1,517 |
| – New Royalty Fee (5% of sales) | -489.4 | -437.4 | -487.1 |
| Franchisee operating earnings (Estimate) | 1,250.6 | 930.6 | 1,029.9 |
| Franchisee operating margin | 12.8% | 10.6% | 10.6% |
By deducting 5% of sales from the company-operated operating earnings, we can estimate that a Franchisee generated a bit above 10% operating margin in 2022 and 2023. According to this article from CNBC, Franchisee EBITDA margins amount to somewhere around 12.25%, so the numbers seem to be pretty accurate. An operating margin of 10% after all expenses seems pretty good.
However, I think that for the Franchisees that have to pay rent to MCD, actual margins are substantially lower because the very high rents MCD charges to them are likely higher than the “occupancy costs” that are baked into the company-operated operating earnings. In conclusion, I guess that the newly implemented 5% royalty fee will take away a big chunk of earnings for the Franchisees that have to pay rent to MCD. Since these make up the largest part of franchised restaurants (55%), the new hike will improve MCD earnings while worsening the relationship between MCD and its Franchisees. I am not sure if this will become a bigger problem in the future but it is something to keep in mind, especially since MCD projects accelerating restaurant growth. If a Franchisee’s margin decreases due to fee hikes, the incentive for him/her to open new restaurants becomes lower. While I am at it, let’s turn toward the topic of restaurant growth.
Restaurant Growth
I will start this section with a chart that I have used before:
MCD Restaurant Count (Company reports – Chart by Author)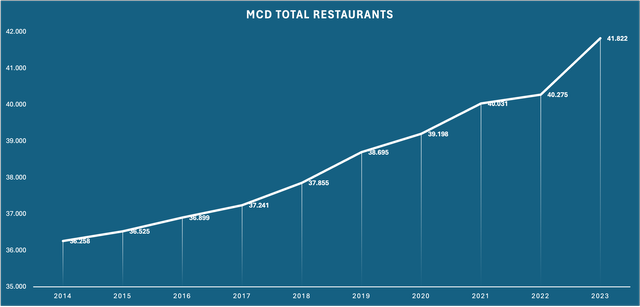
This chart looks better than it is. Here we can see that MCD grew restaurants from 36,258 in 2014 to 41,822 in 2023. The CAGR amounts to a meager 1.6% over the last decade which is much lower than that of SBUX.
However, the reason for this is that MCD shifted restaurant distribution from “company-operated” to “franchised” over that timeframe. Here is another chart showing the % of franchised restaurants:
MCD Franchised Restaurants % (Company reports – Chart by Author)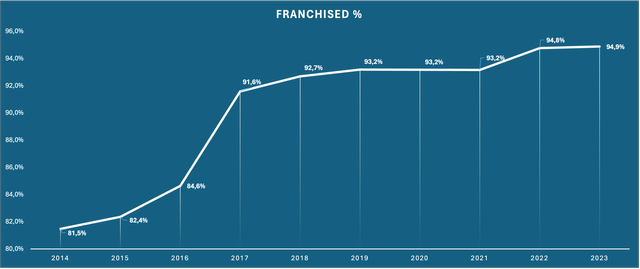
MCD made steady progress towards a greater percentage of its restaurants being franchised rather than self-operated. As we will see later, this also has major financial implications.
The key takeaway here is that the shift towards franchised restaurants seems to be over. With 95% of restaurants being franchised as of today, the growth rate of franchised restaurants will become much more relevant in the future. Here is another chart showing the YoY growth rates for MCD’s franchised restaurants:
MCD YoY Franchised Restaurants Growth (Company reports – Chart by Author)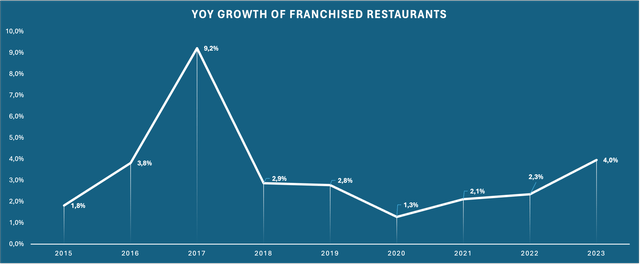
Here we can see that MCD has grown franchised restaurants in the range of 3% per year (the 10-year CAGR came in at 3.33% but is a bit skewed due to the huge spike in 2017).
As I highlighted in my published SBUX articles, the main growth drivers for restaurant companies like MCD are (1) store/restaurant growth or “footprint growth” and (2) same-store sales growth or comparable sales growth. I will come back to comparable sales in the next chapter and focus on restaurant growth for now. On December 6, 2023, MCD announced new targets for the upcoming years. The announcement included a new target of 4-5% annual restaurant unit growth for the long term beyond 2024. This is far above the restaurant growth we have seen over the past decade (1.6%) but in this case, this seems to be achievable. Restaurant unit growth over the past decade was hindered because MCD focused on restructuring away from self-operated restaurants towards franchised restaurants. Now that this restructuring is close to finished, MCD can focus on expanding its footprint by opening new restaurants. I still have some concerns regarding what I wrote earlier, that Franchisees might be hesitant to expand due to the 2024 royalty fee hike. It remains to be seen if this will be the case. For now, I will assume that MCD reaches the target of 4-5% restaurant growth going forward.
Comparable Sales
Unlike as for SBUX, where comparable sales were reported in detail for a very long time, MCD is a bit more secretive about the metrics we need. As a reminder: Comparable sales refers to YoY sales growth for an already open restaurant and always consists of two separate metrics. (1) “Traffic” refers to the number of transactions or customers that take place/visit the restaurant and (2) “Pricing” refers to price increases. Here is my overview of the metrics I could find:
MCD Comparable Sales Date Overview (Company reports or Earnings Calls)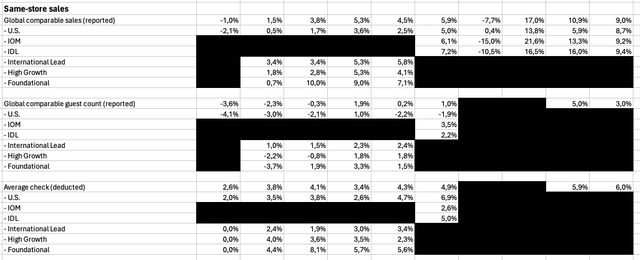
Note that MCD restructured its reporting segments in 2019. IOM refers to internationally developed markets like the U.K., Canada, and France while IDL refers to other markets like Brazil, China, and Japan. As you can see many data points are missing, especially since 2020, the year of the pandemic. This leaves us with a big problem. We can’t figure out if the customers that were lost during the pandemic have been coming back in the past 2-3 years.
If we were to only look at global comparable sales pre-pandemic, the growth rate hovered from low to mid-single digits. In 2020, the year of the pandemic, global comparable sales tanked 7.7%. In the past three years (2021-2023) global comparable sales have seen a nice rebound because the restaurants began to operate without pandemic-related limitations.
The most important data point here is the development of MCD’s comparable guest count. And this is also where things get a bit worrying. MCD reported comparable guest count growth (which is equal to what I called “Traffic” earlier) on a global and segment basis every year from 2014 to 2019. As soon as the pandemic hit, MCD stopped reporting this metric completely. Only in the last two years comparable guest count growth was mentioned on the year-end earnings calls. Assuming that MCD raised prices quite drastically in 2020 (SBUX for example increased prices by 10% in 2020), comparable guest count should have declined close to 20% in 2020 (Again: SBUX Traffic declined 22% in 2020). Further assuming that half of these guests came back in 2021, the total comparable guest count today is probably still lower than the equivalent number in 2019. However, this fits the picture of pre-pandemic comparable guest count growth numbers, as we can see in the following table:
| Year | 2014 | 2015 | 2016 | 2017 | 2018 | 2019 |
| Comparable Guest Count Growth | -3.6% | -2.3% | -0.3% | 1.9% | 0.2% | 1.0% |
Pre-pandemic, MCD comparable guest count was flat to slightly negative. This is not a good sign for restaurant companies like MCD because we preferably want to see at least low single-digit organic traffic growth.
Since global comparable sales increased despite traffic being flat, we can conclude that MCD must have increased prices at a very fast pace. And again, here is a table showing MCD’s price increases as far as we know (MCD calls this “average check”):
| Year | 2014 | 2015 | 2016 | 2017 | 2018 | 2019 | 2022 | 2023 |
| Average Check Growth % | 2.6% | 3.8% | 4.1% | 3.4% | 4.3% | 4.9% | 5.9% | 6.0% |
Note that we don’t have numbers for 2020 and 2021 because MCD didn’t provide them in their reports or earnings calls. As we can see, MCD increased prices in the mid-single-digit percentage range, quite above inflation. Here is a chart from a FinanceBuzz article showing the increase in menu prices of several fast food chains compared to actual inflation:
Fast Food Price Inflation (financebuzz.com Article)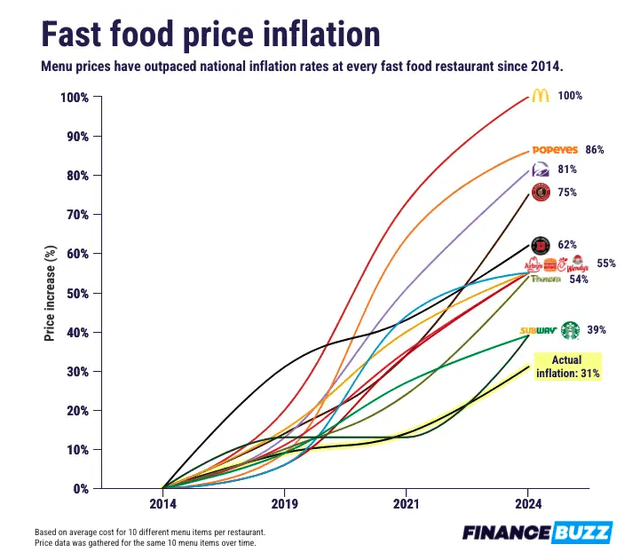
As we can see, MCD is leading the pack by a healthy margin.
The big question is: Is this sustainable? And the simple answer is no. This also becomes clear when we take a look at management’s projections for the long term. In the aforementioned announcement (where MCD announced the new restaurant growth targets), MCD also announced that over the long term, systemwide sales for existing restaurants are expected to grow around 2.5% annually. Note that this accounts for both Traffic and Pricing. In conclusion, MCD expects no comparable guest count growth and pricing growth in line with or slightly above inflation going forward. In my opinion, this seems very reasonable when we factor in that MCD has seen no comparable guest count growth in the past and further price increases should not be achievable without losing customers. I will calculate with MCD’s estimate of 2.5% comparable sales growth going forward.
Financials
I will divide this financial overview into three parts:
- Balance Sheet
- Earnings Metrics
- Financial Metrics
(1) Balance Sheet
As I always do, I will start with a screenshot of the last reported balance sheet:
MCD Q1 24 Balance Sheet (MCD Q1/24 10-Q Filing)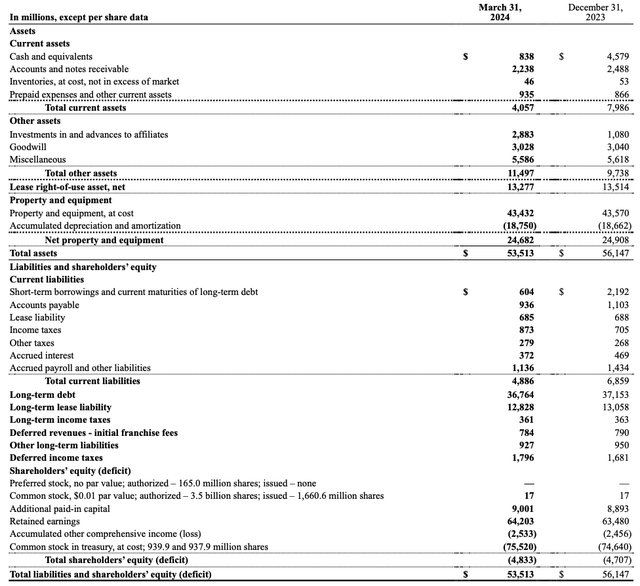
There are some important takeaways here.
The Goodwill position is small at only $3 billion which is a good thing because it shows that MCD can grow organically without relying on big acquisitions.
Net debt amounts to $36.53 billion ($838 million cash and equivalents – $604 million short-term borrowings – $36,764 million long-term debt) which looks pretty high. However, since FY23 EBITDA came in at $13.6 billion, Net debt/EBITDA (a frequently used leverage metric) comes in at “only” 2.7x. While this is not a very good ratio, it is comfortable for a predictable fee business like MCD.
One thing that might scare investors away is the shareholders’ equity position which shows a deficit of $4,833 million. Negative equity means MCD is in a bad financial spot, right? Not exactly. This deficit can stem from (1) insufficient assets to cover the company’s liabilities (not the case for MCD) or (2) understated assets that are carried far below fair value on the balance sheet (which is the case here). In the case of MCD, we can already see that the problem lies in the accumulated depreciation and amortization of MCD’s property and equipment, namely the owned restaurants. In my hometown here in Germany, there is one MCD restaurant right at the highway that was opened back in 2000. This restaurant is still running today, 24 years later, and is probably accounted for at 40% of construction/purchasing costs on MCD’s balance sheet (MCD uses a 40-year depreciation timeframe). In the meantime, construction and land prices have risen drastically, so the true value of this restaurant is probably somewhere in the range of 4x reported value. It is safe to say that the $18,750 million accumulated depreciation and amortization needs to be added back to equity to value MCD’s properties at least at construction/purchase costs. In this case, the “adjusted equity” would be somewhere around $13-14 billion and this would probably still be an understatement. In my opinion, the negative equity is nothing to worry about.
(2) Earnings Metrics
This is another very interesting topic. Let me start with a chart showing MCD’s revenue over the past decade:
MCD Revenue since 2014 (Company reports – Chart by Author)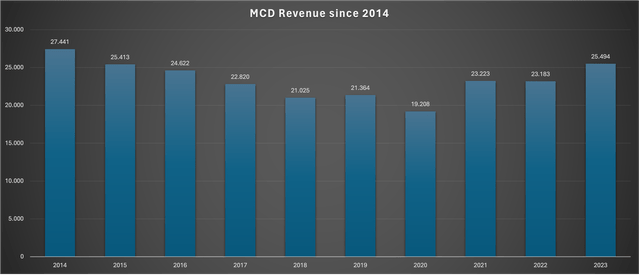
What a depressing chart. The problem here is that the restructuring towards more franchised restaurants led to declining sales because the company-operated restaurants contribute all their sales to the top line while franchised restaurants only contribute royalty and rent fees. Hence, the revenue development of the past has no use for our analysis.
Since franchised restaurants have a much better margin profile, MCD’s consolidated operating margin expanded a lot over the past decade:
MCD Operating Margin since 2014 (Company reports – Chart by Author)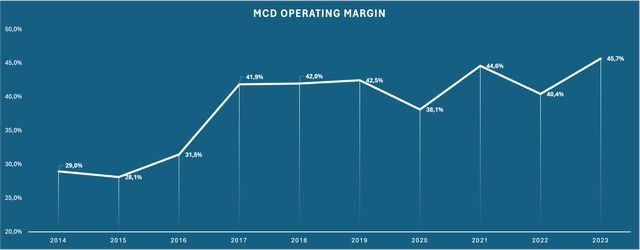
With 95% of restaurants being franchised now, the future upside from further margin expansion should be limited. MCD still expects continued operating margin expansion but doesn’t give a specific range (again announced in the December 2023 Announcement I mentioned earlier).
The most important metric going forward, in my opinion, will be systemwide sales, a metric that has been reported for a long time but wasn’t very useful due to the restructuring process towards franchised restaurants. With very few company-operated restaurants left, systemwide sales (as the main driver of rent and royalty fees because these are calculated off of franchised restaurant sales) will become the main reporting metric over the next few years. Here is a chart showing systemwide sales growth rates over the past decade:
MCD Systemwide Sales since 2014 (Company reports – Chart by Author)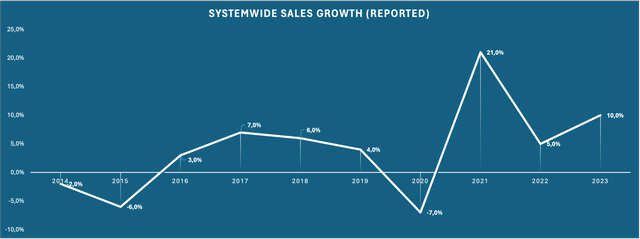
Here we can see that besides struggling in 2014/2015 and 2020, systemwide sales increased somewhere in the low to mid-single digits. Note that this is a combination of every growth factor I highlighted throughout this article: Restaurant count growth, Traffic, and Pricing. The CAGR for systemwide sales from 2014 to 2023 came in at 4.42%. If we exclude the effect of restaurant growth of 1.6% CAGR, organic CAGR should have been around 2.8% which expresses the effects of pricing minus guest count declines.
To close this part, here is a chart showing operating earnings, net earnings (both US-GAAP numbers) and free cash flow (FCF) since 2014:
MCD Earnings Metrics since 2014 (Company reports – Chart by Author)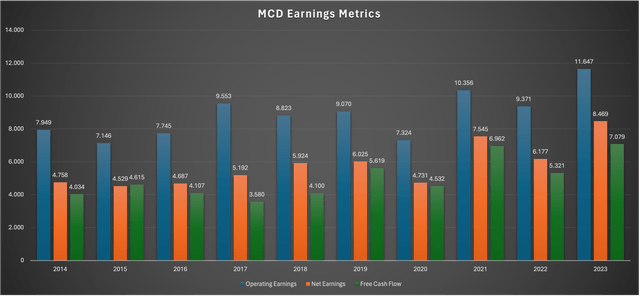
Here we can see that operating and net earnings have been growing steadily, albeit not that fast (4.34% CAGR for operating and 6.62% CAGR for net earnings).
(3) Financial Metrics
This is where I will cover all of the metrics that are not directly reported in the balance sheet or income statement. I will start with returns on capital, one of the most important metrics for any business (in my opinion). Here is a table showing MCD’s ROCE (return on capital employed) since 2014:
MCD ROCE since 2014 (Chart by Author – Data from company Filings)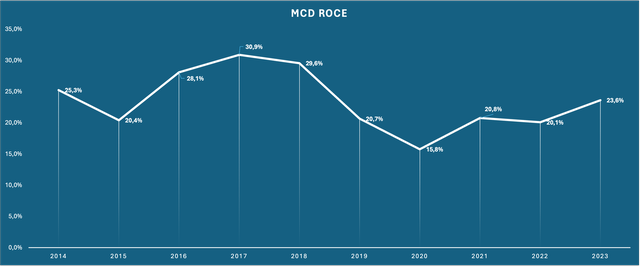
Quick reminder: I define ROCE as Operating Earnings divided by Capital Employed, with Capital Employed consisting of shareholders’ equity + non-current liabilities. Here we can see that, excluding the pandemic year 2020, MCD has been able to generate returns on capital in the 20+% range. That is a very good return and shows that MCD generates returns on capital above its cost of capital, creating value for shareholders in the process.
MCD capital employed only grew at a CAGR of 5.1% since 2014 which is a bit disappointing but can be easily explained. MCD pays out all of its earnings to shareholders (I will come back to this very soon), so there is no reinvestment of net earnings that would boost the shareholders’ equity position. Since MCD also doesn’t perform big acquisitions, the capital base is not growing. The 5.1% CAGR I mentioned above is 100% attributable to changes in accounting. MCD has to account for lease liabilities on its balance sheet since 2019. This led to a big hump of capital employed from 2018 to 2019 of $14 billion. If these accounting practices wouldn’t have changed, the capital base wouldn’t have changed at all.
Now I want to turn towards several metrics that will be significant for the valuation I will perform later. I want to start with MCD cash-conversion ratio. Cash conversion refers to the % of FCF a company gets out of $1 of net earnings. The cumulative FCF for the years 2014 to 2023 amounted to $49,950 million while the cumulative net earnings amounted to $58,038 million. In conclusion, the cash conversion came in at 86% over the long-term average. In the December 2023 announcement, MCD targets a cash conversion in the 90% range going forward, but this number doesn’t account for share-based compensation while I already deducted this number. I will assume a cash-conversion ratio of 86% going forward, in line with historic results.
Maybe the most important topic when performing financial analysis on MCD is the payout ratio. I will start by looking at what I call the “Total Payout Ratio”. What I call “Total Payout” refers to everything that can be seen as a shareholder return or dilution, so dividends, share buyback, issuance of shares, or share-based compensation. Here is a table showing what I mean:
| Free Cash Flow FY14-FY23 | $49,950 million |
| Total Payout FY14-FY23 | $75,415 million |
| Total Payout Ratio | 151% |
Over the last decade, MCD paid out 151% of FCF to shareholders. How is that possible? Let me quote from one of my older articles on Home Depot and Lowe’s:
Can this go on going forward? To be honest, I think it can, albeit probably at a slower pace. HD and LOW are what some people refer to as cannibal stocks because they repurchase shares while using debt to accelerate this process, ultimately leading to what people perceive to be a “weak balance sheet”, a myth that I already debunked earlier.
What they are doing is very simple. If company A generates $100 million in FCF and has $300 million net debt, the net debt stands at 3x FCF. When the FCF grows to $110 million the following year and the company just pays out all the FCF to shareholders, it will still have $300 million in net debt but an FCF of $110 million. So the following year, net debt is only 2.73 times FCF. If the company now borrows an additional $30 million, the net debt will keep sitting at 3x FCF (the balance sheet doesn’t get weaker!) while the company can pay out 130% of FCF instead of “only” 100%. So it ultimately comes down to ((A)) the relation of net debt to earnings/FCF and (B) the organic FCF growth rate.
Source: Author’s article from January 29, 2024
So MCD can keep net debt/EBITDA (and therefore the balance sheet) unchanged while paying out above 100% of FCF! To further elaborate on my point, here is a chart showing MCD’s net debt/EBITDA since 2014:
MCD Net Debt/EBITDA (Chart by Author – Data from company Filings)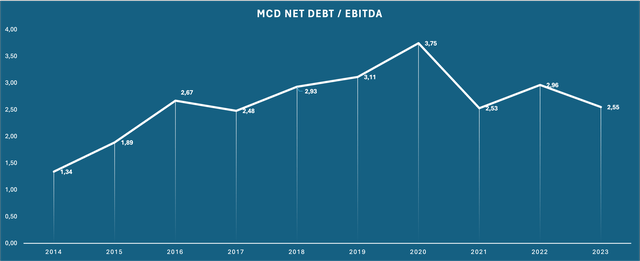
Here we can see that MCD significantly levered its balance sheet from 2014 to 2016 and remained in the 2-3x range since then. To not include the leverage process until 2016, I will just make another calculation of the Total Payout ratio for the following years 2017-2023:
| Free Cash Flow FY17-FY23 | $37,193 million |
| Total Payout FY17-FY23 | $46,647 million |
| Total Payout Ratio | 125% |
This number is already lower because we excluded the one-time leveraging process that took place in the early years. However, this means that MCD has been able to pay out 125% of FCF since 2017 without weakening the balance sheet in any way. I think it is reasonable to assume that this practice will continue, so we will have to consider this later when we value MCD (I will come back to this).
So if MCD paid out more than they earned and didn’t pay it out in dividends, the share count should have decreased drastically, right? Here is a chart showing MCD share count since 2014:
MCD Shares Outstanding since 2014 (Company reports – Chart by Author)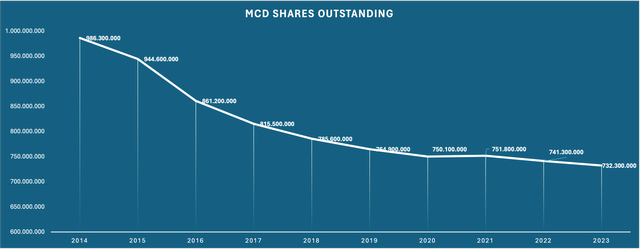
MCD bought back shares at a CAGR of -3.25% since 2014, or in the range of 2-3% per year in more recent years when the company didn’t change the leverage ratio. As a result, earnings per share (EPS) grew at a faster pace than net earnings. While net earnings only grew at a CAGR of 6.62% over the past decade, EPS grew at 10.2%.
Q1 24 Results
I also want to briefly address the Q1 24 results that were announced on April 30, 2024. I will focus on the most important metrics I highlighted throughout this article. Here is a quick overview of the YoY performance:
| Global comparable sales | +1.9% |
| Systemwide sales | +3% |
| Operating Earnings | +8% |
| Earnings per share | +9% |
| Restaurant growth | +3.66% |
As we can see, operating earnings grew faster than sales due to continued margin expansion, while earnings per share grew even faster due to ongoing share repurchases.
Despite restaurant growth of 3.66%, systemwide sales only grew at 3% which looks odd at first but can be explained by the fact that a newly opened restaurant will generate far less sales than one that has been in operation for several years. With global comparable sales being up 1.9% (below my and the company’s long-term assumptions going forward), the new restaurants added the remaining 1.1% growth to systemwide sales.
Overall, the report looks more disappointing than encouraging, and the share has been trading flat since the announcement. Restaurant growth and global comparable sales growth came in below the companies announced targets of 4-5% and 2.5% respectively. It should be monitored if MCD manages to reach these targets over the next few quarters.
Valuation
At the end of Q1 24, there were 725,900,000 million shares outstanding. With MCD stock currently trading at $272.38 per share, the market capitalization currently amounts to $197.7 billion. Net earnings for the trailing twelve months came in at $8,596 million, so MCD is currently trading at exactly 23x earnings.
I highlighted earlier that in a normal year, MCD should be able to convert 86% of net earnings into FCF, so $7,392 million. This means that MCD is currently trading at 26.7x normalized FCF or a FCF yield of 3.74%.
This is where the heightened payout ratio comes into play. The FCF yield tells us how much cash MCD could pay out to us when it pays out 100% of FCF. We know that MCD should be able to (and probably will) pay out 125% of FCF to us. This would put the actual FCF yield at 3.74%x125% = 4.67%, a number that looks much more attractive.
I always say that I think the long-term returns of any stock should be the sum of (a) the FCF yield or what the company can pay out to us and (b) the FCF growth rate. In the case of MCD, (b) is the sum of restaurant and comparable sales growth. Throughout this article, I assumed that MCD should be able to grow restaurants at 4-5% (as they guided) and comparable sales at 2.5% per year. This would put the growth rate at 7%. So summing it up, we may be looking at somewhere around 7%+4.67% = 11.67% total returns (pre-tax), a good outlook for a defensive blue-chip like MCD.
I will also perform a supplemental DCF valuation to see if we have to expect tailwinds or headwinds from a valuation side. I will assume $12.73 per share as the starting FCF ($272.38 share price x 4.67% FCF yield), 7% growth for 10 years, 4% growth into perpetuity (2.5% comparable sales in line with inflation/GDP growth and 1.5% restaurant growth) and a 10% discount rate. Here is the result:
MCD DCF Valuation (moneychimp.com)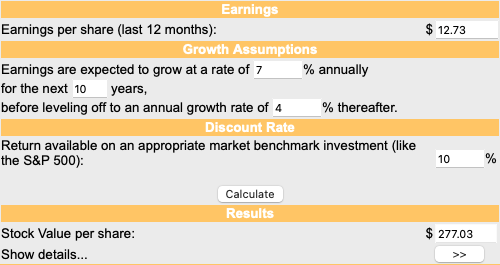
My assumptions leave me to assume that MCD is very close to fairly valued, with the fair value probably sitting at $277 per share.
Risks
Since MCD is a blue-chip stock with low volatility, risks are naturally low. MCD guides for comparable sales growth of only 2.5% going forward which is in line with GDP growth and probably accounts for flat guest count coupled with price increases in line with inflation.
The only main risk lies in the new restaurant expansion target. As I highlighted throughout this article, MCD expects 4-5% annual restaurant growth going forward which is much higher than the historic restaurant growth rate. My main concern is that MCD decided to raise the royalty fee for new restaurants by 25% (from 4% to 5%), effective starting 2024, while simultaneously setting much higher restaurant expansion targets. We shouldn’t forget that as of right now, 95% of MCD restaurants are operated by Franchisees. This means that it is not solely in the hands of MCD to decide about restaurant expansion. If Franchisees decide to not expand operations because the new royalty fee makes is not profitable, MCD will get into problems reaching their optimistic restaurant growth targets.
In conclusion, the main thing to look out for will be if MCD can deliver on their optimistic restaurant growth plans. This should be closely monitored in the upcoming quarters.
Conclusion
The MCD share price had a hard time over the past year, as can be seen in the following chart:
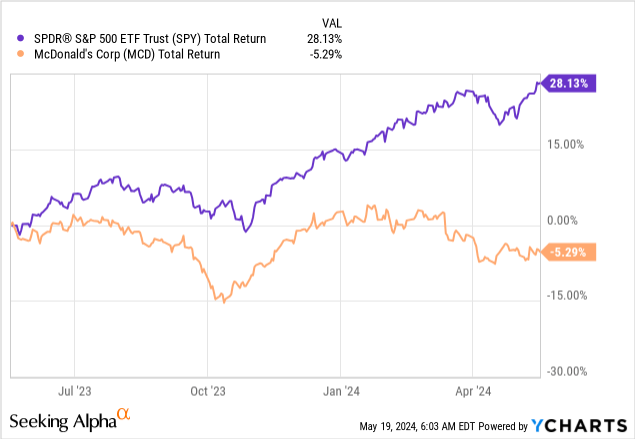
MCD underperformed the broader index by a wide margin. Meanwhile, FY23 earnings per share were up 39% compared to FY22. Hence, the valuation multiple fell from 31.6x earnings at the end of FY22 to 25.6x at the end of FY23, down to the current 23x earnings. The last time we have seen a valuation level like this (on a year-end basis) was in 2018, at a time where the whole stock market tanked significantly.
The new restaurant growth targets are very bullish, but concerns regarding the achievability remain.
My DCF valuation indicates that MCD is very close to fairly valued when I use management’s future growth expectations and reasonable perpetual growth expectations. However, reaching these expectations, coupled with an ongoing heightened payout ratio while keeping leverage unchanged, should result in total returns in the range of 11.5% going forward. This leaves a small margin of safety, which looks good enough for a non-volatile blue-chip stock like MCD.
In conclusion, I initiate coverage on MCD with a buy rating. The main thing to look out for in the upcoming quarters/years will be if MCD will deliver on the optimistic restaurant growth targets that were set at the announcement in December 2023.
Analyst’s Disclosure: I/we have no stock, option or similar derivative position in any of the companies mentioned, and no plans to initiate any such positions within the next 72 hours. I wrote this article myself, and it expresses my own opinions. I am not receiving compensation for it (other than from Seeking Alpha). I have no business relationship with any company whose stock is mentioned in this article.
Disclaimer: Any material in this article should not be relied on as a formal investment recommendation. Never buy a stock without doing your own thorough research.
Seeking Alpha’s Disclosure: Past performance is no guarantee of future results. No recommendation or advice is being given as to whether any investment is suitable for a particular investor. Any views or opinions expressed above may not reflect those of Seeking Alpha as a whole. Seeking Alpha is not a licensed securities dealer, broker or US investment adviser or investment bank. Our analysts are third party authors that include both professional investors and individual investors who may not be licensed or certified by any institute or regulatory body.
